Cuathro EMA StrategyIt's a long term script based on multiples EMA, crossover and crossunder. Based on two good scripts CM Sling and OCC. Always adjust resolution at least twice than chart. Enjoy it! BTCUSDPine Script®策略由moneros提供已更新 11155
EMA EnvelopeThis is an attempt to convert gunbot's SG strategy into a proper TradingView strategy. The problem is that SG Sell Level relies on % above purchase price, which we don't actually know in TradingView. So we could try to get the average of the next bar or something, which maybe this is what the Slippage setting is? I'm not sure. Anyways, using % above EMA does actually work as a strategy a bit. It's nothing like Turtle Rules by tmr0 though! Will keep working on this gradually; feedback greatly appreciated!Pine Script®策略由vosechu提供22166
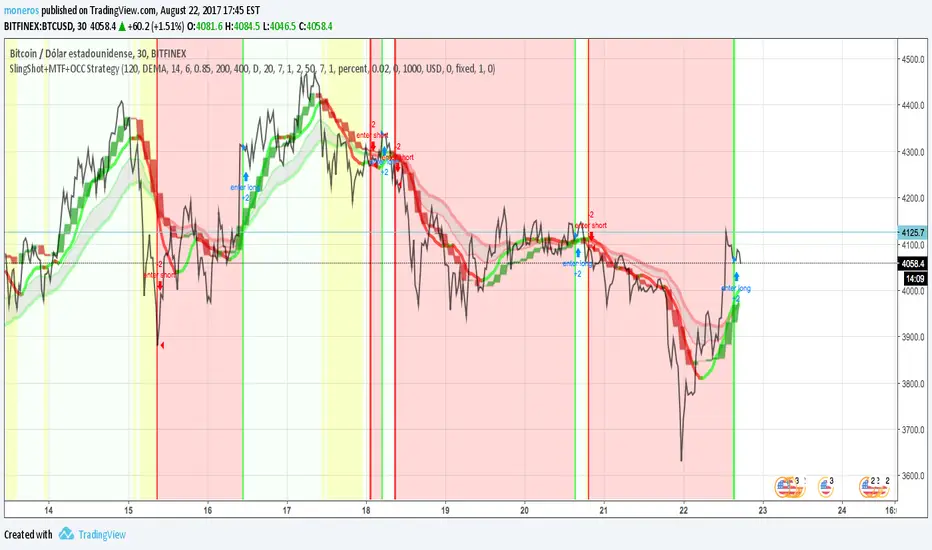
SlingShot + MTF + Open Close Cross StrategyIt's a merge of three really good scripts CM sling shot, CM MTC and Open Close Cross Indicates open and close with Sling shot and shots after peaks by MTC and OCC. Yellow zones before drop prices, green bar, red bar for open and close. imgur.com Pine Script®策略由moneros提供44 1 K
9/21 MovingAvg Cross Signal EGAV.35Simple buy/sell signal with 9 & 21 ema cross over/under, works better in Daily ChartsPine Script®策略由MichMexTrade提供162
HL2 - 22 EMA Cross for RenkoEURUSD This is a simple strategy to use for those who like Renko bars. I ONLY use it on Renko. Basic idea is that when the Renko bar closes above or below the 22 EMA, you go long or short. However, some of the frustrations I've had with any strategy shared in Tradingview is so few folks put in the ability to set a stop or a profit target or the ability to set a specific time to trade. I have added those to this strategy. (And I for the life of me can not remember where I got the code for the the time, I need to find you!). Special note: If you have never used the Renko bars in Tradingview, make sure you click the Format option next to whatever pair you are looking at and change it from Traditional to ATR. You can set it for a static pip amount if you want. But ATR at first will help you decide which amount of pips you should throw in. This is my first published strategy so if I screwed up on anything or didn't explain it very well, please let me know!!Pine Script®策略由itsjustanalysis提供44299
Combining Exponential And Volume Weighting Backtest The related article is copyrighted material from Stocks & Commodities 2009 Oct You can change long to short in the Input Settings Please, use it only for learning or paper trading. Do not for real trading.Pine Script®策略由HPotter提供27
Gold/Silver 30m Only Strategy Buy/Sell SignalsIn my free time I felt like coding this strategy, and after backtesting it, it appears that the 30m time frame is the most profitable. I only have been working on it for gold, but it should work similarly for silver as well. This includes no pyramiding, and with pyramiding orders of 5, this strategy is upwards of 100% profitable. Buy order - when price is above the 162 day EMA and RSI is less than 35 Sell order - when price is below the 162 day EMA and RSI is greater than 65 I will probably be adjusting it to increase the profitability and %success rate. Pine Script®策略由MtxTrader提供22 1.7 K
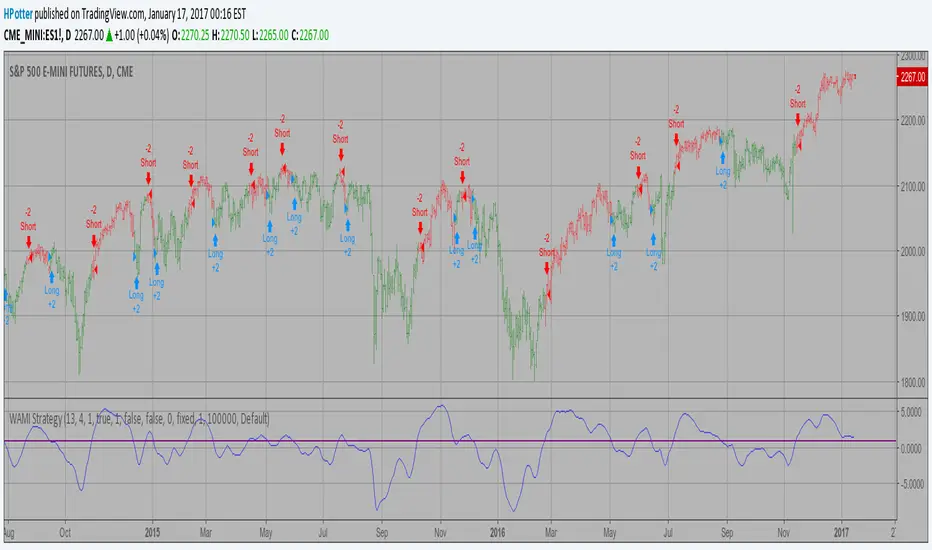
WAMI Strategy Backtest The WAMI-based trading lies in the application and iteration of the optimization process until the indicated trades on past market data give consistent, profitable results. It is rather difficult process based on Fourier analysis. You can to change Trigger parameter for to get best values of strategy. You can change long to short in the Input Settings Please, use it only for learning or paper trading. Do not for real trading.Pine Script®策略由HPotter提供22117
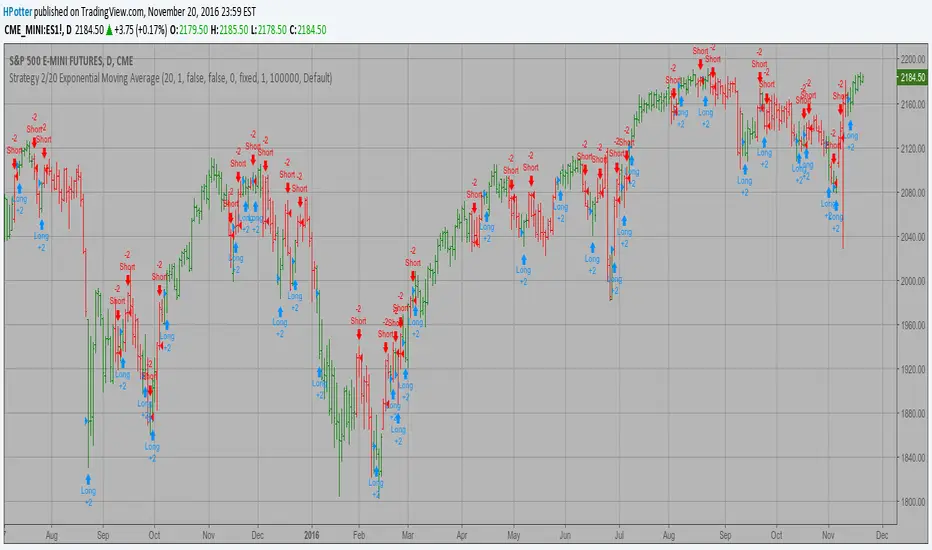
2/20 Exponential Moving Average Backtest Strategy This indicator plots 2/20 exponential moving average. For the Mov Avg X 2/20 Indicator, the EMA bar will be painted when the Alert criteria is met. You can use in the xPrice any series: Open, High, Low, Close, HL2, HLC3, OHLC4 and ect... You can change long to short in the Input Settings Please, use it only for learning or paper trading. Do not for real trading.Pine Script®策略由HPotter提供171
2/20 Exponential Moving Average StrategyThis indicator plots 2/20 exponential moving average. For the Mov Avg X 2/20 Indicator, the EMA bar will be painted when the Alert criteria is met. Please, use it only for learning or paper trading. Do not for real trading.Pine Script®策略由HPotter提供158
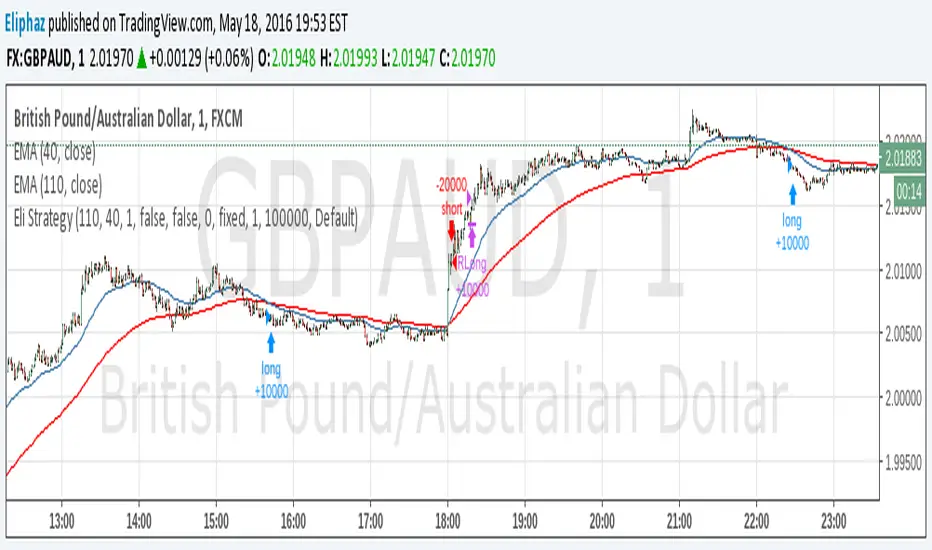
EMA Intraday StrategyHere is a EMA intraday strategy. very profitable on the GBPAUD 1M charts if you are watching very closely, working on coding a indicator for itPine Script®策略由Eliphaz提供145
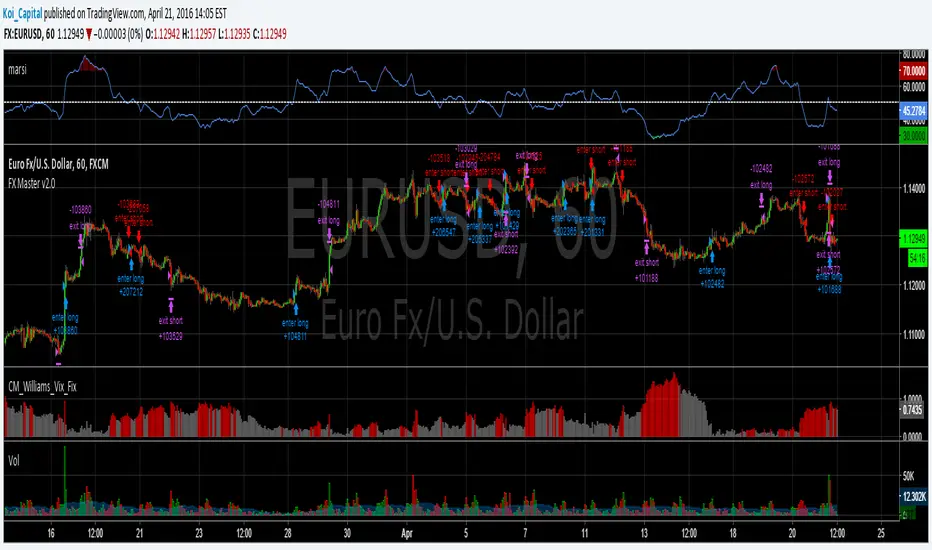
Forex Master v2.0 (EUR/USD)This is version 2 of my Forex Master algorithm originally posted here: BACKTEST CONDITIONS: Initial equity = $100,000 (no leverage) Order size = 100% of equity Pyramiding = disabled TRADING RULES: Long entry = EMA5(RSI20) cross> 50 Profit limit = 50 pips Stop loss = 50 pips Short entry = EMA5(RSI20) cross< 50 Profit limit = 50 pips Stop loss = 50 pips Long entry = Short exit Short entry = long exit DISCLAIMER: None of my ideas and posts are investment advice. Past performance is not an indication of future results. This strategy was constructed with the benefit of hindsight and its future performance cannot be guaranteed.Pine Script®策略由Stable_Camel提供11255
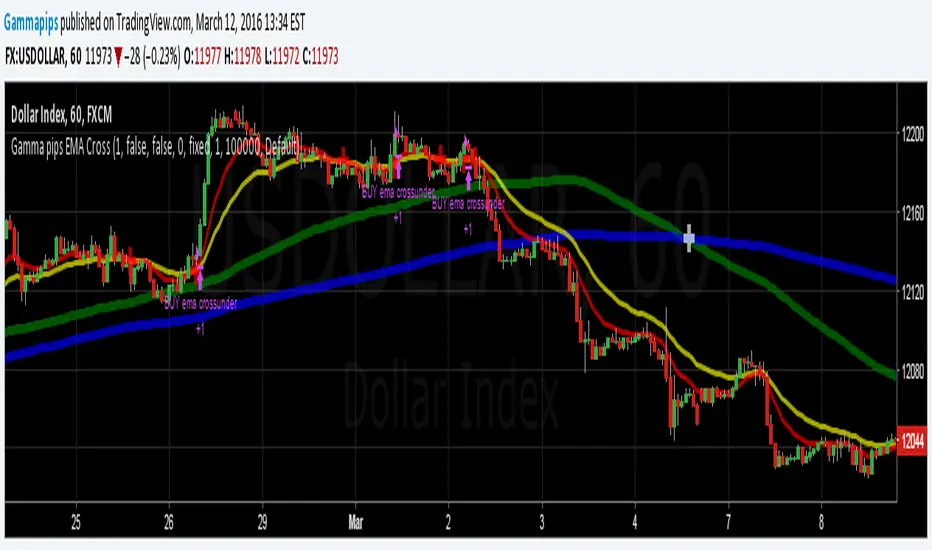
MA Cross - ***Programmers*** Please help with alertcondition() Hello Traders and coders, Here is a fundamental version of a moving average cross trading strategy that works on 1H and 4H timeframes. It's very simple and would be well paired with proper technical analysis and risk management. I am looking to use this to alert me of potential setups. I could not get the alertcondition function to work properly. If anyone can help me with that please comment or message me.Pine Script®策略由pAulseperformance提供66536
SPY Master v1.0This is a simple swing trading algorithm that uses a fast RSI-EMA to trigger buy/cover signals and a slow RSI-EMA to trigger sell/short signals for SPY, an xchange-traded fund for the S&P 500. The idea behind this strategy follows the premise that most profitable momentum trades usually occur during periods when price is trending up or down. Periods of flat price actions are usually where most unprofitable trades occur. Because we cannot predict exactly when trending periods will occur, the algorithm basically bets money on all trade opportunities during all market conditions. Despite an accuracy rate of only 40%, the algorithm's asymmetric risk/reward profile allows the average winner to be 2x the average loser. The end result is a positive (profitable) net payout. TRADING RULES: Buy/Cover = EMA3(RSI2) cross> 50 Sell/Short = EMA5(RSI2) cross< 50 BACKTEST SETTINGS: - Period = March 2011 - Present - Initial capital = $10,000 - Dividends excluded - Trading costs excluded PERFORMANCE COMPARISON: There are 657 trades, which means 1,314 orders. Assuming each order costs $2 (what I pay for at Interactive Brokers), total trading costs should be $2,628. -SPY (buy & hold) = 132.73 ---> 193.22 = +45.57% (dividends excluded) -SPY Master v1.0 = $12,649 - $2,628 = $10,021 = +100.21% DISCLAIMER: None of my ideas and posts are investment advice. Past performance is not an indication of future results. This strategy was constructed with the benefit of hindsight and its future performance cannot be guaranteed.Pine Script®策略由Stable_Camel提供55 1 K
Forex Master (EUR/USD)ATTENTION: This is a symmetrical algorithm designed only for trading EUR/USD on the 1h time frame. For other currency pairs and time frames, you need to re-calibrate the RSI-EMAs as well as the profit targets and stop losses. BACKTEST CONDITIONS: Initial equity = $100,000 (no leverage) Order size = 100% of equity Pyramiding = disabled TRADING RULES: Long entry = EMA20(RSI10) cross> 50 Profit limit = 50 pips Stop loss = 50 pips Short entry = EMA30(RSI30) cross< 50 Profit limit = 50 pips Stop loss = 50 pips Long entry = Short exit Short entry = long exit DISCLAIMER: None of my ideas and posts are investment advice. Past performance is not an indication of future results. This strategy was constructed with the benefit of hindsight and its future performance cannot be guaranteed.Pine Script®策略由Stable_Camel提供22881
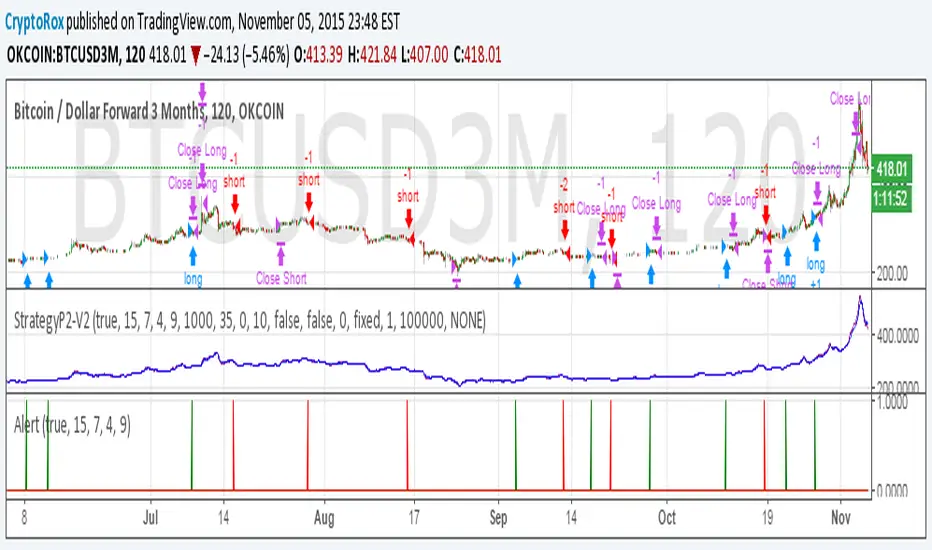
P2-V2 - BTC StrategyP2-V2 also known as Penner2.0 began with a TEMA and MA cross on Heiken Ashi, a strategy brought to us by a group of crypto traders. Since then we've added a few more indicators and played around with the rules. This is an early release as I have yet to go through the full automation aspect, however, I know some of you would like to see where it's at. If you'd like to learn how to automate a full strategy using the Chrome Extension, go to the linked idea for a eurusd setup.Pine Script®策略由CryptoRox提供已更新 1313 1.1 K
[STRATEGY][RS]MicuRobert EMA cross V2Great thanks Ricardo , watch this man . Start at 2014 December with 1000 euro.Pine Script®策略由MicuRobert提供1212 4 K