Simple EMA20 Strategy + StochasticThis is a Trend Following Strategy.
The intent of this strategy is to catchthe price as it trends higher than the 20-period EMA and sell immediately after the price closes below it.
I have implemented calculations from Stochastic to make sure the price is coming from an oversold area.
There is also a check to see if the 20-period EMA is trending higher than before.
指數移動平均線(EMA)

Larry Williams 3 Period EMAs strategyLarry R. Williams explains this strategy in his book "Long-Term secrets to Short-Term trading", it consists of using two 3-period EMAs, one representing the Highs and the other the Lows.
When the price falls below the 3-period Lows EMA we have a long signal.
The trade is closed when the price closes above the 3-period Highs EMA . BINANCE:BTCUSDT

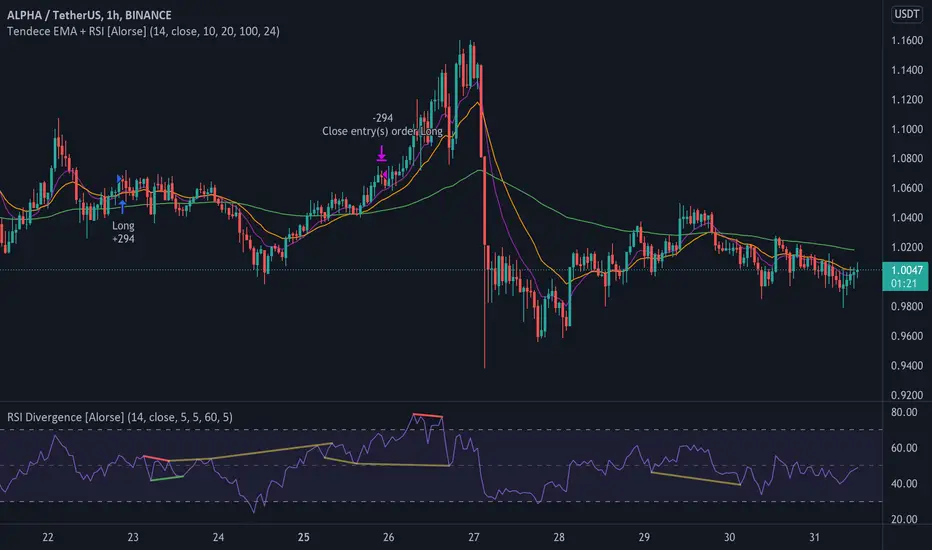
Tendency EMA + RSI [Alorse]A very simple and highly effective strategy LONG & SHORT that combines only 2 indicators:
RSI
3 Moving Average Exponential (EMA)
LONG Entry conditions are:
EMA 20 cross over EMA 10
EMA 10 is above EMA 100
LONG Exit conditions are:
RSI greater than 70
Or when X number of candles have passed and the trade is in profit. (Check Settings)
SHORT Entry conditions are:
EMA 20 cross under EMA 10
EMA 10 is below EMA 100
SHORT Exit conditions are:
RSI is less than 30
Or when X number of candles have passed and the trade is in profit. (Check Settings)
Forex Fractal EMA ScalperThis is a forex scalper designed for very short timeframes 1-5 min max.
At the same time due to the short timeframe, is recommend to re optimize it weekly .
Its components are
Fractals
Triple EMA with different lengths
Rules for entry:
For long : we have an up fractal and all 3 ema are in ascending order
For short: we have a down fractal and all 3 ema are in descending order.
Rules for exit
We exit when we either get a reverse order or when we hit the take profit or stop loss calculated in fixed pips.

Arch1tect's New Toy (Strategy Tester Version)Description:
The version of Arch1tect's New Toy indicator with Strategy Tester added.
This indicator tries to predict market trends by simply utilising 2 moving averages crossovers.
How it works:
Buy signals are triggered when the faster MA crosses over the slower MA from the downside to the upside.
Sell signals are triggered when the faster MA crosses under the slower MA from the upside to the downside.
How to use:
Take buys when buy signal is triggered AND close existing sell position
Take sells when sell signal is triggered AND close existing buy position
Note:
Settings are optimised for XAUUSD on the M1 chart.
Extra:
Alerts are included.
You can toggle between EMA, WMA and SMA to your liking.
Indicator version:

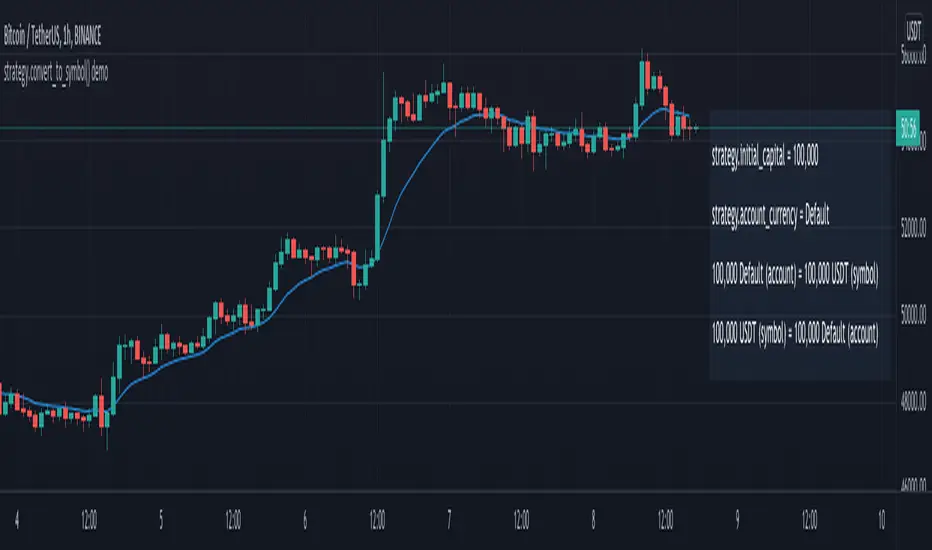
strategy.convert_to_symbol() demoA strategy demonstrating the new strategy.convert_to_symbol() and strategy.convert_to_account() functions introduced in Pine v5.
Try selecting a custom "Base Currency" under Properties to see how the conversion works.
Note: The conversion functions seem to work as expected on BTCUSD, but not on BTCUSDT. This is likely because USDT is not recognized as a currency.
AMRS_LongOnly_PartTimerThis Script is created to back-test the data starting 01/01/2000 based on AMRS strategy.
AMRS is long only strategy. It is based on unique calculation around moving averages and 2 year high price.
There are few strategies for moving average crossovers but AMRS strategy is unique compared to other moving averages strategies as it has very specific below mentioned calculations evolving around moving average and stock price.
AMRS strategy is unique one to generate buying signals when stock price creates new 2 year high and retraces back to 13 day EMA value.
AMRS strategy is unique one having specific calculation for entry signal and exit signal as mentioned below. This strategy gives back testing results to help build conviction on entry/exits if trades were taken in past as per the AMRS rules.
As per AMRS strategy this script generates green arrow on each time when new 2 year high is made and also generates long signal indicated by white arrow when stock price retraces back to 13 day EMA value and price is within 10% range from 2 year high.
This strategy will generate white arrow on the chart for each buy signal when stock price reaches 13 day EMA after first Long signal is generated. These subsequent buy signals can be used for pyramiding.
Entry Signal Logic : 1. Stock should be trading near 2 year high.
2. Stock price should be within 10% range from 2 year high
3. Stock price should be less than or equal to 13 day EMA and grater than equal to 21 day EMA
This AMRS strategy also generates exit signal for already generated buy signal (open position).
Exit signal generated when stock price closes 5% below 21 day EMA or when stock price closes below 20% from most recent 2 year high price.
Exit Signal Logic : 1. Stock price closes 5% below 21 day EMA or stock price closes below 20% from most recent 2 year high price.
2. Since exit logic is based on closing price it is plotted on the chart next day.
3. So when exit signal is plotted on the chart, previous days stock price is either closed below 5% of 21 day EMA or corrected 20% from recent 2 year high.
Note : To Calculate last entry positions % return, by default all positions are getting closed on mentioned end date.
Script parameters :
start date as 01/01/2000 - Constructed from Start Year - 2000, Start Month - 1 Start Date - 1
End date (mostly current date) Constructed from Values in End Year, End Month, End Date.
Initial Capital - Defaulted to 100000
Order Size - 5% of Equity
Pyramiding - 3 orders
Commission - 0.2%
Slippage - 1 tick (Since this strategy exit is on close basis mostly there wont be any slippages)

Williams Fractals StrategyThis indicator made with using Williams Fractals, 20 50 100 Moving Averages and Relative Strength Index. You can easily find entry points by using Long (L), Short (S) signals.
Note : Settings are optimized for BTC:USDT Perpetual 15min TF. For use different pairs or TFs you may need to change settings.

TemaVWAPRSI StrategyExchange: Kraken
Timeframe: 5m
Pair: ETH/USD
If you use this for any other exchange or pair, you'll have to tweak the settings, most importantly are the trailing stop ticks. This strategy is currently in what I would call beta mode. It uses the volume weighted average price indicator, rate of change, two triple exponential moving averages and the relative strength index to find buy and sell signals.

Moving Average Band - Taylor V1A Very Simple Strategy From Moving Average
- Price Breakout Upper Band = Long
- Price Breakout Lower Band = Short
Moving Average Type = Able to Change RMA, EMA, SMA, WMA
Moving Average Period = Able to Change
Upper Band & Lower Band Gap = Able to Change
With Stop Lose & Take Profit = Able to Change

Take Profit On Trend (by BHD_Trade_Bot)The purpose of strategy is to detect long-term uptrend and short-term downtrend so that you can easy to take profit.
The strategy also using BHD unit to detect how big you win and lose, so that you can use this strategy for all coins without worry about it have different percentage of price change.
ENTRY
The buy order is placed on assets that have long-term uptrend and short-term downtrend:
- Long-term uptrend condition: ema200 is going up (rsi200 greater than 51)
- Short-term downtrend condition: 2 last candles are down price (use candlestick for less delay)
CLOSE
The sell order is placed when take profit or stop loss:
- Take profit: price increase 1 BHD unit
- Stop loss: price decrease 2 BHD units
The strategy use $15 and trading fee is 0.1% for each order. So that, in the real-life, if you are using trade bot, it will need $1500 for trading 100 coins at the same time.
Pro tip : The 1-hour time frame for altcoin/USDT has the best results on average.

Vin's Playzone Strategy How it works
Playzone is a very simple system, utilizing just two exponential moving
averages. The 'Zones' in which different 'actions' should be taken is
highlighted with different colors on the chart. Calculations for the zones
are based on the relative position of price to the two EMA lines and the
relationship between the two EMAs
How to use
The basic method for using Playzone is to follow the green/red color.
Buy when bar closes in green.
Sell when bar closes in red.
Using it this way is safe but slow and is expected to have around 35-40%
accuracy, while yielding around 2-3 profit factors. The system works best
on larger time frames.
The more advanced method uses the zones to switch between different
trading system and biases, or in conjunction with other indicators.
example 1:
Buy when Yellow-Green and Bullish Divergence between price and RSI is visible,
if not Buy on Green and vise-versa
example 2:
Set up a long-biased grid and trade long only when actionzone is in green
change the bias to short when actionzone turns to te bearish side(red)
(Look at colors on a larger time frame)
"We let the market tell us what to do, Not to outguess what the market gonna do."

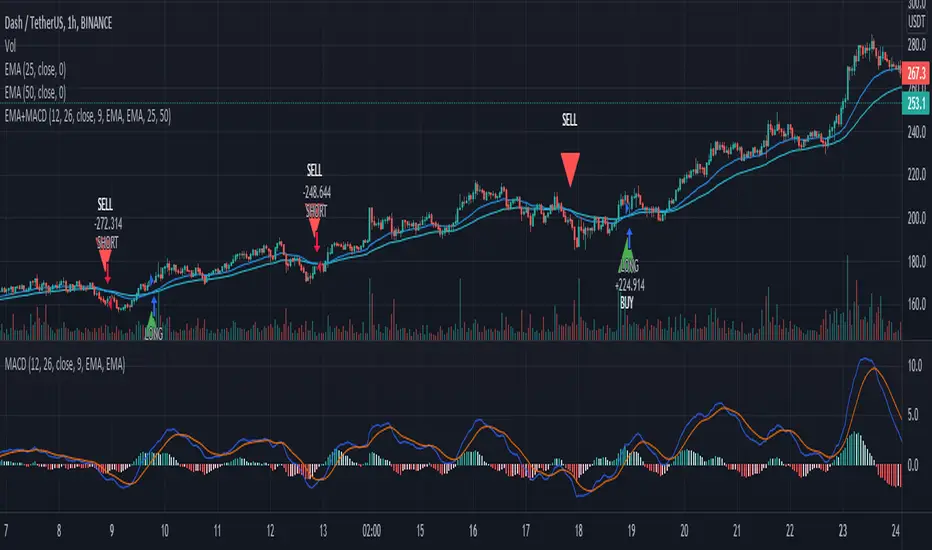
EMA+MACDA simple script using EMA 25 and EMA 50 with MACD. Enter long when EMA 25 crossover ema 50 and MACD line > 0, enter short when EMA 50 crossover ema 25 and MACD < 0
SSL Hybrid Exit Arrow StrategyBasic concept: Use the SSL Hybrid indicator's EXIT ARROWS to determine trade entry and exit points.
Rules:
Enter LONG trades on BLUE exit arrows
Enter SHORT trades on RED exit arrows
Uses up to 3 DCA orders for trade entry
Sets a stop loss
Does not set any take profit. Relies on opposing arrow to exit current position
When filters are set it affects opening of positions, but opposing arrow will always exit trades regardless of filtering options set
Additional filtering configuration:
If the SSL filter checkbox is checked, then LONG positions can only be opened when SSL1 is below the baseline lower and SHORT positions can only be opened when the SSL1 is above the baseline upper
If the QQE MOD checkbox is checked, then LONG positions can only be opened when QQE MOD histogram bars are BLUE and the QQE MOD line is ABOVE 0 and SHORT positions can only be opened when the QQE MOD histogram bars are RED and the QQE MOD line is BELOW 0
Both SSL and QQE MOD filters may be combined to give stricter filtering, however I find it often prevents entry to too many good trades

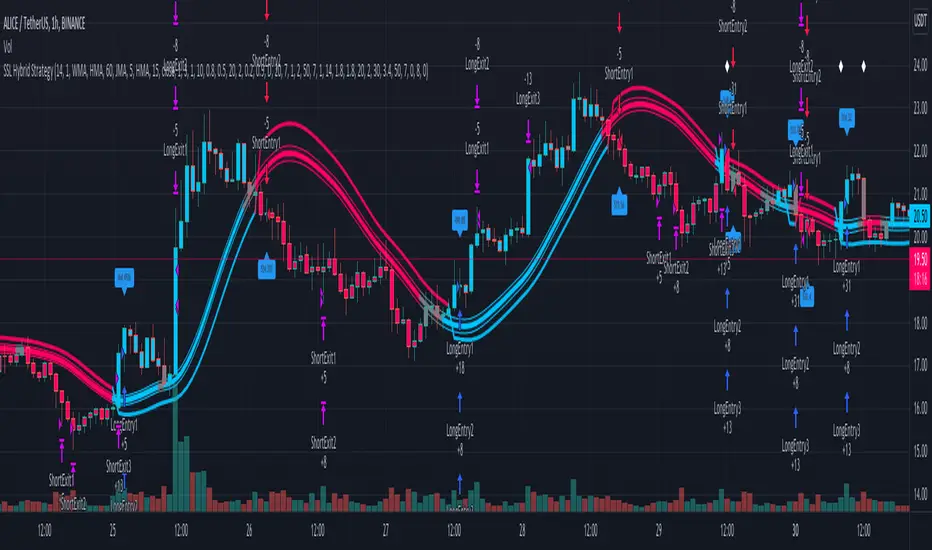
SSL Hybrid StrategyStrategy based on the SSL Hybrid indicator by Mihkel00
Designed for the purpose of back testing
Strategy:
Enters both long and short trades based on SSL1 crossing the baseline
Stop Loss calculated based on ATR multiplier
Option to allow moving of Stop Loss to break even on TP1
Option to turn off Stop Loss and Take Profit which will rely on indicator flip to exit from position
Take Profits configurable with up to 5 ATR multipliers and exits percentages (percentages calculated as percentages of original position size, eg. 100 tokens with 3 TPs of 20, 30, 50 would exit the same number of tokens on each TP)
Credits:
SSL Hybrid Mihkel00 www.tradingview.com
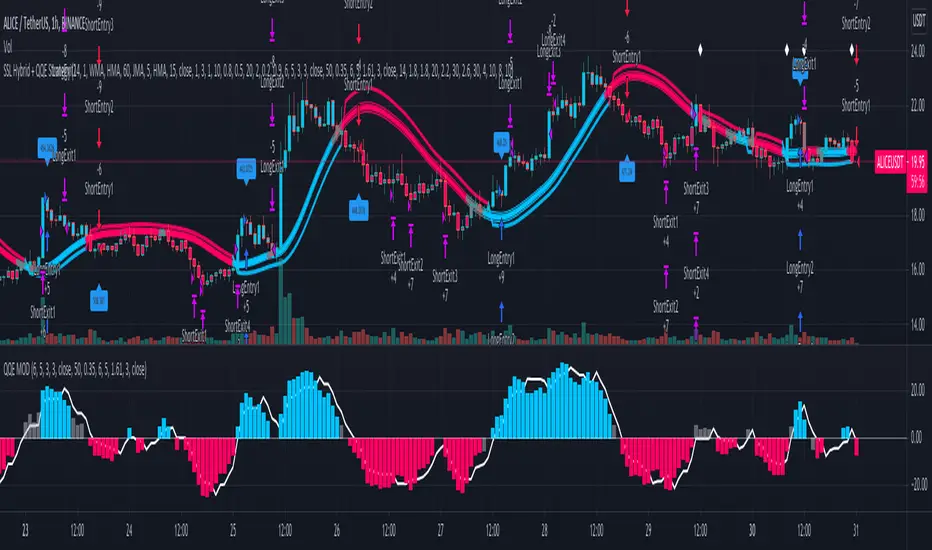
SSL Hybrid + QQE StrategySSL Hybrid strategy combining QQE MOD as trade entry filter.
Rules to enter LONG:
SSL1 is under lower baseline lower
QQE histogram bar is blue
QQE line is above 0
Rules to enter SHORT:
SSL1 is under above baseline upper
QQE histogram bar is red
QQE line is below 0
Long only EMA CROSS 8/50/200 BacktestImprove EMA CROSS 8/50/200 with adjustable Exit EMA Level, and can open trade only when above EMA200

Crypto Scalper Divergence Macd Psar Ema 200This is a very efficient crypto scalper adapted to very short timeframes, however it can be optimized for other timeframes and assests as well.
Its components are
MACD
P SAR
EMA 200
Risk management
Rules for entry:
For short : we have an uptrend on PSAR , histogram is positive (divergence MACD) and close of a candle is below EMA 200
For long : we dont have an uptrend on PSAR, histogram is negative(divergence MACD) and close of a candle is above EMA 200
Rules for exit:
We exit when we either find a reverse condition than the entry one, or based on stop loss/take profit that are calculated on % movements of the price.
If you have any questions, let me know !

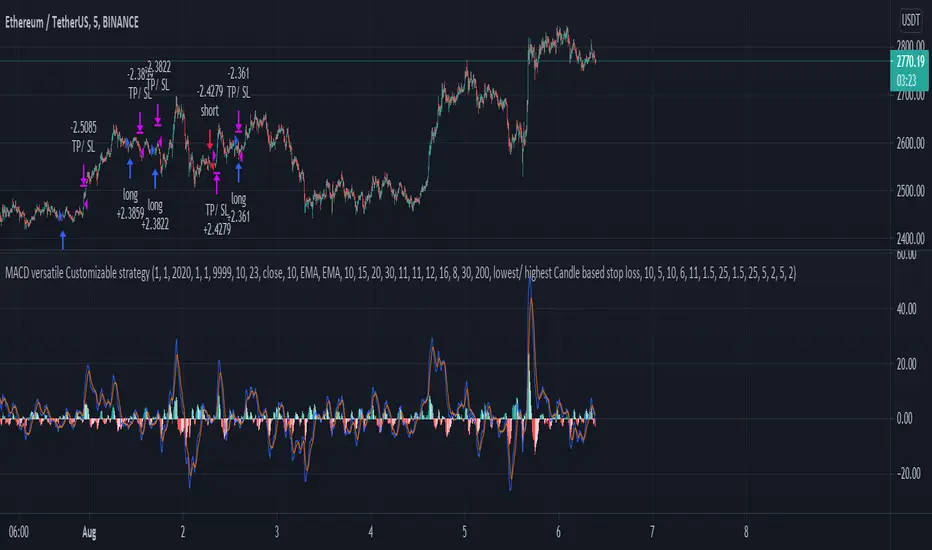
MACD, EMA, Know sure thing, Chopy Market - high adaptabilityHey there :)
This is the free version of the script. The following indicators / settings are missing:
- Support and resistance zones
- dynamic textboxes for alarms when using bots (3 Commas, Alertatron, etc.)
- a table showing the current position, indicators and other important information
With this script there is the possibility to completely customize the MACD . Starting with the MACD and signal line, the histogram and the color of the histogram.
Since the Pinecoders team has previously deleted the script, I will mention the fee settings in a bit more detail:
In this script a fee of 0.01% and a slipage of 15 was used. With each trade the total capital (100%) is used with a risk reward of 1 to 1.5.
The total capital, i.e. the risk, can be changed at any time under the "Settings" tab at "Equity".
I also added an EMA , the Know sure thing indicator and the Chopy Market indicator (by TradingRush) to the script to filter out bad trades.
The EMA:
Since the EMA is very reliable and shows whether there is an upward or downward trend, it should be used with the indicators in any case. It prevents long trades in downward movements and vice versa.
The KST Indicator:
The KST indicator has a similar movement as the MACD, but is by and large a bit more time delayed. It filters out false swings of the MACD and thus prevents bad trades.
The Chopy Market Indicator by Tradingrush:
The Chopy Market indicator, which was introduced by TradingRush in one of its videos, has the ability to detect sideways markets and block zones below this line for trades by means of a fixed value (the line).
To exit the trades, I added the following options:
ATR Exits. Exits based on past candles (lowest low, highest high).
Static exits based on set percentages.
In the next days I will create a tutorial for the script, just have a look on my profile.
If you have any questions about the script, let me know.
BTC Sentiment analysis RSI 2xEMAThis is a CRYPTO correlation strategy, which is using BTC sentiment with BITFINEX long and short ratios.
WIth them we are making from one side 2 RSI, one for long and another for short. And from another side, we are going to make multiple EMA's, using the ratios for long and short.
Rules for entry
For this scenario I created a long only strategy.
The long entry condition is : we have a crossover of the rsi long ratio with rsi short ratio and long ratio from BITFINEX is above the long EMA and short ratio from BITFINEX is below short EMA.
We exit when we get the opposite condition, in this case we have a crossunder of the rsi long ratio with rsi short ratio and long ratio from BITFINEX is below the long EMA and short ratio from BITFINEX is above short EMA.
If you have any questions, let me know !

EMA StrategyThis is a simple EMA cross strategy. This script was published by CaptJava. I added in the ability to check off a box and allow shorting, the ability to select a back testing date range and also the ability to enter the buy message and sell message in the properties. You then create the webhook alert and put only this in the message:
{{strategy.order.alert_message}}
That will pull in your alert message dynamically.
I may add more features to this over time.

EMA Bounce StrategySimple strategy that checks for price bounces over an Exponential Moving Average. If the CLOSE of the candle bounces
back from having it's LOW below the EMA then it's a Bull Bounce. If the CLOSE of the candle bounces down from having it's
high above the EMA then it's a Bear Bounce. This logic can be reversed.

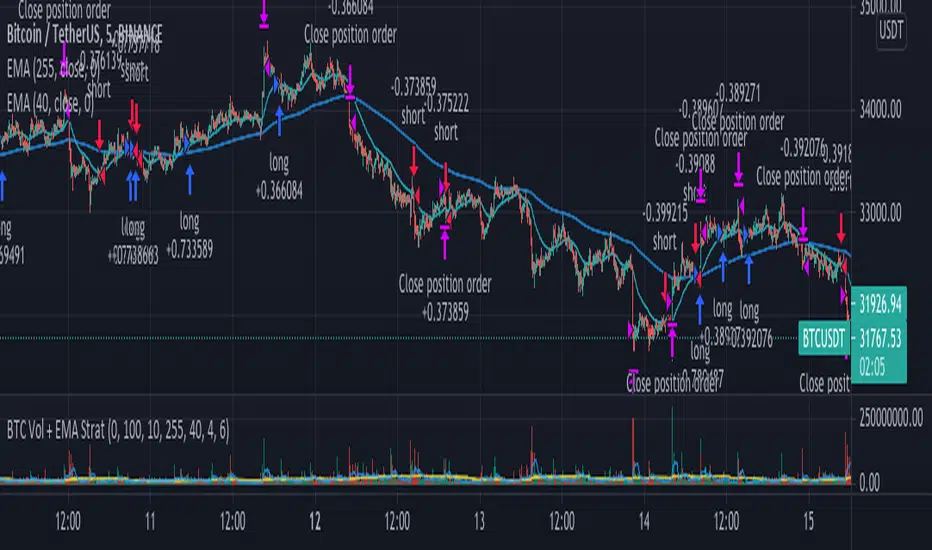
Aggregate BTC Volume + EMA Strat// This strategy buys when the price crosses the Fast EMA. It can go long only
// when the price is above the slow EMA and short when is below. The exit
// is determined by volume spikes, when the volume is greater than the Volume
// MA multiplied by the assigned input multiplier. Thanks to MartinShkreli
// for the Aggregated BTC volume. There is also a Maximum Loss filter which
// should be modified depending on the traded market.