MOH Trend Pulse
Educational overlay that highlights context zones and potential points of interest using an internal adaptive model.
No signals, no financial advice. For research only; use with proper risk management
Forecasting

JessieOBS with MACD - The Evil MACD 3.0中文版说明在后面
JessieOBS takes the classic MACD to the next level by clearly highlighting overbought and oversold zones.
While the traditional MACD works well for spotting uptrends and downtrends, it often struggles in sideways markets—producing false signals and useless crossovers that can trigger unnecessary stop losses. JessieOBS solves this problem, giving you cleaner, more reliable signals even when the market is moving sideways.
The thick red line signals an oversold area, hinting that a price reversal to an uptrend may happen soon.
The thick blue line signals an overbought area, hinting that a price reversal to a downtrend may happen soon.
JessieOBS helps you filter sideways trends, improving your win rate.
WARNING: JessieOBS is only an early WARNING, NOT A TRADE ENTRY SIGNAL.
When a warning appears, stay alert and wait for confirmation—through price action, divergences , or the theory of entanglement.
With the right approach, JessieOBS can take your win rate to the next level!
JessieOBS 3.0 – Update Highlights
New Feature: Automatic Divergence Detection
To enhance the effectiveness of JessieOBS, version 3.0 introduces automatic divergence marking. Using divergence alongside JessieOBS can improve win rates and help pinpoint potential reversal points more accurately.
1. Focused on MACD Histogram Divergence
Only the MACD histogram is used for divergence detection; the MACD divergences are not marked. This is because JessieOBS is a leading indicator, and the MACD lines and histogram convey different information:
MACD Line: Represents the overall trend and changes more gradually.
MACD Histogram: Reflects direction and momentum, changing more quickly.
Since JessieOBS is designed for early warning signals, observing divergence on the histogram allows for more precise detection of potential reversals.
2. How JessieOBS Divergence Differs from Other Indicators
Most divergence indicators on the market rely on future functions to repaint signals. This is necessary because a peak or trough can only be confirmed after it has formed. As a result, these indicators often repaint continuously until the last signal is fixed.
In JessieOBS, key divergence lines are preserved, allowing you to clearly track how signals evolved in real time, rather than retrospectively identifying tops or bottoms after the fact.
3. Usage Notes
Divergence lines may repaint and should be used as reference and alerts only. Rest assured, the core JessieOBS signals do not repaint or shift—they remain stable and reliable.
4. Interpreting Divergence Strength
Stronger Divergence: Larger price differences between two points create steeper divergence lines, indicating a more significant signal.
Weaker Divergence: Smaller price differences produce flatter lines, suggesting a milder and less impactful signal.
中文版说明:
传统的MACD可以很明确识别出趋势,但有两个最大的缺点:第一是滞后性,第二是假信号。所以MACD在趋势行情里比较好用(不管是上升趋势还是下降趋势),但在横盘期间,就会产生很多的假信号。
JessieOBS就解决了MACD不准的问题,在MACD的信号线上,添加了白色和蓝色的粗线,红色粗线代表价格超卖,接下来很可能会反转上涨,蓝色粗线代表价格超买,接下来很可能会反转下跌。市场横盘期间,JessieOBS很少会给出超买或者超卖信号,从而有效过滤了MACD的假信号。
注意!JessieOBS只能作为一个提前的预警,一定不能把JessieOBS当做入场信号看待。因为JessieOBS只预警价格可能会反转,但并不能预测出价格发生反转的准确时间。
正确的做法是,一旦看见JessieOBS的预警信号,就应该重点关注,再用其他的方式找到准确的入场点。裸k交易法是有用的,找到反转的趋势k线作为入场点。
强烈推荐:出现预警信号之后根据背离点入场,这种方法的胜率不错。
强烈推荐:出现预警信号之后根据缠论分析入场,利用缠论分析出的入场点胜率可以更高。
JessieOBS 3.0 更新说明
新加入功能:背离自动标注
在使用JessieOBS的过程中,结合背离会提高胜率,以及更精准找到反转点,所以在指标中加入了自动标注背离的功能。
1 没有标注MACD线的背离,只计算了MACD histogram部分背离,因为JessieOBS是一个左侧指标,但MACD线和柱状图代表的含义不同:
fastMA = f_calcMA(Source, Period, Type)
slowMA=f_calcMA(Source, Period, Type)
macdLine = fastMA - slowMA
signalLine=f_calcMA(macdLine,Period,Type)
macdHist = macdLine - signalLine
MACD线代表趋势,变化更慢,MACD histogram代表方向和力度,变化更快。
JessieOBS本身就是一个左侧指标,属于提前预警,那就应该观察柱状图的背离,这样才能更精确。
2 和市场上常见背离指标的区别:
其他背离指标,一般会用一个未来函数重绘图形,注意,涉及到背离的判断一定会用到未来函数,因为一个顶只有走出来了,你才能判断这是一个顶,否则就还有可能继续往上延伸,因为这一点逻辑本身的原因,所以背离一定会用到未来函数。
其他指标在连续背离发生的时候,一般都会不断重绘图形,直到保留最后一个信号的位置。
我在写背离的过程中,保留了一些主要的线段,这样就可以更清晰看见当时的演变过程,而不是站在事后的上帝视角回头去找一个确定的底或顶。
3 使用过程中,背离线因为有重绘的功能,所以只能用于参考和提醒,JessieOBS的信号仍然没有重绘和漂移,请放心使用。
4 背离的程度判定:两点价差越大,背离线的斜率越大,就可以判断背离越明显,这个背离的指导意义就越大;相反,两点价差越小,背离线的斜率越小,就可以判断背离越轻微,这个背离的指导意义就越小。

CA Trading BUY/SELL with TPThis indicator combines trend confirmation, pivot structure, and Take-Profit targets to give traders structured BUY and SELL signals with dynamic profit-taking options.
Key Features
- BUY & SELL Signals
- Generated from EMA crossover, RSI filter, and pivot-based trend detection.
- Green “BUY” and red “SELL” signals are displayed directly on the chart.
- Take-Profit Targets
- TP lines automatically end when price hits them (liquidity sweep) or after a set number of candles.
Customizable Settings
- EMA lengths, RSI settings, pivot sensitivity, and TP line length.
- Adjust Take-Profit targets
Use Cases
- Helps identify clear entry signals with structured TP levels.
- Supports profit-taking strategies.
- Highlights liquidity grabs for Smart Money Concept (SMC) traders.

HAZ_10FSuper Trends Bot 10Frams .
A custom indicator that displays enhanced candles with a dynamic signal line and ATR-based alerts.
It highlights market direction using color-coded bars and provides clear buy/sell signals for entries and exits.
Designed for traders who want quick signals and smoother price action with reduced market noise.

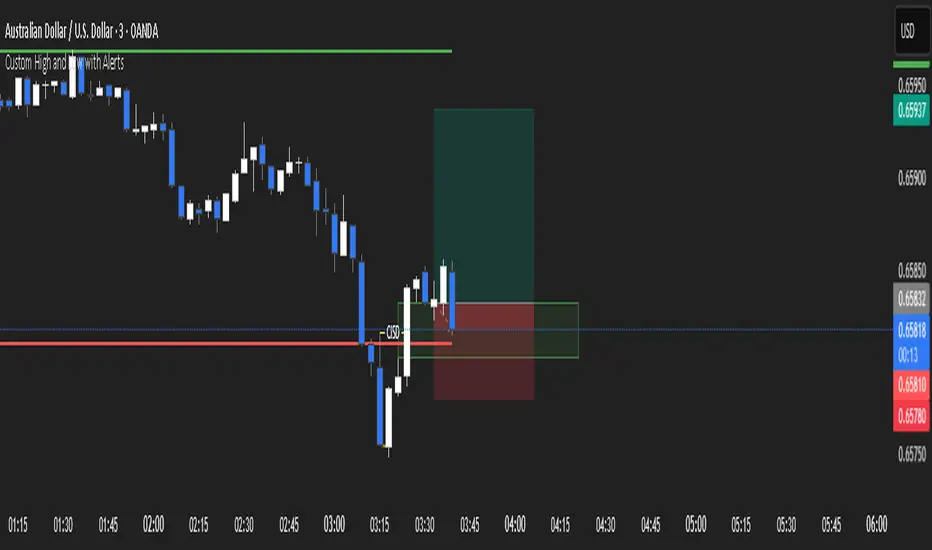
Custom High and Low (W,D,4,1)Custom High and Low (W,D,4,1)
can choose Weekly Daily 4h 1hr Previous High and Low.
地狱5分钟One-Sentence Summary
A 5-minute overlay indicator that fires confirmed buy / sell arrows when
( custom momentum-exhaustion counter OR adaptive cRSI extreme OR StochRSI extreme )
passes a user-defined sensitivity filter and a minimum-bar-distance gate, then auto-audits each signal in real time.
The Three Engines (TD-Free Wording)
A. Adaptive cRSI
Dominant-cycle RSI with auto-generated dynamic upper/lower bands.
Period, vibration and “levelling” are all adjustable.
B. StochRSI
Classic stochastic of RSI with independent length & smoothing controls.
C. Momentum-Exhaustion Counter
Counts consecutive bars where close is consistently higher (or lower) than the close 4 bars ago.
When the count reaches a user-set threshold (default 9) an “exhaustion” flag is raised.
Signal Workflow
Each engine contributes 0 or 1 point to a bull or bear score.
A raw signal candidate appears when total score ≥ 3 × sensitivity.
After the bar closes and the minimum-signal-distance test is passed, the candidate becomes confirmed.
Entry price, bar index, China-time timestamp, score and exhaustion status are logged.
Real-Time Back-Test
Every confirmed signal is stored in a SignalData array.
After backtest_minutes (user-defined) the script checks if price has moved in the signal’s favour and marks the trade win/loss.
Win-rate, streaks, exhaustion-edge and flat-money P&L (fixed bet & payout) are updated instantly.
Results are aggregated by China calendar day (UTC+8) in a DailyStats array.
Visual Output
Shapes
– Green ▲ = normal long Lime ▲ = exhaustion long
– Red ▼ = normal short Orange ▼ = exhaustion short
Price labels show exact entry.
“B” / “S” characters mark exhaustion bars.
Two live tables display overall stats, exhaustion edge, longest streaks, strategy profit and today’s China-time P&L.
Alert Library (TD-Free)
Alerts fire on:
every confirmed signal (exhaustion vs normal)
exhaustion win-rate ≥ 70 %
overall win-rate ≥ 65 %
win/loss streak milestones
daily profit/loss thresholds
Input Groups
cRSI, StochRSI, exhaustion-counter parameters
Signal sensitivity & minimum distance
OB/OS thresholds for both RSIs
Back-test duration, bet size, payout ratio
Toggle for on-chart tables

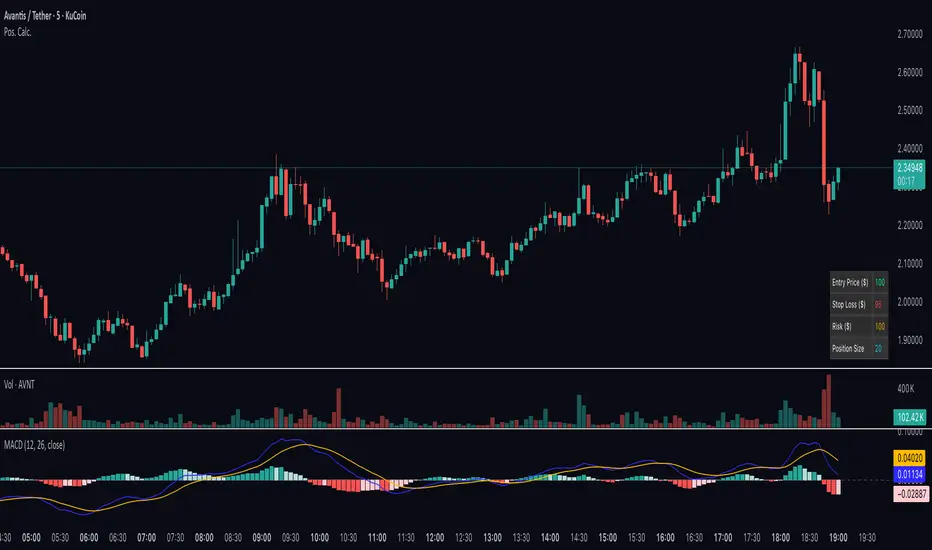
Position Size CalculatorDESCRIPTION:
This indicator is essentially a calculator that prompts the user to enter 3 variables upon activation: Entry Price, Stop Loss Price, and Risk Amount ($). From those variables, the calculator will then output what the ideal amount of shares that should be purchased to meet your risk amount limit.
SAMPLE USE CASES:
1) Trading Futures: Upon calculating the amount of shares to purchase to enter a position, you can multiply that amount by the current share price, this will give you an idea on whether or not you require some leverage to get into your position.
2) Spot Trading / Simple Stock Trading: Upon entering the required information, you will know how many shares to purchase to meet your risk amount limit.
Day Filter (Trend or Chop)Calculates multitude of things, (atr, vix, opening range, ETH, and gap) to help determine if RTH will be trend based/mixed/or choppy.
Trend <35
Mixed 35-65
Choppy >65

Shashwat Khurana (v6) – VWAP ±1SD + RSI + ATR Filter A multi-factor volatility-adjusted mean-reversion model integrating dynamic liquidity thresholds and higher-order momentum filters for asymmetric risk calibration

Friday/Monday & Wednesday/Thursday Pattern DashboardMade this indicator off the below.
If the high during the FRIDAY is not as high as the high on THURSDAY, then the odds are overwhelmingly high that whatever low you made on FRIDAY will be visited on MONDAY during the REGULAR TRADING SESSION.
Also, if Wednesday's high is lower than Monday's high, then you will see the lows of Wednesday being visited on Thursday.

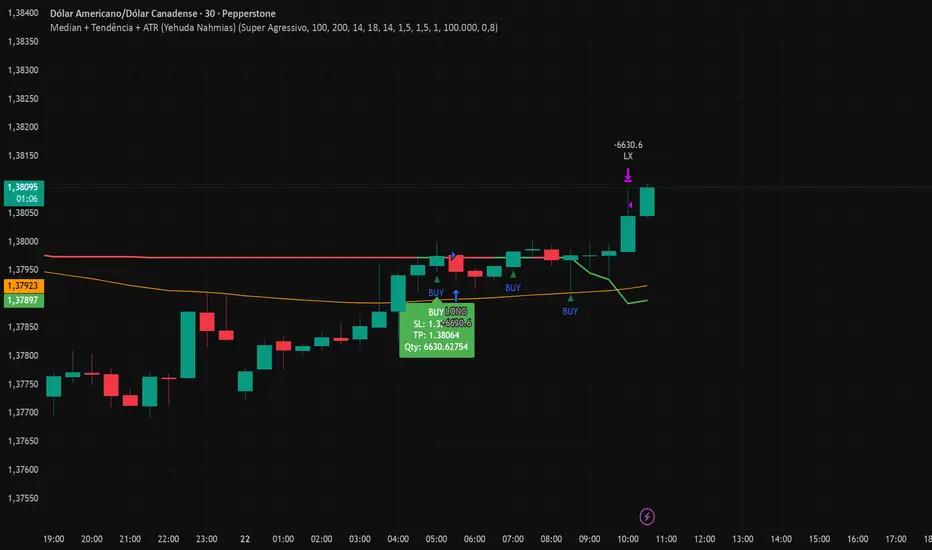
Median + Tendência + ATR (Yehuda Nahmias)📊 Median + Trend + ATR (By Yehuda Nahmias)
🚀 The indicator that combines Simplicity, Accuracy, and Risk Management
This script brings together three key pillars of professional trading:
✅ Dynamic Median → captures price midpoints and highlights reversal and breakout zones.
✅ Trend Filter (EMA) → ensures signals are aligned with the main market direction.
✅ Smart ADX + ATR → confirm trend strength and automatically calculate Stop Loss and Take Profit based on volatility.
🔔 How it works:
Buy/Sell Arrows: automatically appear when price crosses the median under valid trend and strength conditions (ADX).
Automatic Stops and Targets: SL and TP levels are plotted using ATR, ready for effective risk management.
3 Signal Modes:
🛡️ Conservative → fewer trades, stronger filtering.
⚖️ Standard → balance between frequency and accuracy.
⚡ Aggressive → more trades, captures shorter moves.
💡 Key Benefits:
Clear visuals: colored candles + BUY/SELL arrows.
Built-in risk management: position size is calculated based on % of equity.
Flexible: works on any asset (Forex, Crypto, Indices, Stocks).
🔑 Private access only.
If you’d like to use this strategy on your charts, contact me via my TradingView profile.
👉 Turn your analysis into objective signals and gain more confidence in your entries and exits!
$ - HTF Sweeps & PO3HTF Sweeps & PO3 Indicator
The HTF Sweeps & PO3 indicator is a powerful tool designed for traders to visualise higher timeframe (HTF) candles, identify liquidity sweeps, and track key price levels on a lower timeframe (LTF) chart. Built for TradingView using Pine Script v6, it overlays HTF candle data and highlights significant price movements, such as sweeps of previous highs or lows, to help traders identify potential liquidity sweep and reversal points. The indicator is highly customisable, offering a range of visual and alert options to suit various trading strategies.
Features
Higher Timeframe (HTF) Candle Visualisation:
- Displays up to three user-defined HTF candles (e.g., 15m, 1H, 4H) overlaid on the LTF chart.
- Customisable candle appearance with adjustable size (Tiny to Huge), offset, spacing, and colours for bullish/bearish candles and wicks.
- Option to show timeframe labels above or below HTF candles with configurable size and position.
Liquidity Sweep Detection:
- Identifies bullish and bearish sweeps when price moves beyond the high or low of a previous HTF candle and meets specific conditions.
- Displays sweeps on both LTF and HTF with customisable line styles (Solid, Dashed, Dotted), widths, and colours.
- Option to show only the most recent sweep per candle to reduce chart clutter.
Invalidated Sweep Tracking:
- Detects and visualises invalidated sweeps (when price moves past a sweep level in the opposite direction).
- Configurable display for invalidated sweeps on LTF and HTF with distinct line styles and colours.
Previous High/Low Lines:
- Plots horizontal lines at the high and low of the previous HTF candle, extending on both LTF and HTF.
- Customisable line style, width, and color for easy identification of key levels.
- Real-Time Sweep Detection:
-Optional real-time sweep visualisation for active candles, enabling traders to monitor developing price action.
Alert System:
- Triggers alerts for sweep formation (when a new sweep is detected).
- Triggers alerts for sweep invalidation (when a sweep is no longer valid).
- Alerts include details such as timeframe, ticker, and price level for precise notifications.
Performance Optimisation:
- Efficiently manages resources with configurable limits for lines, labels, boxes, and bars (up to 500 each).
- Cleans up outdated visual elements to maintain chart clarity.
Flexible Configuration:
- Supports multiple timeframes for HTF candles with user-defined settings for visibility and number of candles displayed (1–60).
- Toggle visibility for HTF candles, sweeps, invalidated sweeps, and high/low lines independently for LTF and HTF.
This indicator is ideal for traders focusing on liquidity hunting, order block analysis, or price action strategies, providing clear visual cues and alerts to enhance decision-making.

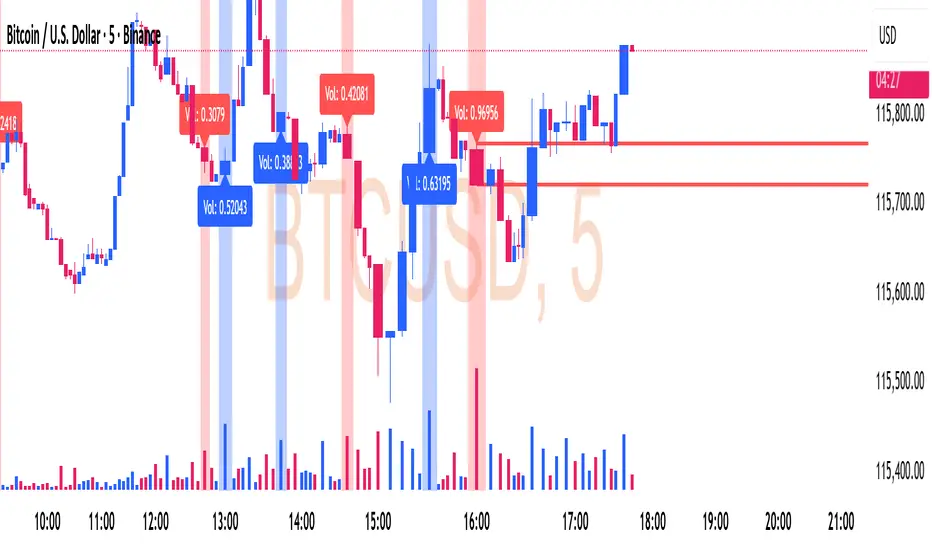
Ultra High Volume Candles with Lines📊 Ultra High Volume (UHV) – Smart Money Alert 🚨
🔎 What is Ultra High Volume?
Ultra High Volume happens when a candle’s trading volume is much higher than the average volume of the last few bars.
👉 Example: If the average volume is 100k and suddenly a candle shows 300k → that’s Ultra High Volume.
It means big players (institutions, banks, funds) are active in that candle.
This is important because price moves strongly when big money participates.
🟥 Ultra High Volume Red Candle
When UHV appears on a red (bearish) candle:
🚩 It shows strong selling pressure.
📉 Can be a distribution phase (smart money unloading positions).
🛑 Often appears at resistance zones → possible trend reversal.
🎯 Sometimes it’s a stop-loss hunt before a reversal (fake push down).
🟦 Ultra High Volume Blue/Green Candle
When UHV appears on a blue/green (bullish) candle:
🚀 It shows strong buying pressure.
📈 Can be accumulation (smart money loading positions).
💥 Appears at breakout levels → signals continuation of the trend.
🛡️ Absorbs sellers before a big upward move.
⚖️ Why UHV is Important
UHV shows where smart money is active.
It tells us the market is at a decision point.
BUT ⚠️ → UHV doesn’t guarantee direction.
Always combine with:
✅ Market structure (higher highs, higher lows, CHoCH, BOS)
✅ Support & Resistance
✅ Order blocks and liquidity zones
📌 Example of Reading UHV
🔺 UHV at support → possible bounce (accumulation).
🔻 UHV at resistance → possible rejection (distribution).
💥 UHV during a breakout → confirms continuation.
❓ UHV in the middle of nowhere → usually a trap → avoid trading blindly.
💡 Key Takeaway
Volume = Fuel. Price moves with volume.
Ultra High Volume = Institutional footprint.
When you see it:
Don’t ignore 🚨
Look at the context (trend, structure, key zones)
Trade in sync with the big players
✨ UHV is not just a candle – it’s the market shouting at you: "Pay Attention!"
SETTINGS : Better result 4x volume candles
Weekly GridWeekly Grid Indicator
What It Does
Weekly Grid tracks Sunday 4:00 PM to Monday 4:00 PM (UTC-7) price ranges and plots high/low horizontal lines with vertical period markers. Helps identify weekly support/resistance levels.
Key Features
Period: Sun 4PM - Mon 4PM (UTC-7)
Lines: 2px thick high/low levels with price labels
Verticals: Green lines marking period boundaries
Alerts: Price breaks above high/below low
Lookback: Adjustable historical periods (default 1000 bars)
Trading Applications
Breakouts: Trade breaks of weekly high/low
Range: Fade approaches to extreme levels
Support/Resistance: Use as key weekly pivots
Alerts: Get notified of level breaks
Best For
Day traders seeking weekly structure
Swing traders using weekly pivots
Anyone wanting Sunday-Monday momentum levels
Simple weekly levels. Clear trading signals.
Copy the Pine Script code, add to TradingView, and start trading the levels.

GT PancakeSwap Fair Value Model v1This is not financial advice...is just for educational purposes.
This indicator estimate the Fair Value Price of PancakeSwap token CAKE utilizing different proprietary formulas that i develop, it consider a fair value when the price is within +10% to -10% of target price.
You can apply this indicator to any CAKE/"Stable Pair" in daily timeframe or lower for more precise results.
Hope it helps you and If you have any feedback, please leave in the comments section, thanks.

Super SignalWhen all lines are below the 20 line its a super signal to buy. When all trends are above the 80 line it is a super signal to sell.

MOHStrategy Description
Uses Heikin Ashi candles to filter market noise and identify trend direction.
Entry is allowed only when strong HA candles appear (bullish without lower wick, bearish without upper wick).
Doji candles signal possible reversal.
استخدام شموع Heikin Ashi لتقليل الضوضاء وتحديد اتجاه الترند.
الدخول فقط عند ظهور شموع قوية (صاعدة بدون ذيل سفلي، هابطة بدون ذيل علوي).
شمعة الدوجي = إشارة انعكاس محتملة.

EyeOn VolatilityEyeOn Volatility tracks how market volatility affects trading spreads. It adapts dynamically using recent price fluctuations and shows symmetric bid/ask bands around the chart. A live info box displays the current spread in percent, and an optional panel lets you review spread history over time.

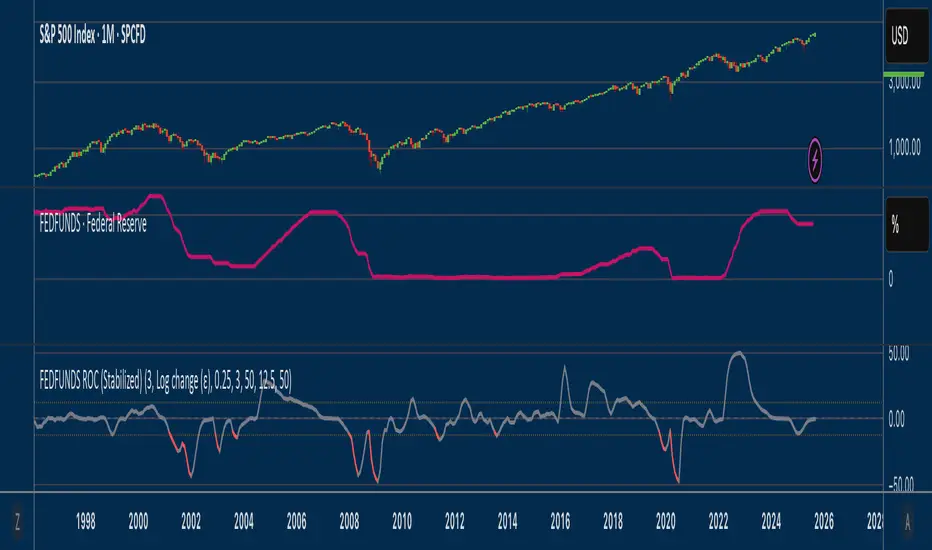
Fed Funds Rate-of-ChangeFed Funds Rate-of-Change
What it does:
This indicator pulls the Effective Federal Funds Rate (FRED:FEDFUNDS, monthly) and measures how quickly it’s changing over a user-defined lookback. It offers stabilized change metrics that avoid the “near-zero blow-up” you see with naive % ROC. The plot turns red only when the signal is below the lower threshold and heading down (i.e., value < –threshold and slope < 0).
This indicator is meant to be useful in monitoring fast cuts on the part of the FED - a signal that has preceded recession or market pullbacks in times prior.
Change modes: Percentage, log and delta.
Percent ROC (ε floor): 100 * (now - prev) / max(prev, ε)
Log change (ε): 100 * (ln(now + ε) - ln(prev + ε))
Delta (bps): (now - prev) * 100 (basis points; avoids percentage math)
Tip: For “least drama,” use Delta (bps). For relative change without explosions near zero, use Log change (ε).
Key inputs:
Lookback (months): ROC window in calendar months (because source is monthly).
Change Metric: one of the three options above.
ε (percentage points): small constant (e.g., 0.25 pp) used by Percent ROC (ε) and Log change (ε) to stabilize near-zero values.
EMA Smoothing length: light smoothing of the computed series.
Clip |value| at: optional hard cap to tame outliers (0 = off).
Threshold % / Threshold bps: lower/upper threshold band; unit adapts to the selected metric.
Plot as histogram: optional histogram view.
Coloring / signal logic
Red: value is below the lower threshold (–threshold) and the series is falling on the current bar.
How to use:
Add to any chart (timeframe doesn’t matter; data is monthly under the hood).
Pick a Change Metric and set Lookback (e.g., 3–6 months).
Choose a reasonable threshold:
Percent/Log: try 10–20%
Delta (bps): try 50–100 bps
Optionally smooth (EMA 3–6) and/or clip extreme spikes.
Interpretation
Sustained red often marks periods of accelerating downside in the Fed Funds change metric (e.g., policy easing momentum when using bps).
Neutral (gray) provides context without implying direction bias.
Notes & limitations
Source is monthly FRED series; values update on monthly closes and are stable (no intrabar repainting of the monthly series).
Threshold units switch automatically with the metric (%, %, or bps).
Smoothing/clip are convenience tools; adjust conservatively to avoid masking important shifts.
Mongoose Global Conflict Risk Index v1Overview
The Mongoose Global Conflict Risk Index v1 is a multi-asset composite indicator designed to track the early pricing of geopolitical stress and potential conflict risk across global markets. By combining signals from safe havens, volatility indices, energy markets, and emerging market equities, the index provides a normalized 0–10 score with clear bias classifications (Neutral, Caution, Elevated, High, Shock).
This tool is not predictive of headlines but captures when markets are clustering around conflict-sensitive assets before events are widely recognized.
Methodology
The indicator calculates rolling rate-of-change z-scores for eight conflict-sensitive assets:
Gold (XAUUSD) – classic safe haven
US Dollar Index (DXY) – global reserve currency flows
VIX (Equity Volatility) – S&P 500 implied volatility
OVX (Crude Oil Volatility Index) – energy stress gauge
Crude Oil (CL1!) – WTI front contract
Natural Gas (NG1!) – energy security proxy, especially Europe
EEM (Emerging Markets ETF) – global risk capital flight
FXI (China ETF) – Asia/China proxy risk
Rules:
Safe havens and vol indices trigger when z-score > threshold.
Energy triggers when z-score > threshold.
Risk assets trigger when z-score < –threshold.
Each trigger is assigned a weight, summed, normalized, and scaled 0–10.
Bias classification:
0–2: Neutral
2–4: Caution
4–6: Elevated
6–8: High
8–10: Conflict Risk-On
How to Use
Timeframes:
Daily (1D) for strategic signals and early warnings.
4H for event shocks (missiles, sanctions, sudden escalations).
Weekly (1W) for sustained trends and macro build-ups.
What to Look For:
A single trigger (for example, Gold ON) may be noise.
A cluster of 2–3 triggers across Gold, USD, VIX, and Energy often marks early stress pricing.
Elevated readings (>4) = caution; High (>6) = rotation into havens; Shock (>8) = market conviction of conflict risk.
Practical Application:
Monitor as a heatmap of global stress.
Combine with fundamental or headline tracking.
Use alert conditions at ≥4, ≥6, ≥8 for systematic monitoring.
Notes
This indicator is for informational and educational purposes only.
It is not financial advice and should be used in conjunction with other analysis methods.

Buy and Sell Signals (Altius Consulting)Generates Buy and Sell signals based on MACD and RSI.
- Plots MACD, Signal & Histogram (optional pane).
- Buy Label (toggle): Bullish MACD crossover + RSI < threshold (no convergence requirement).
- Sell Label: Bearish MACD crossover (MACD crosses below Signal) prints a SELL tag.
- Alert: Provided for convergence-based buy condition (add your own for simple crossover if desired).

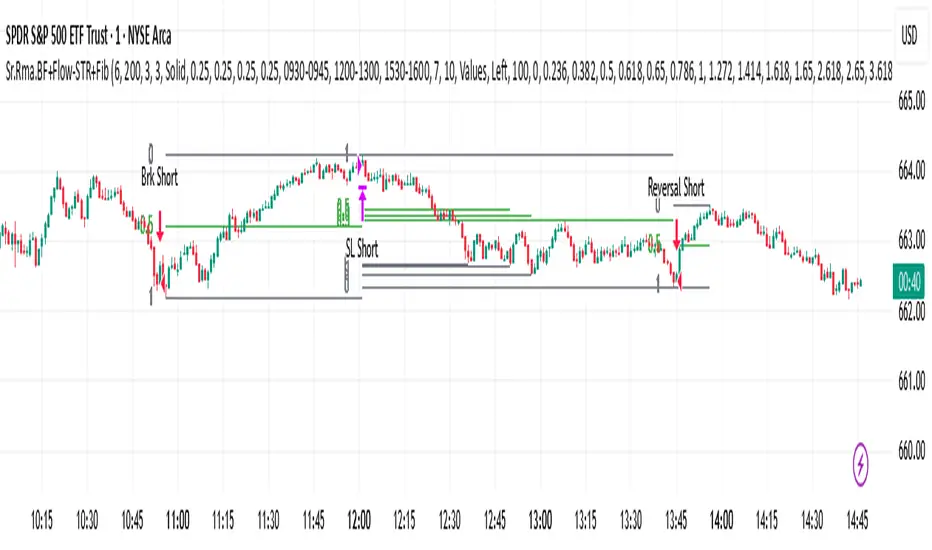
Sr.Rma.Breakout.Fib (Merged)DO YOUR DUE DILIGENCE – THIS IS FOR EDUCATIONAL PURPOSE AND NOT A TRADE ADVICE-
This strategy is designed for traders who want to merge pattern recognition (breakouts) with market structure context (Fibonacci), while maintaining disciplined trade management through automated stop-loss and reversal logic. “Once the chart is added, please ensure the candle pattern is set to Heikin Ashi.”
1. Breakout Finder Logic
The breakout finder identifies bullish and bearish breakouts using pivots, thresholds, and test counts:
• Pivot Highs & Lows (PH/PL): Calculated using user-defined periods.
• Breakout Threshold: Dynamic channel width based on recent volatility.
• Confirmation: A breakout is validated when price action clears the breakout Conditions
• Bullish Breakout: Triggered when multiple pivot highs are cleared by bullish Conditions.
• Bearish Breakout: Triggered when multiple pivot lows are broken by bearish Conditions.
• Sessions ignored: Traders can exclude up to three custom time windows to prevent signals during low-quality periods.
Risk & Reversal Controls
• Stop-Loss: Adjustable % thresholds for both long and short trades.
• Reversal Entries: Optional signals that trigger after a stop-loss, capturing potential price reversals.
2. Strategy Order Management
The strategy executes entries and exits based on confirmed breakout and reversal signals:
• Entries:
o Long on confirmed bullish breakout.
o Short on confirmed bearish breakout.
• Stops:
o Automatic closure of open positions when stop-loss conditions are hit.
• Reversals:
o Transition directly from long to short or vice versa when reversal conditions are met.
3. Auto Fibonacci Retracement
A ZigZag-based system automatically plots Fibonacci retracement levels on the chart:
• Swing Context: Derived dynamically from pivots with adjustable depth and deviation settings.
• Fib Levels: Standard retracement and extension levels (0.236, 0.382, 0.5, 0.618, 0.786, 1.0, 1.618, 2.618, 3.618, 4.236, etc.) are supported.
• Custom Options:
o Extend lines left or right.
o Show/hide level prices and percentage values.
o Control label positions (left or right).
o Adjustable transparency for background fills between levels.
• Crossing Alerts: Alerts are fired when the price crosses specific Fibonacci levels, enhancing confluence with breakout signals.
5. Key Benefits
• Comprehensive Trading Framework: Combines breakout confirmation, risk management, and Fibonacci context.
• Visual Clarity: Automatic plotting of breakout structures and Fib levels makes the chart intuitive.
• Flexible Controls: Full customization of pivots, thresholds, sessions, stop-loss %, and Fib settings.
• Automation Ready: Alerts and strategy orders allow seamless integration with brokers or external systems.
Alert: 10m FU at Top of HourWhen an FU happens on the hour, it will typically give a good indication of direction
Pair this with negation and HCS
