Buy on Blue, Sell on Red (EMA + optional RSI) TyusEThis indicator is a trend-following system that helps traders identify potential buy and sell opportunities using a combination of EMA crossovers and an optional RSI filter for confirmation.
It plots:
🔵 Blue dots (BUY signals) when the fast EMA crosses above the slow EMA — signaling bullish momentum.
🔴 Red dots (SELL signals) when the fast EMA crosses below the slow EMA — signaling bearish momentum.
You can optionally filter these signals using the RSI (Relative Strength Index) to avoid false breakouts — for example, only taking BUY signals when RSI is above 55 (showing strength) and SELL signals when RSI is below 45 (showing weakness).
⚙️ Features
Adjustable Fast EMA and Slow EMA lengths
Optional RSI confirmation filter
Customizable RSI thresholds for entries
“Confirm on bar close” setting to reduce repainting
Built-in alert conditions for real-time notifications
💡 How to Use
Use blue dots as potential long entries and red dots as potential short entries.
Confirm direction with overall trend, structure, or higher timeframe alignment.
Combine with support/resistance, volume, or price action for best results.
⚠️ Note
This is a technical tool, not financial advice. Always backtest and use proper risk management before trading live markets.
T.E
Forextrading

KILLZONE & CHECK LIST ICAKILLZONE & CHECK LIST ICA | The Inner Circle Alchemist
✨ Features:
Display of precise trading killzones on the chart
Marking the high, low, and mid-level of each killzone
Option to show/hide killzone names
Daily separators at custom times (e.g. 17:00 or 00:00)
Highlighting Midnight Open, 8:30 Open, and New York Stock Exchange Open
Display of previous day, week, and month highs & lows (optional)
A clean and practical trading checklist on the bottom-right of the chart
Visual customization, such as showing your name/brand on the chart
Clear indication of weekdays
⚡️ A perfect mix of professional tools & visual style to keep you one step ahead!
ID on All Platforms: TheInnerCircleAlchemist
#Forex #Trading #Indicator #Killzone #TradingChecklist #PriceAction #DayTrading #SwingTrading #SmartMoney #MarketStructure #TradingTools #ChartAnalysis #TechnicalAnalysis #ForexStrategy #TraderLife #ForexTrading

XAUMO MEGABAR Detector]XAUMO MegaBar Detector – Breakout Candle Identification Tool
Purpose:
The XAUMO MegaBar Detector is built to highlight rare, high-impact candles where strong price movement and high trading volume occur together. These moments often reflect aggressive market activity and can be used to confirm potential breakouts or reversals.
How It Works (High-Level Overview)
The tool continuously monitors two primary conditions:
Price Expansion – Identifies large-bodied candles compared to recent averages.
Volume Expansion – Confirms that the move is supported by above-average trading activity.
When both conditions are present, the candle is marked:
🟢 Mega Bull – Strong bullish pressure.
🔴 Mega Bear – Strong bearish pressure.
Key Features
Automatic Timeframe Adjustment – Detection sensitivity changes based on chart timeframe, so results stay relevant from 1-minute scalps to multi-day swing setups.
Clear Visual Output – Significant candles are highlighted directly on the chart for easy recognition.
Optional Labels – Toggle on/off text labels (“Mega Bull” / “Mega Bear”) for a cleaner chart view.
Alert Integration – Set TradingView alerts to be notified immediately when a qualifying candle appears.
Universal Compatibility – Works on Forex, Commodities, Indices, Crypto, Stocks, ETFs, and Futures.
Practical Uses for Traders
As a confirmation tool when price approaches support/resistance or Fibonacci levels.
To filter low-quality setups by focusing only on moments where both price and volume confirm the move.
As part of a trend-following or breakout strategy when combined with other analysis methods.
Using the Indicator
Add the indicator to any chart and select your preferred timeframe.
Watch for highlighted candles – they indicate significant combined momentum and liquidity.
Use as a signal filter or confirmation alongside your existing trading system.
Optional: Set alerts to receive push/email/webhook notifications.
===================================
📌 MEGA BAR TRADING CHEAT SHEET
Spot Big Money. Ride the Move.
===================================
🧠 WHAT’S A MEGA BAR?
A Mega Bar is a candle so big it makes the rest look tiny — and it often means institutions are making a move.
Check the 4 Rules:
✅ Body size ≥ 2x average
✅ High relative volume (vs. last 20 bars)
✅ Closes near high (bull) or low (bear)
✅ Comes after sideways chop or price squeeze
📈 WHY IT MATTERS
Mega Bars = intent, not random spikes.
🟢 Mega Bull near support/Fib pullback → Likely accumulation
🔴 Mega Bear near resistance/Fib extension → Likely distribution or trap
🔧 HOW TO TRADE IT
1. WAIT FOR IT
No Mega Bar → No trade.
Mega Bull (big green) → BUY bias.
Mega Bear (big red) → SELL bias.
2. FIND THE SPOT
Fib levels: 61.8% / 78.6% / 138.2%
Major Support/Resistance
3. CONFIRM ON BIGGER TIMEFRAME
Example: 15M Mega Bar → Check 1H trend direction.
4. SET YOUR LEVELS
Stop-Loss:
Long → Below Mega Bull low (+0.2×ATR)
Short → Above Mega Bear high (+0.2×ATR)
Take-Profit:
Fib extensions: 127.2% / 161.8% / 261.8%
Prior highs/lows
5. RISK SMART
Risk 1–2% max per trade
Aim for 2:1+ R:R
🌍 WORKS ON:
Forex • Commodities • Stocks • Crypto • Indices
THE RETAILER’S FORMULA:
🟢 Big Green → Buy
🔴 Big Red → Sell
🎯 Fibs = Payday
One setup. One signal. Discipline = profit.

Apex Edge - VantageApex Edge – Vantage
Quarter-Wick Reversal System | Price Action Based | Non-Repainting | Visual Confirmation Tool
Overview:
Apex Edge – Vantage is a precision price action indicator built to assist traders in identifying high-probability reversal entries — not based on indicators, but on how candles behave at their extremes.
This tool implements a clean, repeatable framework that reflects how I personally trade:
Spot a candle that closes with strong directional intent,
Then wait for a controlled pullback into the outer quarter,
And strike — only if price respects that line.
There’s no magic here — just raw, tactical logic visualized clearly on your chart. It's not designed to predict the market — it's built to respond when price offers you Vantage.
Core Logic:
Dot Detection – Final Quarter Close Candles
A green dot prints below a bullish candle if it closes within the top 25% of its wick-to-wick range.
A red dot prints above a bearish candle if it closes within the bottom 25% of its range.
These dots signify candles that made a strong, deliberate move in one direction — where price was pushed to an extreme and held that extreme into the close. These candles often signal institutional intent or momentum imbalance.
Entry Confirmation – Controlled Wick Rebalance
On the very next candle only, price must wick into the prior dot candle's outer quarter — but must not pass beyond it.
For buy entries, the wick must enter the bottom 25% of the previous green dot candle, but not dip below it.
For sell entries, the wick must reach into the top 25% of the red dot candle, but not exceed it.
This wick into the quarter is seen as a controlled rebalancing — a tactical reaction back into the origin zone before potential continuation.
Arrow Printing – Visual Entry Signal
Once the entry criteria are confirmed, an arrow is printed after the candle closes.
This arrow continues to print on each new candle as long as price does not violate the original entry zone — giving visual confirmation that the trade thesis is still valid.
If price breaks above/below the quarter range, the arrow disappears.
This ongoing confirmation is useful for staying in trades, managing risk, or spotting failed setups early.
Automatic Stop Loss Level
A horizontal Stop Loss line is drawn from the extreme wick of the original dot candle.
For buy entries, SL is placed below the green dot candle's low.
For sell entries, SL is placed above the red dot candle's high.
This provides immediate risk context — perfect for traders using limit orders or looking to scale in.
Coding Logic:
This script uses plotshape() and plot() functions for all visual elements.
Dot candles are identified using quarter-range logic via:
pinescript
Copy
Edit
close >= high - (high - low) * 0.25 // for bullish
close <= low + (high - low) * 0.25 // for bearish
Entry validation logic triggers only on the next candle, using:
pinescript
Copy
Edit
low >= quarterLine and low <= high // for buy entries
high <= quarterLine and high >= low // for sell entries
Arrows and SL lines are plotted only on closed candles, ensuring non-repainting behavior.
alertcondition() is used for real-time alerts on valid buy/sell triggers.
How I Personally Use It:
I wait for a dot to print — this shows directional conviction.
On the next candle, I watch for a tap into the outer quarter.
If the wick meets the criteria and the candle closes, I’ll execute manually at the close of that candle.
As long as the arrow remains on the chart, I know the setup hasn’t been invalidated.
I combine this with market structure, session timing, and liquidity context to build confluence around each trade.
Alerts Included:
Buy Entry Alert: When a green arrow prints (entry confirmed)
Sell Entry Alert: When a red arrow prints (entry confirmed)
These fire once per confirmed signal, allowing you to react in real-time or automate if desired.
Who This Is For:
Manual traders who want clean price-based entries
Anyone who uses market structure, SMC, or liquidity concepts
Traders looking to replace indicators with pure candle logic
Discretionary or semi-systematic traders who want visual tools to guide their decisions
Final Word
Apex Edge – Vantage doesn’t predict price — it shows you where price is offering you control.
This is a surgical tool designed to help you act only when the market gives you a measurable edge — and to stay in the trade as long as that edge holds.
If you're ready to stop chasing trades and start striking from a position of Vantage, then this tool belongs on your chart.

Ralph Indicator - ZaraTrust Smart MoneyThe Ralph Indicator – ZaraTrust Smart Money is a powerful yet simple Smart Money Concepts (SMC) based tool designed for traders who want to trade like institutions. It auto-detects high-probability Buy/Sell zones, Support/Resistance levels, and Demand/Supply areas on the chart — giving you clear, visual, and actionable signals without the clutter.
⸻
🔍 Key Features:
✅ Smart Money Structure
• Uses pivot-based logic to identify potential structure points
• Helps you understand market flow (e.g., BOS, CHoCH simplified logic)
✅ Automatic Support & Resistance
• Plots major levels based on significant highs and lows
• Helps catch key reversal or breakout zones
✅ Demand & Supply Zones
• Visually shows areas where price may react strongly
• Based on smart pivot detection from recent swings
✅ Buy/Sell Trade Signals
• Highlights buy when price breaks resistance (possible bullish shift)
• Highlights sell when price breaks support (possible bearish shift)
✅ Clean & Easy UI
• Toggle features on/off from settings panel
• Labels and shapes are plotted clearly on the chart for instant reading
⸻
🛠️ Recommended Use:
• Use on 15min to 4H timeframe for intraday or swing trading
• Combine with price action (e.g., confirmation candles, liquidity grab)
• Works best when paired with institutional logic (OBs, FVG, liquidity)
⸻
⚠️ Disclaimer:
This indicator is a tool, not a signal service.
It does not guarantee 98% accuracy, but it’s designed to highlight smart money zones and high-probability areas. Always do your own risk management and backtest before using on a live account.

Volume Profile & Smart Money Explorer🔍 Volume Profile & Smart Money Explorer: Decode Institutional Footprints
Master the art of institutional trading with this sophisticated volume analysis tool. Track smart money movements, identify peak liquidity windows, and align your trades with major market participants.
🌟 Key Features:
📊 Triple-Layer Volume Analysis
• Total Volume Patterns
• Directional Volume Split (Up/Down)
• Institutional Flow Detection
• Real-time Smart Money Tracking
• Historical Pattern Recognition
⚡ Smart Money Detection
• Institutional Trade Identification
• Large Block Order Tracking
• Smart Money Concentration Periods
• Whale Activity Alerts
• Volume Threshold Analysis
📈 Advanced Profiling
• Hourly Volume Distribution
• Directional Bias Analysis
• Liquidity Heat Maps
• Volume Pattern Recognition
• Custom Threshold Settings
🎯 Strategic Applications:
Institutional Trading:
• Track Big Player Movements
• Identify Accumulation/Distribution
• Follow Smart Money Flow
• Detect Institutional Trading Windows
• Monitor Block Orders
Risk Management:
• Identify High Liquidity Windows
• Avoid Thin Market Periods
• Optimize Position Sizing
• Track Market Participation
• Monitor Volume Quality
Market Analysis:
• Volume Pattern Recognition
• Smart Money Flow Analysis
• Liquidity Window Identification
• Institutional Activity Cycles
• Market Depth Analysis
💡 Perfect For:
• Professional Traders
• Volume Profile Traders
• Institutional Traders
• Risk Managers
• Algorithmic Traders
• Smart Money Followers
• Day Traders
• Swing Traders
📊 Key Metrics:
• Normalized Volume Profiles
• Institutional Thresholds
• Directional Volume Split
• Smart Money Concentration
• Historical Patterns
• Real-time Analysis
⚡ Trading Edge:
• Trade with Institution Flow
• Identify Optimal Entry Points
• Recognize Distribution Patterns
• Follow Smart Money Positioning
• Avoid Thin Markets
• Capitalize on Peak Liquidity
🎓 Educational Value:
• Understand Market Structure
• Learn Volume Analysis
• Master Institutional Patterns
• Develop Market Intuition
• Track Smart Money Flow
🛠️ Customization:
• Adjustable Time Windows
• Flexible Volume Thresholds
• Multiple Timeframe Analysis
• Custom Alert Settings
• Visual Preference Options
Whether you're tracking institutional flows in crypto markets or following smart money in traditional markets, the Volume Profile & Smart Money Explorer provides the deep insights needed to trade alongside the biggest players.
Transform your trading from retail guesswork to institutional precision. Know exactly when and where smart money moves, and position yourself ahead of major market shifts.
#VolumeProfile #SmartMoney #InstitutionalTrading #MarketAnalysis #TradingView #VolumeAnalysis #CryptoTrading #ForexTrading #TechnicalAnalysis #Trading #PriceAction #MarketStructure #OrderFlow #Liquidity #RiskManagement #TradingStrategy #DayTrading #SwingTrading #AlgoTrading #QuantitativeTrading

Ivan Gomes StrategyIG Signals+ - Ivan Gomes Strategy
This script is designed for scalping and binary options trading, generating buy and sell signals at the beginning of each candle. Although it is mainly optimized for short-term operations, it can also be used for medium and long-term strategies with appropriate adjustments.
How It Works
• The indicator provides buy or sell signals at the start of the candle, based on a statistical probability of candle patterns, depending on the timeframe.
• It is essential to enter the trade immediately after the signal appears and exit at the end of the same candle.
• If the first operation results in a loss (Loss), the script will send another trade signal at the start of the next candle. However, if the first trade results in a win (Gain), no new signal will be generated.
• The signals follow cycles of 3 candles, regardless of the timeframe. However, if a Doji candle appears, the cycle is interrupted, and no signals will be generated until the next valid cycle starts.
• The strategy consists of up to two trades per cycle: if the first trade is not successful, the second trade serves as an additional attempt to recover.
Key Points to Consider
1. Avoid trading in sideways markets – If price levels do not fluctuate significantly, the accuracy of the signals may decrease.
2. Trade in the direction of the trend – Using Ichimoku clouds or other trend indicators can help confirm trend direction and improve signal reliability. If the market is in an uptrend (bullish trend) and the indicator generates a sell signal, the most prudent decision would be to wait for a buy signal that aligns with the main trend. The same applies to downtrends, where buy signals may be riskier.
These decisions should be based on chart reading and supported by other technical analysis tools, such as support and resistance levels, which indicate zones where price might face obstacles or reverse direction. Additionally, Fibonacci retracement levels can help identify possible pullback points within a trend. Moving averages are also useful for visualizing the general market direction and confirming whether an indicator signal aligns with the overall price structure. Combining these tools can increase trade accuracy and prevent unnecessary trades against the main trend, reducing risks.
3. Works based on probability statistics – The algorithm analyzes candle formations and their statistical probabilities depending on the timeframe to optimize trade entries.
4. Best suited for scalping and binary options – This strategy performs best in 1-minute and 5-minute timeframes, allowing for multiple trades throughout the day.
Technical Details
• The script detects the candle cycle and assigns an index to each candle to identify patterns and possible reversals.
• It recognizes reference candles, stores their colors, and compares them with subsequent candles to determine if a signal should be triggered.
• Doji candle rules are implemented to avoid false signals in indecisive market conditions. When a Doji appears, the script does not generate signals for that cycle.
• The indicator displays visual alerts and notifications, ensuring fast execution of trades.
Disclaimer
The IG Signals+ indicator was created to assist traders who struggle to analyze the market by providing objective trade signals. However, no strategy is foolproof, and this script does not guarantee profits.
Trading involves significant financial risk, and users should test it in a demo account before trading with real money. Proper risk management is crucial for long-term success.

Tripart Super Forex IndicatorOverview
The “Tripart Super Forex Indicator” is an advanced trading tool designed specifically for intraday trading and scalping. It combines the power of Exponential Moving Averages (EMAs), Average True Range (ATR), and the Relative Strength Index (RSI) to generate precise buy and sell signals. This indicator helps traders identify trend direction, volatility, and momentum, ensuring well-timed entry and exit points in the forex market.
What It Does
The Tripart Super Forex Indicator provides traders with the following:
1. Entry Signals: Buy and sell signals are generated based on the crossover of short-
term and long-term EMAs combined with ATR-based volatility filtering.
2. Exit Signals: Exit signals are generated using RSI to identify overbought and oversold
conditions, ensuring timely exits to lock in profits.
3. Trailing Stop-Loss: Dynamic trailing stop-loss levels are calculated using ATR to
manage risk effectively during trades.
How It Works
1. Exponential Moving Averages (EMAs):
• Short-term EMA: Represents recent price trends, reacting quickly to price changes.
• Long-term EMA: Represents longer price trends, providing a smoother view of the
market direction.
• Buy Signal: Generated when the short-term EMA crosses above the long-term EMA,
and the closing price is above the long-term EMA plus a multiple of the ATR.
• Sell Signal: Generated when the short-term EMA crosses below the long-term EMA,
and the closing price is below the long-term EMA minus a multiple of the ATR.
2. Average True Range (ATR):
• Measures market volatility.
• Used to filter out signals during low volatility periods, ensuring trades are only taken
during significant price movements.
• ATR is also used to calculate dynamic trailing stop-loss levels to protect gains and
manage risk.
3. Relative Strength Index (RSI):
• Measures the speed and change of price movements.
• Exit Buy Signal: Triggered when RSI falls below the overbought level minus a defined
threshold, indicating potential for price reversal.
• Exit Sell Signal: Triggered when RSI rises above the oversold level plus a defined
threshold, indicating potential for price reversal.
• Helps ensure exits are timely and consistent with momentum changes.
How to Use It
1. Adding the Indicator :
• Add the “Tripart Super Forex Indicator” to your chart from the TradingView library.
• The indicator will overlay buy and sell signals on the price chart and plot EMAs if
enabled.
2. Configuring Settings :
• Customize the EMA lengths, ATR length, ATR multiplier, RSI length, RSI overbought
and oversold levels, and RSI exit threshold to suit your trading strategy.
• Optionally enable or disable the display of EMAs and ATR on the chart for a cleaner
view.
3. Interpreting Signals :
• Buy Signal: Look for green “Buy” labels below the candlesticks indicating a potential
long entry.
• Sell Signal: Look for red “Sell” labels above the candlesticks indicating a potential
short entry.
• Exit Buy Signal: Look for yellow “Exit Buy” labels below the candlesticks indicating a
recommended exit from long positions.
• Exit Sell Signal: Look for orange “Exit Sell” labels above the candlesticks indicating a
recommended exit from short positions.
4. Risk Management :
• Use the dynamic trailing stop-loss levels plotted on the chart to manage open trades
and protect profits.
• Adjust the trailing stop multiplier based on your risk tolerance and market conditions.
Concepts Underlying Calculations
• Trend Detection: Utilizes the crossover of short-term and long-term EMAs to identify
trend direction and potential entry points.
• Volatility Filtering: Incorporates ATR to filter signals during low volatility periods,
ensuring trades are taken during significant price movements.
• Momentum-Based Exits: Uses RSI to detect overbought and oversold conditions for
timely exits, preventing premature or delayed exits.
By integrating these concepts, the Tripart Super Forex Indicator provides a comprehensive and robust tool for intraday trading and scalping, helping traders make informed decisions and improve their trading performance.
Feel free to reach out for further support or clarification on using the Tripart Super Forex Indicator. Happy trading!

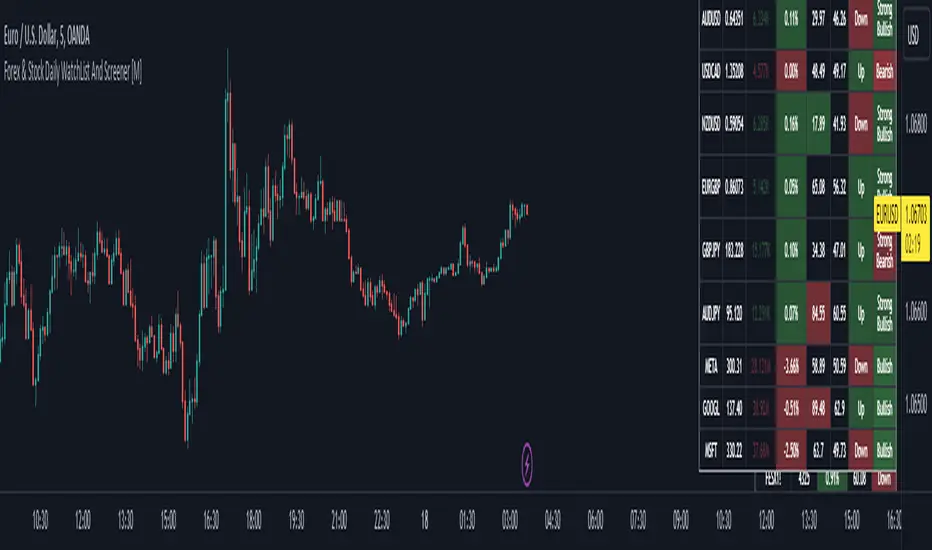
Forex & Stock Daily WatchList And Screener [M]Hi, this is a watchlist and screener indicator for Forex and Stocks.
This indicator is designed for traders who trade in the forex markets and monitor developments in indices and other currency pairs.
It includes information on 14 indices such as the volatility index, Baltic dry index, etc. You can customize the indices as you wish. The indices table contains the index's price (or points), daily change, stochastic value, and trend direction.
The second table is designed for trading forex and stock currency pairs.
In this table, you will find information such as price, volume, change, stochastic, RSI, trend direction, and MACD result for all traded pairs. You can customize all the currency pairs in this table as you wish, and you can also tailor the oscillator settings to your preferences.
In the settings section, you can use checkboxes to hide the pairs in both tables.
The "Customize" section in the settings allows you to personalize the table appearances according to your preferences.
Output7The "Output7" indicator is designed to guide traders in identifying potential buy and sell signals. This is achieved through the calculation of a custom indicator named `output7` and its derived moving averages. `output7` is defined as `c_1 - c_20 * (ohlcSq / hlSq)`. Here, `ohlcSq` stands for the square of the average of open, high, low, and close prices, while `hlSq` signifies the square of the average of high and low prices. `c_20` and `c_1` correspond to the closing price 20 periods ago and the current closing price, respectively.
**Interpreting the Indicator:**
**1. Support and Resistance**: This indicator calculates the support and resistance levels for the `output7` over a predefined lookback period. These levels are essential in the identification of potential price reversals in the market. When the `output7` line approaches or crosses these levels, it may suggest significant market shifts.
**2. Moving Averages of `output7`**: The indicator also generates short-term (5 periods by default) and long-term (10 periods by default) simple moving averages (SMAs) of the `output7` value. These SMAs can be helpful in determining market trends. When the short-term SMA lies above the long-term SMA, it indicates an upward trend. Conversely, when it falls below, it suggests a downward trend.
**3. Buy and Sell Signals**: The Output7 indicator generates two types of buy and sell signals based on the crossover of different moving averages. Yellow signals are produced when the simple moving average of close prices (7 periods by default) crosses the exponential moving average of close prices (14 periods by default). The blue signals are generated when the short-term SMA of `output7` crosses the long-term SMA of `output7`.
It is important to note that like all technical analysis tools, the Output7 indicator should not be used in isolation. Instead, it should be combined with other forms of analysis and indicators to validate its signals and minimize the likelihood of false signals. Factors such as the overall market trend, price patterns, volume, and fundamental analysis can provide additional context to the signals provided by the Output7 indicator. The interpretation of these signals should align with a trader's overall trading strategy, risk tolerance, and financial goals.
And finally. If you discover something else regarding this indicator. Please let me know in the comment section.

Divergence Indicator Screener [Trading Solutions]It's been a while since the last publication on the platform. We've been studying the charts and developing some interesting strategies and indicators, so we'll be posting some ideas in the near future.
Overview
This indicator allows you to find divergences between the price action and the classic RSI. It has the ability to anticipate trend changes.
Highs and Lows are determined using Pivot Points, wich can be adjusted in settings.
You can use this indicator to find two kind of divergences, Regular and Hidden:
Regular is when price makes a higher high, but the RSI makes a lower high
Hidden is when price makes a lower high, but the RSI makes a higher high
The opposite case for Bearish Divergence
The most important functionality of this indicator is that we can be alerted when a divergence occurs in different trading pairs, without the necessity of checking different charts at the same time, and seize opportunities offered by the market. You only have to go to Alerts Tab , click on Create Alert , select Divergence Indicator Screener and wait for the Notification in your favorite device.
You can choose any ticker to be plotted on chart and even add a new one.
Settings
To get everything started with this indicator, here are the different inputs:
RSI Settings: Period y Source
Pivot Point: Left and Right lookback bars
Filter Divergences: Regular and Hidden and max and min distance from the pivot points to consider a valid divergence
Draw table and Filter how much bars to look for a divergence in the past and plot it in the table: The fewer bars, less divergences shown
We hope you can take the most of this tool, and helps improve your day to day trading. Feel free to comment and make suggestions. We will be updating soon

Forex Master Pattern Contraction Finder by nnamThis script is for use with the FOREX Master Pattern to assist the user with drawing in True Value areas.
The script uses a combination of LOWER HIGHS and HIGHER LOWS to pinpoint areas of potential contraction and marks them with an X.
Using these X symbols as visual guidance, the user can easily locate areas of contraction or "tightening" of the price as it comes out of the expansion phase.
In addition, the daily highs and lows create a visible red or green box (depending on price in relation to the previous days close). These boxes also assist the user in determining the average price for the day and whether or not the price is contracting. A WIDE box is indicative of an expansion phase or widening in price swings and a "skinny" box is indicative of a tightening in price swings .
A combination of both plotted X contraction signals and a tightening box are highly indicative of a contraction phase. These contraction phases appear early in the beginning stage of the FOREX MASTER PATTERN giving the user ample time to plan trades and spot breakouts from the contraction into expansion.
The Image above shows a prime example of a potential contraction in price on the ETH/USDT 1 hour chart.
A series of highs and lows shows an expansion. The indicator settings allow the user to turn ON a visual text label showing each higher high, lower high, higher low and lower low in any combination.
Lower High and Higher low is ON by default and is represented by BOTH an X and the initials LH above bar and HL below bar for easier identification of the actual bar that triggered the signal.
In the absence of an X signal or initials LH + HL the contraction is not confirmed. As you can see in the screenshot below, the boxes alone are not indicative of a contraction and can be false positives. It is important to wait for both.
INPUTS AND SETTINGS
To make the indicator more user friendly, I have added several on off buttons for certain attributes. Many are OFF by default for a clean look when firs t starting the indicator. Below is a list of settings and what they are.
Contraction Settings
- Show potential contractions on chart?
on by default - shows the Lower Highs and Lower Lows with an X sumbol
Moving Average Settings
Exponential Moving Average Length
default is 50EMA but can be changed
- Show Moving Average on chart?
off by default and must be checked to add the ema
RSI Settings
- Show RSI Overbought and Oversold?
off by default
Users can turn this on and use in conjunction with higher high and lower high to spot potential reversals
RSI Source - default is CLOSE
RSI Length - default is 6
RSI Overbought Level - default is 85
RSI Oversold Level - default is 15
Chart Type Settings
- Use Renko Style Pivots?
Allows Renko to be used (open/close for high/low)
off by default
LOWER HIGHS AND LOWER LOWS (VIEW BULLISH TRENDS)
Show higher highs?
Show Higher Lows?
These can be turned on or off depending on your preference for trend spotting.
LOWER HIGHS AND LOWER LOWS (VIEW BEARISH TRENDS)
Show Lower Highs?
Show Lower Lows?
These can be turned on or off depending on your preference for trend spotting.
BUY AND SELL SIGNALS SETTINGS
(these are experimental)
- Show Potential BUY signals on chart?
- Show Potential SELL signals on chart?
These 'experimental signals' combine overbought RSI with Higher Highs and Oversold RSI with Lower Lows to signal a potential turn in price.
During major corrections you may get several BUY signals in a row as the price plummets and during FOMO bull runs, you may get several SELL signals in a row.
To help minimize this, you can turn ON the Renko option listed above and change the RSI to a higher number.
The signals work best using Heikin Ashi and on 1 hour time frames.
In order for a trigger to occur, the script ensures there are several RSI overbought and oversold signals in a row.
RSI and Higher High, Lower Low options do not have to be turned on to get the signals.
BOX Settings
You can change the border width and color of the boxes.
You may also JOIN the boxes if you want to.
I really hope you enjoy this indicator and I hope it brings you good luck in your trading.
Don't forget to follow so you are notified when I upload any new indicators.
nnamdert

Forex Midpoint Stratejisi For Nasdaq English Knowledge:
Midpoint Strategy;
The general calculation method is a strategy that helps determine direction by the intersection of a MA line and the value obtained by dividing the lowest and highest price in the specified length range.
Başlangıç Periyodu: The data length of the Midpoint Line.
Kaydırma Seviyesi: The number of steps forward or backward of the Midpoint Line.
Yüzde Seviyesi: the amount of vertical scrolling.
Uzunluk: The length of the MA line
represents.
This strategy is prepared for the Nasdaq 5-minute period. It needs to be optimized for use on other instruments.
There are take profit and stop loss levels within the codes. Friends who want to use it can remove the invisibility from the relevant sections. Also, I removed the midpoint and the MA line so that it does not crowd the image, you can add it if you want.
Thank you.
Turkish Knowledge:
Midpoint Stratejisi;
Genel hesaplama yöntemi, belirlenen uzunluk aralığındaki en düşük ve en yüksek fiyatın ikiye bölümü ile elde edilen değer ve bir ortalama çizgisinin kesişimleriyle yön belirlemeye yardımcı bir stratejidir.
Başlangıç Period: Midpoint Çizgisinin veri uzunluğunu.
Kaydırma Seviyesi: Midpoint Çizgisinin ileri veya geri adım sayısını.
Yüzde Seviyesi: dikey kaydırma miktarını.
Uzunluk: Ortalama çizgisinin uzunluğunu
temsil etmektedir.
Bu strateji Nasdaq 5 dakikalık periot için hazırlanmıştır. Diğer enstrümanlarda kullanılması için optimize edilmesi gerekir.
Kodların içinde Kar alma , zarar durdurma seviyeleri mevcuttur. Kullanmak isteyen arkadaşlar ilgili bölümlerden görünmezliği kaldırabilirler. ayrıca midpoint ve ortalama çizgisinide görüntü kalabalığı yapmaması için ben kaldırdım isterseniz siz ekleyebilirsiniz.
Teşekkürler.

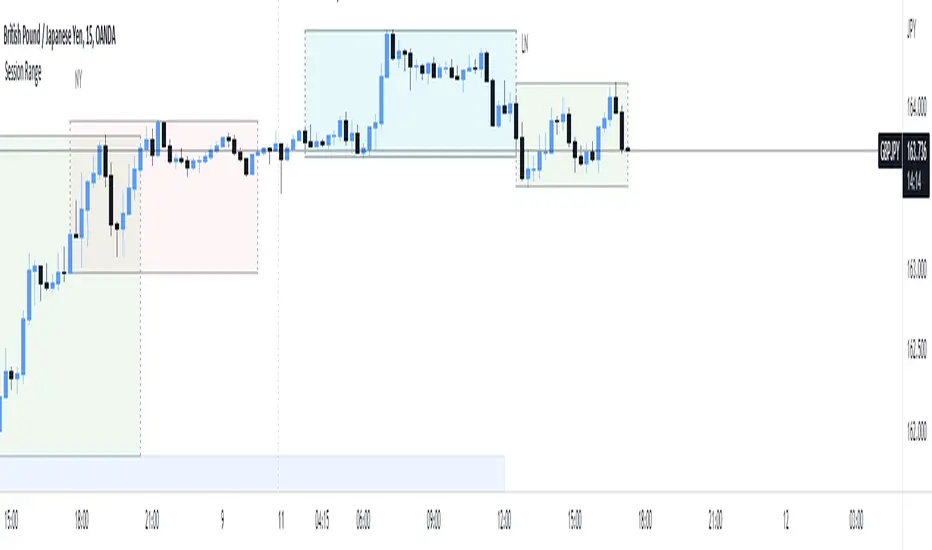
Fx Session RangeHello traders ,as you know the session timing plays a major role in trade execution.
I was searching for a good session indicator for a very long time but I was not satisfied with the indicators which are already available on Trading view. So I decided to code one my self.
This indicator is based on the timing provided by the website www.forex.timezoneconverter.com and time is set according to Ney York time zone.
I have added almost all major sessions including (Sydney , Tokyo and Frankfurt) and almost all features which I could.
I hope you guys 👍this indicator .
Incase you notice any bug or want any features added, let me know in comment section or you can Dm me as well.
Thank you all , enjoy :D
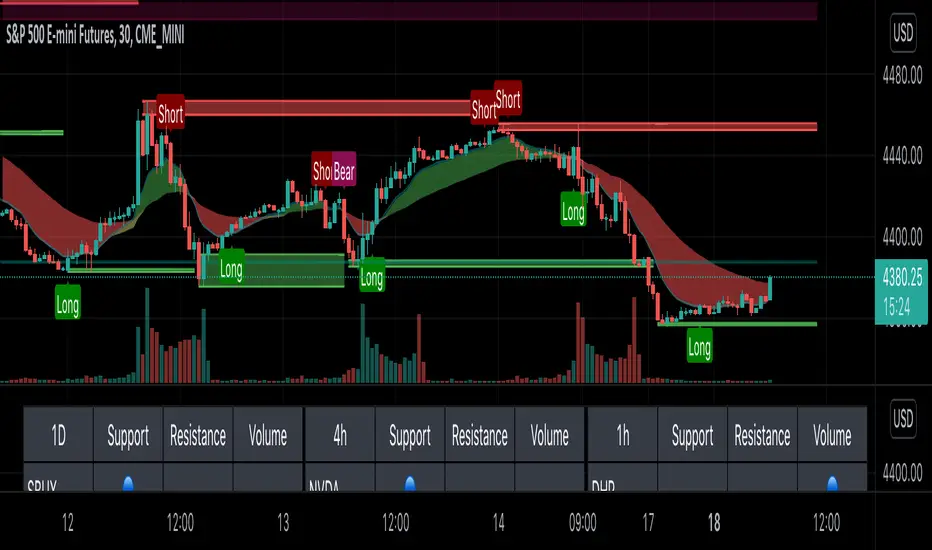
Clutch AlgoThe Clutch Algo provides reversal signals and trend signals. The indicator can be used for stocks, crypto and forex. It can also be used for day trading and swing trading.
Reversal signals were done by modifying the Bollinger Bands and MACD and combining them in a unique way to find explosive price actions. These have been modified to provide signals at the bottom or top of a trend to catch price reversals and to improve margin of safety on trades. These signals are labeled as “Long” and “Short”.
We also added automatic support and resistance zones to increase the accuracy of the “Long” and “Short” signals. This was done by using historical price action of highs and lows and periods of consolidation where price reversed.
The trend signals, which are labeled as “Bull” and “Bear” signals use a combination of exponential moving averages. These signals can be used as trend continuations.
We also added an exponential moving average cloud to help traders easily visualize trend. This can be used as a guide to help you stay in a trade to maximize profits. It can also be used as a guide to get out of a trade if price breaks out of the cloud. The third use of the cloud can be used as support resistance in between high/low support and resistance zones.
Tips:
- Only take long/short signals when there is a support or resistance zone formed at or near the long/short signal, preferably within 1-3 bars of the support or resistance zone. Signals too far from "Long" or "Short" signals reduces your margin of safety.
- When in a Long or Short position, use support or resistance zones as a stop loss level as price is likely to go against the position.
- When taking a Long/Short or Bull/Bear signal, wait for candles to be completed to get best entry possible.
- Previous support zones can be used as resistance zones and previous resistance zones can be used as support zones.
- The support and resistance (SR) period can be adjusted. Numbers in the SR settings are bars looking back. For example, a setting of 10, looks back 10 bars.
xBrat BIAS DEPTH HeatmapThis Trading Indicator is the "Go - No Go Gauge" for any trading signals strategy. A Sub-Chart that looks up 6 time frames and gives you real time BIAS. Bullish, Neutral or Bearish on each level. Making decisions, acting on trading signals easier! Only identifying those highest probability trades, no matter what signals trading indicator you are using. Ideal for Forex Trading, Futures Trading, Crypto Trading and Stocks Trading
This BIAS Depth Heatmap includes:
6 Levels of BIAS Depth
Scalping Setting
Day Trading Setting
Swing Trading Setting
And by only concentrating on trading the highest probability trades of any trading strategy, we can block out all the other noise and concentrate on a simple set of rules!
This is why our Founder, Paul Bratby, decided to help filter out all the noise and allow traders to see what's going off on higher timeframes "in depth" to help make those important trade entry decisions. This more global view of the BIAS DEPTH is designed to help traders make decisions faster!

Reversal zone finderThis script would find potential reversal price zones according to RSI over bought or sell condition and big reversal candle.
It works better in range markets and lower time frames like 5M and especially in Support/Resistance zones.
Suit for scalping in forex or crypto markets.
* Use it as a trade assistant not a trade signal!

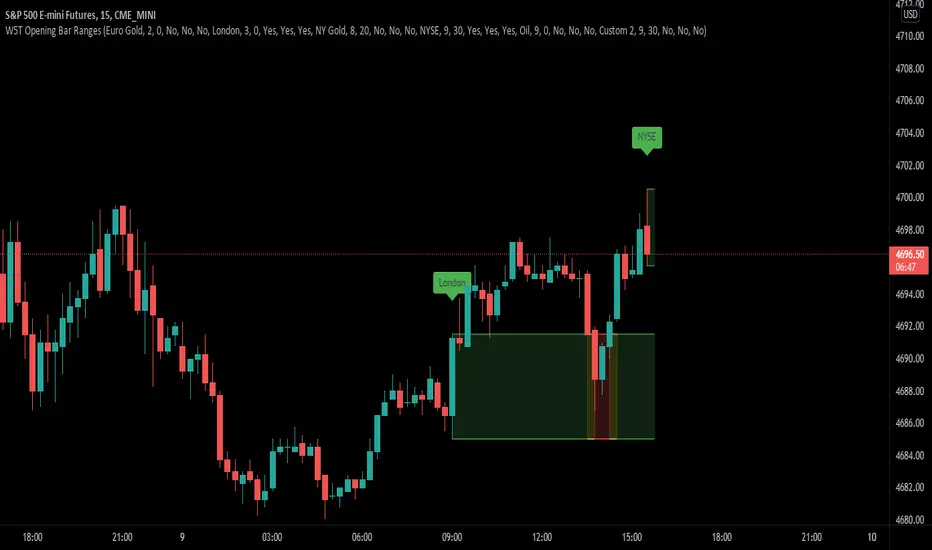
XBrat Range Breakout - Defining Ranges & The Trading BiasxBrat Range Breakout
Designed to help define opening ranges of major markets, along with Gold Pit opens, Oil Pit opens and for major economic data points. We recommend timeframes for opening ranges on different type of instruments further down this description
There are 6 range data points available, 4 of which are pre-defined (but can be adjusted and renamed) and then 2 spare for those important data points. All the times and label names can be adjusted.
4 Pre-Defined Openings are:
Europe Gold Pit Open (8am Europe time)
London Stock Exchange Open (9am Europe time)
New York Gold Pit Open (8.20am EST)
NYSE Open (9.30am EST)
The range is defined by a parallel coloured cloud which changes colour depending on the BIAS of the opening range, calculated automatically for our users. At the same time the Open Tag is also coloured to help identify the BIAS and indeed which direction traders should trade the Range Breakout after the first candle has closed. The range BIAS continues to be drawn on the chart until the following days open. The colour will change as per the BIAS of that opening range. This allows for multiple entries of breakouts of the defined range throughout the following 24 hours.
Range Breakout BIAS Colours
Green - Bullish BIAS - When first candle has closed only look for breakouts to the upside
Red - Bearish BIAS - When first candle has closed only look for breakouts to the downside
Yellow - Neutral BIAS - When first candle closed, look for breakouts to both upside and downside or best not to trade the breakouts as neutral BIAS indicates indecision
Time Frames we suggest for open ranges of any market open or data points are:
Metals & Energy Futures or CFDs - 5 minute time frame
Currencies - Forex Pairs or Futures - 10 minute time frame
Index Futures or CFDs - 15 minute time frame
FY Forex ScalperFy Forex Scalper Indicator:
A powerful indicator that you can use to scalp forex markets, it helps you identify the trend and direction of the market in both long term and short term time frames. The Arrows give you entry points. Read the detailed explanation below and if you have any questions feel free to message.
How does it work:
Fy Forex Scalper has two main aspects one is candles and the other is band both are color coded and works independently. As we all know, markets are not always trending and often move in a tight range. The Fy Forex Scalper indicator assists you in identifying trading opportunities by displaying trading zones and non-trading zones by painting the candles in three different colors: red, yellow, and green. When the candles are red, the script is in the selling zone, when the candles are green, the script is in the buying zone, and when the candles are yellow, the script is non trading zone. The band mainly works as support and resistance and gives you overall trend direction, If the band is red the trend direction is down and if band is in green the trend is up. So both candles and band give you the trend direction how to enter the trade explained below.
How to enter the trade:
Long Entry: Enter the trade when you get the up arrow near the band and make sure the band color is green. When you get the up arrow and band is red you can consider it as false signal.
Short Entry: Enter the trade when you get a down arrow near the band and make sure the band color is also red. When you get the down arrow and the band is in green color you can consider it as a false signal.
What markets it work:
Mainly use it for Forex, Crypto or scripts that move faster.
What time frame is best:
Use 5 mins when the market is moving (like Asian or London opening) use one min when the market isn’t moving.
Can we use it for Swing Trading:
Though it works , but the primary purpose of this indicator is for scalping so better use it on shorter time frames.
How to get access:
This is invite only script so to get access message me.

KayeDinero TrendSetter HFX NFXThis script combines my volume and trend indicators with an added flare.
The mindset for this strategy is a trending market, where price is moving in a consistent direction with some reversals.
The most unique concept of this script is the background calculator (divergent). This is different from other scripts on the platform because of the close tie in with the relative strength index as well as the on balance volume. The divergent lets you know of overbought and oversold conditions.
Another unique take, is the use of the Keltner Channels, which provides insight on volatility.
Best Traded during Hours 3am to 12am EST (NY Time).
This method works best in trending markets.
Time Frame, 1,3,5,15,30min
Currency Pairs: All Major, Exotic, Crypto
Here's The Strategy:
Oversold and Buy: When those are present, proceed to take a buy (call) option.
Overbought and Sell: When those are present, proceed to take a sell (put) option.
Keep in mind, timeframe will depend on your time of trading in the markets.
Morning typically 2-4min
Afternoon / Evening: 3-5min
Hint:
Best Trades on reversals at top and bottom of Keltner Channels.

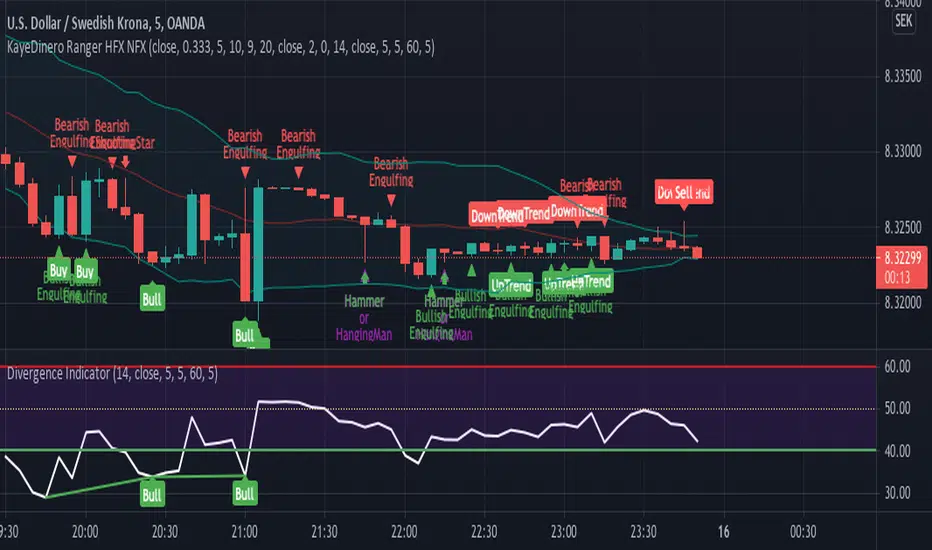
KayeDinero Ranger HFX NFXThis script combines my favorite indicators with an added flare.
The mindset for this strategy is a ranging market, where price is moving in a consistent wave like pattern.
The most unique concept of this script is the candlestick indications. This is different from other scripts on the platform because of the close tie in with the relative strength index as well as the on balance volume.
Best Traded during Hours 3am to 12am EST (NY Time).
This method works best in volatile markets.
Time Frame, 1,3,5,15,30min
Currency Pairs: All Major, Exotic,
Here's The Strategy:
Uptrend and Buy: When those are present, proceed to take a buy (call) option.
Downtrend and Sell: When those are present, proceed to take a sell (put) option.
Keep in mind, timeframe will depend on your time of trading in the markets.
Morning typically 2-4min
Afternoon / Evening: 3-5min
Hint:
Best Trades on reversals at top and bottom of Bollinger bands.
Crypto Fox Alert of Ann Strategy No RepaintHello traders
This is (( sirolf's ANN Indicator)) i updated it to (( No Repaint Version )) and it still have very good results
The new in strategy : -
1 - The Indicatoris no repaint now in any time frame
2- Now Indicatorhave two time frames which make you control strategy in entry and exit positions and you can change it as you want .
3- I recommended so much working in 5 min time frame and 15 min time frame to get the best results
but in the same time the Indicator is working in all time frames this just my advice for traders
4- I recommend so much using take profit and stop loss to avoid huge movements in markets
Notes.
--This Indicator Never Ever Repaint so it based on no repaint parameters.
--When using this alert you must notice this points :
1 - when you but the alert in the chart you will get this message :
( this indicator may be repaint ) and this for using time frame but this normal and dont worry of that
the indicator will never repaint .
2 - ( BUY) this the choice for enter long position .
3 - ( SELL) this the second choice you can use it to enter short position or exit long position .
4 - ( per bar close ) you must always use this option in alert conditions page .

Point of possible Reversal (PPR): forex Strategypoint of possible Reversal, PPR :
in this strategy I have tried to find out the possible Reversal points in the forex pairs. It’s the most resisted levels from where the trend takes up a particular direction. These PPR can lead the price in any direction depending upon the time zone its happening in.
In this strategy once the code finds a PPR it then checks for suitable time zone then it checks for the RSI confirmation, it checks for the Parkinson Volatility, it checks for internal Bar Strength (refer below for more information)
The following setting details will help you in the understanding the strategy and indicator used:
This indicator contains the following setting:
1.Fixed trading sessions for Long and Short
i. Fixed trading session for long trades (long position can be taken in that period of time only)
ii. Fixed trading session for short trades (Short position can be taken in that period of time only)
The concept behind restricting the time to go long or short is because in forex the particular pair move in a particular direction depending upon the currency and time zones.
This strategy works on different forex pairs, you need to find the best settings. I will be providing the best settings which works for this strategy and different pairs.
2.Setting for back test selection date range you can check the beck test of a particular time range.
3.You can check Long and Short positions performance separately, by unchecking the “ Go_long ” option it will remove all long positions from back test. Vice versa for “ Go_short "option
4.Internal Bar Strength
IBS is simply an indicator where you buy on weakness and sell on strength, the cornerstone of any mean-reverting strategy.
It oscillates from zero to one and measures the relative position of the closing price relative to the High and Low.
IBS = (Close – Low) / (High – Low)
In the input setting the you can disable enable the IBS option from the strategy.
5. Parkinson volatility
Parkinson volatility is a volatility measure that uses the stock’s high and low price of the day (can be changed in the setting, instead of day it can be set to any bar length)
The main difference between regular volatility and Parkinson volatility is that the latter uses high and low prices for a day, rather than only the closing price.
In the setting you have three option
1. Enter Volatility Threshold
If the Parkinson volatility value is greater than the the threshold value then it lets the trade happen.
2.Set the high/low bar time frame for calculating Parkinson volatility. ( Set 60m by default)
Formula used as below:
high_=security(syminfo.ticker, input("60"), high)
low_=security(syminfo.ticker, input("60"), low)
hourlyRangeSquared = pow((log(high_) - log(low_)), 2)
dailyParkinsonVol = sqrt(sum(hourlyRangeSquared, 24) / (4 * log(2)))
6. "Enter no of contract size"
This setting helps you to set the contract size , by default it is set to 100000.
7.This setting is for the PPR, in this you can change the search of PPR in another time frame, you can add higher timeframe PPR in the chart, by default the PPR is set to search for current time frame PPR.
8.Futrther confirmation of trade is done through the RSI criteria . In this I have provided four kind of RSI confirmation you can test all by selecting any one of the four.
1. filter trade on the basis of BB of RSI (as shown in the image)
2. filter trade on the basis of RSI Levels (RSI>50 for long, vice versa for short)
3. filter trade by rsi>basis of BB of RSI(for long) & rsi<50(for short)
4. filter trade by rsi>50(long) & rsi< basis of BB of RSI(short)
SELECT ONLY ONE OF THE ABOVE IN SETTING.
9.For Exiting the trade I have used the trailing SL you can change it in setting.
You can exit the trade using two targets (two take profit) using different size for editing the trade.
If you want to take only on target then you have to make QANTITY of shares for 1st Exit as 100. Then you will exit all your position in the first target achieved.
A big thanks to kodify.net there articles are very helpful kodify.net
Thanks to stack overflow community for clearing the doubts.
Thanks to Mickey for providing assistance.
Trading view official documentation on V4 of pine script also helped me.
