Daily Monday Weekly Monthly Quarterly Yearly High Low Mid This indicator can be useful for traders who are interested in analyzing price movements over different time periods. By displaying the daily, Monday, weekly, monthly, quarterly, and yearly high and low values along with their mid values on a chart, traders can get a better understanding of how prices have behaved over longer periods of time.
For example, a trader might use this information to identify trends or patterns in the market. They might look for occasions when the daily high and low values move outside of an established range or when the weekly or monthly mid values cross certain key levels. This could signal a potential change in the market trend that the trader could act upon.
Additionally, the code can help traders identify key support and resistance levels based on the high and low values of the candles. By plotting these values on a chart, traders can see where prices tend to find support or resistance over different time periods. This information can be used to place stop loss orders or take profit orders at important levels.
Overall, the benefit of using the code you provided is that it offers traders a comprehensive view of price movements over different time periods, which can aid in making more informed trading decisions.
Each level described above has its own unique label, which is abbreviated for convenience. These abbreviations are listed below for quick reference:
For daily levels: DH (Daily High), DM (Daily Mid), and DL (Daily Low)
For Monday levels: MonH (Monday High), MonM (Monday Mid), and MonL (Monday Low)
For monthly levels: MH (Monthly High), MU50 (Monthly 50 percent of Mid and High), MM (Monthly Mid), MD50 (Monthly 50 percent of Mid and Low), and ML (Monthly Low)
For quarterly levels: 3MH (Quarterly High), 3MU50 (Quarterly 50 percent of Mid and High), 3MM (Quarterly Mid), 3MD50 (Quarterly 50 percent of Mid and Low), and 3ML (Quarterly Low)
For yearly levels: YH (Yearly High), YU50 (Yearly 50 percent of Mid and High), YM (Yearly Mid), YD50 (Yearly 50 percent of Mid and Low), and YL (Yearly Low)
These labels can help you quickly identify the different levels and keep track of important price points.
If the chosen timeframe does not fall under the category of intraday, daily and Monday level will not be displayed.
Please feel free to send your suggestions to @z_mehran.
High

MonkeyblackmailThis script consists of several sections. test it and tell me your concerns. a lot of more works will be done
Volume Accumulation : The first part of the script checks for a new 5-minute interval and accumulates the volume of the current interval. It separates the volume into buying volume and selling volume based on whether the closing price is closer to the high or low of the bar.
Volume Normalization and Pressure Calculation : The script then normalizes the volume with a 20-period EMA, and calculates buying pressure, selling pressure, and total pressure. These calculations provide insight into the underlying demand (buying pressure) and supply (selling pressure) conditions in the market.
RSI Calculation and Overbought/Oversold Conditions : The script calculates the RSI (Relative Strength Index) and checks whether it is in an overbought (RSI > 70) or oversold (RSI < 30) state. The RSI is a momentum indicator, providing insights into the speed and change of price movements.
Volume Condition Check and Wondertrend Indicator : The script checks if the volume is high for the past five bars. If it is, it applies the Wondertrend Indicator, which uses a combination of the Parabolic SAR (Stop and Reverse) and Keltner Channel to identify potential trends in the market.
Swing High/Low and Fibonacci Retracement : The script identifies swing high and swing low points using a specified pivot length. Then, it draws Fibonacci retracement levels between these swing high and swing low points.
he monkeyblackmail script works well in the 5 minutes chart and combines several elements of technical analysis, including volume analysis, momentum indicators, trend-following indicators, volatility channels, and Fibonacci retracements. It aims to provide a comprehensive view of the market condition, highlighting key levels and potential trends in an easily understandable format. Don’t be too quick to start trading with it, first study how it work and you will blackmail the market.

Key Levels (Open, Premarket, & Yesterday)OVERVIEW
This indicator automatically identifies and draws recent high-probability support and resistance levels (recent key levels). Specifically, yesterdays highs / lows, premarket highs / lows, as well as yesterdays end of day Volume Weighted Average Price and trader specified Moving Average.
This is most useful on charts with intraday time frames (1 minute, 5 minute etc.) commonly used for day trading. This is not ideal for larger time frames (greater than 1 hour) commonly used for swing trading or identifying larger trends.
INPUTS
You can configure:
Line size, style, and colors
Label colors
Which key levels you want to see
Moving Average Parameters
Market Hours and Time Zone
DEV NOTES
This script illustrates:
A method for iterative management of more complex data objects (not just discrete values) with loops and arrays.

Draw Line For High Low Custom Range Interactive█ OVERVIEW
This indicator is an educational indicator to make pine coders easier to how to use interactive inputs with User-Defined Type (UDT) especially when dealing input.time.
█ NOTES
This indicator is not perfect but it is a good starting point or template to start develop custom range interactive indicator.
█ INSPIRATIONS
ABC 123 Harmonic Ratio Custom Range Interactive
XABCD Harmonic Pattern Custom Range Interactive
PriceTimeInteractive
█ CREDITS
CAGR Custom Range
Pine scripts are now interactive
█ FEATURES
1. High Low points are determined based on points selected.
2. Line will be drawn after points are correctly arranged.
3. Label show error once wrong point is selected, move the point as instructed in example.
█ EXAMPLES / USAGE

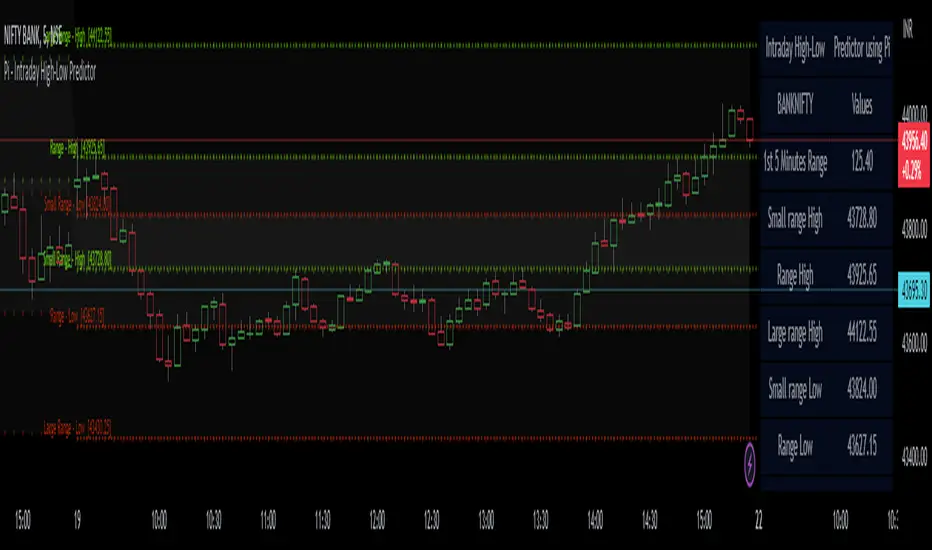
Pi - Intraday High-Low Predictor
Pi - Intraday High-Low Predictor
This is not my Strategy/Research , I've just coded it into a indicator.
I found it interesting & useful so I'm sharing it here.
This Strategy/Research is by Kshirod Chandra Mohanty ( y-o-u-t-u-b-e : Trade with IITIAN )
You can watch his video on y-o-u-t-u-b-e for more info on this one.
the video has following title :
"1Cr Paid Strategy For Free || 10000 Subscribers Special Giveaway || How to find Day High or Low"
This will not tell you which is day high or day low, but it will help you to predict the day high from a day low and day low from a day high.
It will give you a possible range to which the prices could move to.
He has explained/used this on Banknifty.
How to Find out Day High from Day Low & Day Low from Day High :-
He uses the value of Pi (3.14) and the Range of 1st 5minute candle to find out the possible highs from day low and the possible lows from day high.
Range = value of Pi * 1st 5minutes Range
Small range = Range / 2
Large range = Range + Small range
so to find out the possible lows from day high we do following calculations
Small range low = day high - Small range
Range low = day high - Range
Large range low = day high - Large range
and to find out the possible highs from day low we do following calculations
Small range high = day low + Small range
Range high = day low + Range
Large range high = day low + Large range
Note :- This Indicator does Repaint in following ways,
As the script uses the Day High to predict the possible lows ,
so if it's an up-trending day and price keeps on making new High's then the ranges for lows will keep on changing.
similarly the script uses the Day Low to predict the possible high's ,
so if it's an down-trending day and price keeps on making new Low's then the ranges for highs will keep on changing.
My observations / thoughts about this :-
This script does not provide buy/sell recommendations. it just provides possible ranges to where prices can go from Day-High & Day-Low.
It's better to avoid trading when the price is trading between the Small range high & Small range low levels.
As it has high probability that it will be a range bound day and price will stay in between those two levels.
There is a high probability that it will be a trending day if price breaks either the Small range high/low ,
then the price could move to Range low/high.
If price breaks from Range High/Low then there is a high probability that it will be a trending day and the price could move to Large Range low/high.
Note :- If you want to use this on instruments/scripts/indexes which are active for large session such as forex/cryptos , then i suggest that you use the Opening Range period of 4Hours i.e 240minutes, to get better results.
using the default setting of 5minutes will not give good results on them.
play around with this value to find out which one suits that instrument/script/index the best.
Don't trust these levels blindly, do backtest or live testing of this then use for real trade if you want.
Use Price action near these levels to make any trading decision's.
The script provides following options :
1. Option to display Ranges in a Table (which you can enable/hide as you wish)
You can set the Table's location, size , background color & text color according to your preference.
2. Option to enable/hide Predicted-Highs from Day-Low on chart.
3. Option to enable/hide Predicted-Lows from Day-High on chart.
4. Option to set the Opening range period - here you can select your preferred opening range for calculation purpose.
5. Option to enable/hide historical levels on chart.
6. Options to customize the colors & line styles for lines.
7. Options to customize the colors , position & size for labels.
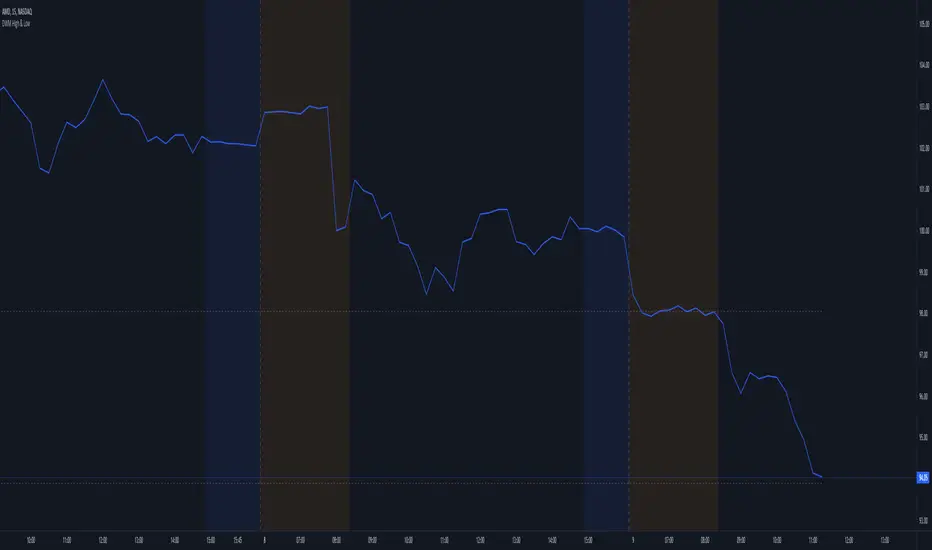
Extended Session High/Low - Intraday and daily chartsThis script plots the extended session highest high and lowest low levels. It works on any time frame from 1 minute to daily.
Please note that during the extended session, TradingView stops updating the daily chart. This means that once the script is loaded on a daily chart, it will not be updated until the market opens, unless you manually reload the layout (Ctrl+R). For this reason, it is recommended to use a multi-timeframe layout, so when the pre/post market line is near the extended session high/low on the daily chart, you can compare these values with those on an intraday chart of the same ticker.
The extended session high/low are important for day traders because they represent the maximum and minimum limits within which the trades have taken place during the extended trading hours. This can make them levels of support/resistance that can be useful for planning trend following, reversal and range-bound strategies.
By displaying the extended session high/low on the daily chart, traders can also see if there are any significant levels nearby that are related to the daily time frame, such as trendlines, support/resistance levels, or moving averages. This can help the trader evaluate whether there is enough room for a price movement in the direction of his trading strategy.

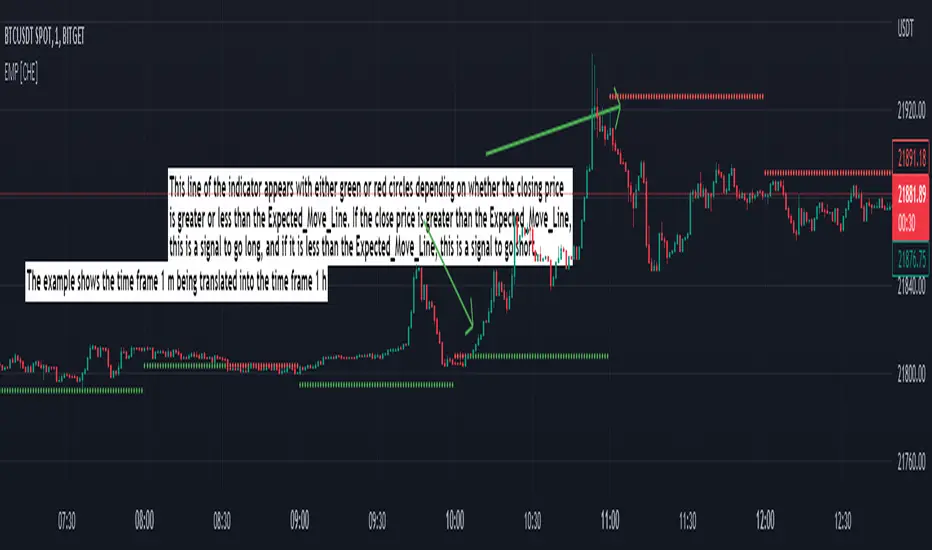
Expected Move Plotter [CHE]Expected Move Plotter
"There is magic in everything new."
Introduction:
This script is an indicator for financial trading that plots the expected movement of a security based on the average range over the last five periods. The script is written in Pine Script, a high-level programming language used for creating technical indicators, strategies, and other trading tools for the TradingView platform.
Inputs:
Percentage of Open and Close: This input specifies the percentage of the open and close price to use for the expected movement.
Time Periods: The script takes the different time periods into account and translates them to either 60 seconds, 240 seconds, 1 day, 3 days, 7 days, 1 month, 3 months or 12 months.
Calculation:
The script uses the "Open" and "High"/"Low" values of the last 5 periods to calculate the average range and plots the expected movement above and below the current open price. The plot is either green or red depending on whether the expected move is above or below the current close.
Code Breakdown:
The script starts by defining three integer constants: MS_IN_MIN, MS_IN_HOUR, and MS_IN_DAY, which represent the number of milliseconds in a minute, hour, and day, respectively.
The function timeStep_translate() returns a string that represents the timeframe for a chart based on the current timeframe. The function first converts the chart's timeframe to milliseconds and then uses a switch statement to determine the string value to be returned based on the number of milliseconds in the timeframe.
The script then retrieves the data for the open, high, and low values for the last five periods. The high and low values are used to calculate the average range, which is then used to plot the expected movement above and below the current open price.
Conclusion:
This script provides traders with a visual representation of the expected movement of a security based on the average range over the last five periods. It takes different time periods into account and provides a clear indication of whether the expected move is above or below the current close. The script is easy to use and provides a useful tool for traders looking to make informed trading decisions.
Best regards Chervolino
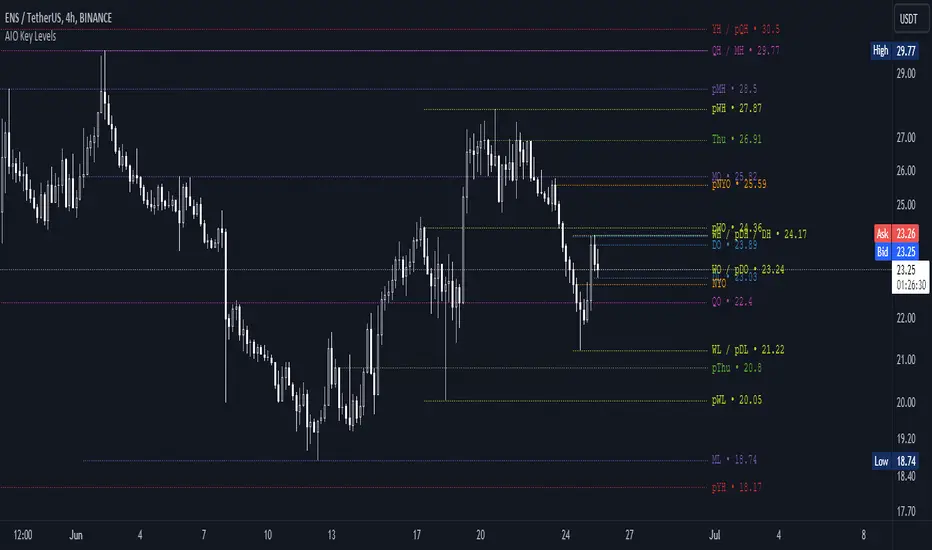
AIO Key LevelsAll In One Key Levels - Displays key levels for any type of chart.
Over 30 levels at your complete disposal.
Filled with a host of features that allow you to customise the appearance and display of the indicator to suit your individual trading style.
The result is a clear and concise indicator that helps traders easily identify key levels.
- The indicator is easy to use and does not need a detailed description.
- With customisable input parameters such as display style, line style, font style, offset, threshold and index.
- The colours for the key levels can also be customised.
- The script uses a 'switch' function and selected input parameters to set display, line and font styles.
- The key levels are constructed using the data received and the selected styles and colours.
- A unique cycle helps to improve the readability of the levels without "polluting" the graph with multiple labels
- In addition, I have left hints in the indicator to help you understand it better.
For Pine coders.
Why did I create it when there are many counterparts?
Simply because counterparts have very large and complex code and modest functionality and flex.
Here I have managed to fit it into 100 lines still readable.
You can learn how to call lots of lines and marks with just one function.
I also created a unique loop that connects labels if they are too close together for better visibility on a plot.
I have left detailed comments for each action.
I would be glad if someone could tell me how to make it more easier.
Prior day and pre-market high lowThis indicator displays the:
- Prior day high
- Prior day low
- Pre-market high
- Pre-market low
as a coloured line across the entire session for each individual session on an intraday chart.
For the extended session, this indicator marks the prior day and pre-market high low for each individual session starting at the pre-market and ending in the post-market, a feature not available on other indicators.
This indicator automatically marks out the levels for the prior day and pre-market high low for each individual session, allowing the user to observe how the price action behaves around the prior day and pre-market high low.
Note:
In this script, request.security() used with lookahead = barmerge.lookahead_on to fetch prices without offsetting the series by for the extended session does not access future data. This is because for extended session, request.security() sees the start of the session to be at the start of the regular session and ends at the end of the pre-market, when in reality the session starts at the start of the pre-market and ends at the end of the post-market.
Hence in each extended session when the line is first drawn in the pre-market, request.security() returns the value of the prior day high/low, and not future data.
Simple Zigzag UDT█ OVERVIEW
This indicator displays zigzag based on high and low, which is using user-defined types (UDT) or objects .
█ CREDITS
LonesomeTheBlue
█ FEATURES
1. Label can be resized.
2. Label can be display either short (Eg : HH, LL, H, L, etc) and long (Eg : Higher Low, etc)
3. Color can be customized either contrast color of chart background, trend color or customized color.
█ EXAMPLES / USAGES

OHLC ToolOHLC Tool allows you to display Current or Historical OHLC Values as horizontal lines that extend to the right on your chart.
Features
Variable Lookback to display a specific historical bar's values. Default = 1 (Previous Candle)
Customizable Timeframe to view HTF Candle values.
Custom Line Colors, Styles, and Thicknesses.
Price Scale Value Display Capability.
For displaying the line values and labels on the price scale you will need to enable:
"Indicator and financials name labels"
and
"Indicator and financials value labels"
These options are found in the Price Scale Menu under Labels. Price Scale Menu > Labels
When you do this you will notice your other indicator values will also be on the price scale,
if you wish to disable these, go to the indicator settings under the "Style" Tab, Uncheck the "Labels on price scale" box.
Indicator Settings > Style > "Labels on price scale"
Enjoy!

Session High and Low IndicatorThis script is meant for stocks that have a pre-market session. It is meant to be used on the 1 min time frame. This script will draw a green line at the high of pre-market, and a red line at the low of pre-market and extend these lines across the regular session day
This makes it easy to see if price action during regular market has broken above pre-market high or broken below pre-market low.
The high/low skips any quick spikes in price action (similar to what happens at 8:30 am every day).

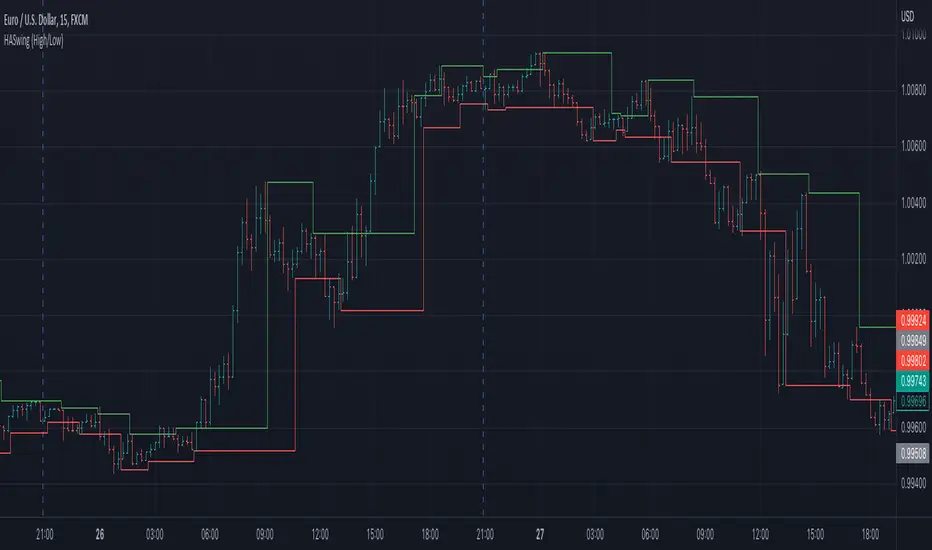
Heiken Ashi Swing High/LowIt uses Heiken Ashi candles to detect recent swing high and low.
It can be used as a stop-loss or support/resistance indicator.
Asymmetric Dispersion High Lowdear fellows,
this indicator is an effort to determine the range where the prices are likely to fall within in the current candle.
how it is calculated
1. obtain
a. gain from the open to the high
b. loss from the open to the low
in the last 20 (by default) candles and
in the last 200 (10*20 by default) candles
2. perform
a. the geometric average (sma of the log returns) over these gains and losses
b. their respective standard deviation
3. plot from the open of each candle
a. the average + 2 standard deviations (2 by default) of the short window size
b. same for the long window size (which is overlapped)
what it shows
1. where the current candle is likely to move with 95% likelyhood
how it can be interpreted
1. a gauge for volatility in the short and long term
2. a visual inbalance between likelyhood to go up or down according to dispersion in relation to current prices or candle open.
3. a confirmation of crossings of, for instance, support and resistances once the cloud is completely above or below.
in regard to bollinger bands (which are and excellent well proven indicator)
1. it segregates upward moves from the downward ones.
2. it is hardly crossed by prices
3. it is centered on the current candle open, instead of the moving average.
we welcome feedback and critic.
best regards and success wishes.

inChart - LibLibrary "inChart"
determine if price value is between chart high + x% and low - x% on the visible chart.
inChart()

Multi Timeframe Support & ResistanceAbout This Indicator
This indicator plots support (pivot low) and resistance (pivot high) using the chart timeframe and second editable timeframe.
How it can be useful
Having higher timeframe support and resistance plotted on a lower timeframe chart helps keep you grounded in the current range the price is in. This can be useful when wanting to avoid taking longs at resistance and shorts at support.
How to use
Adjusting the look back and look ahead will impact how frequently the support and resistance lines move. When Price breaks above resistance or below support, the lines will not move until a new pivot high and pivot low are detected.
Disclaimer: Not Financial Advice

Net New Highs/Lows (With visible code)Basically the same script than Carusolnsights but without hidding the lines of code...
"This indicator displays the net number of stocks on the Nasdaq Composite making 52-week highs or lows. For instance, if there are 60 new 52-week highs and 20 new 52-week lows, the net number will display 40 net new 52 week highs. This indicator is particularty useful in gauging what the breadth is of the Nasdaq.
Three days of net 52-week highs show a healthy market which is conducive to increasing exposure. This condition is highlighted with a green background.
Three days of net 52-week lows show an unhealthy market which is conducive to reducing exposure. This condition is high|lighted with a red background."

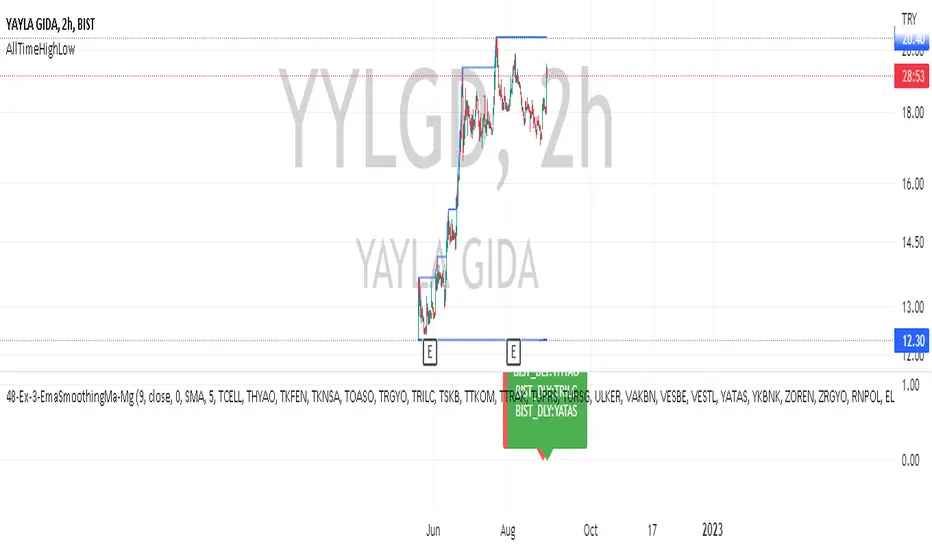
AllTimeHighLowLibrary "AllTimeHighLow"
Provides functions calculating the all-time high/low of values.
hi(val)
Calculates the all-time high of a series.
Parameters:
val : Series to use (`high` is used if no argument is supplied).
Returns: The all-time high for the series.
lo(val)
Calculates the all-time low of a series.
Parameters:
val : Series to use (`low` is used if no argument is supplied).
Returns: The all-time low for the series.
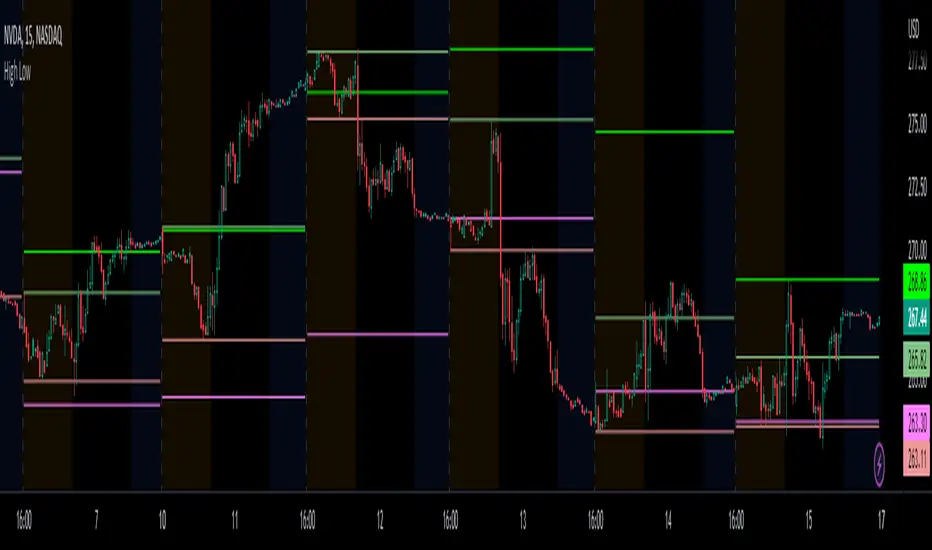
All-In-One Sessions, Weekly, Monday, Previous Highs/LowsWe are forever drawing key levels on our charts with saved drawing templates, but finding the levels, adding the labels, is all tedious stuff. We have indicators, but we have multiple different ones at a time.
What if you could just tick a box on/off?
Well now you can.
This all in one 'levels' indicator is designed to show all the key highs and lows from previous weeks, Monday, the current week, as well as an option to highlight the market sessions and their highs and lows.
There are lots of options available for extending lines and choosing their colors, so once you have set it up how you want, don't forget to save YOUR defaults.
Oorah.

Mark StructureMark Structure is building the market swing structure, minor and sub structure and marks all possible insignificant pivots
Building such structure is really complex task to do, that has a lot of obstacles and challenges. I'm doing my best to develop this indicator behaving in absolutely expectable and right way. Fill free to leave any comments or bug reports.
it supports:
- Marking all pivots with labels or join them continuously with trend lines.
- Marking minor and sub structured swings with labels or join them continuously with trend lines. Marking BOS or SMS BOS, which are mbos. Minor and substructure are structures inside swing structure and it can differ from the structure of lower timeframe
- Marking swings of swing structure with labels or join them continuously with trend lines. Marking BOS or SMS BOS of swing structure
- Changing bullish and bearish colors of each kind of structures
- Changing pivot labelings
- Changing colors of BOSs
Remarks:
- As I told you guys before, it has a lot of challenging cases. eg we have swing low and high on the same candle and in order to decide which pivot goes first I take lower time frame data to figure out what pivot is the first, but it happens that on lower time frame the same issue takes place, due to limitation of TradingView I can't go infinitely to lower timeframes to solve this issue, so I mark those cases with labels
- Another issue is very beginning of the trend its hard to detect swing structure there due to missing historical data. so skip a few waves in the very beginning
- Don't expect to have minor and sub structure in each swing waves, its totally fine when you don't have them at all
- Swing structure is the most significant structure and shows real price direction. Trend change is confirmed when for bull->bear the last HLbull LH>HH and HH-HL-HH are confirmed. You can change labelling for unconfirmed swing trend in the settings. By default its already done

PharshK RSI and Zigzag with H/LIt is with RSI level
and Zigzag Pattern that Market goes on Maximum level and Lower Level
And it is also Showing High and Law Level of last Moving Candle so it is easy to entry and Hold

Day Week Month High & LowThis is a small little script that helps visually mark the high and lows of the DAY, WEEK or MONTH (of your choosing). It's best when paired with my High and Low Fibonacci Pivot Points indicator to help emphasize the high and lows of the day, week or month.
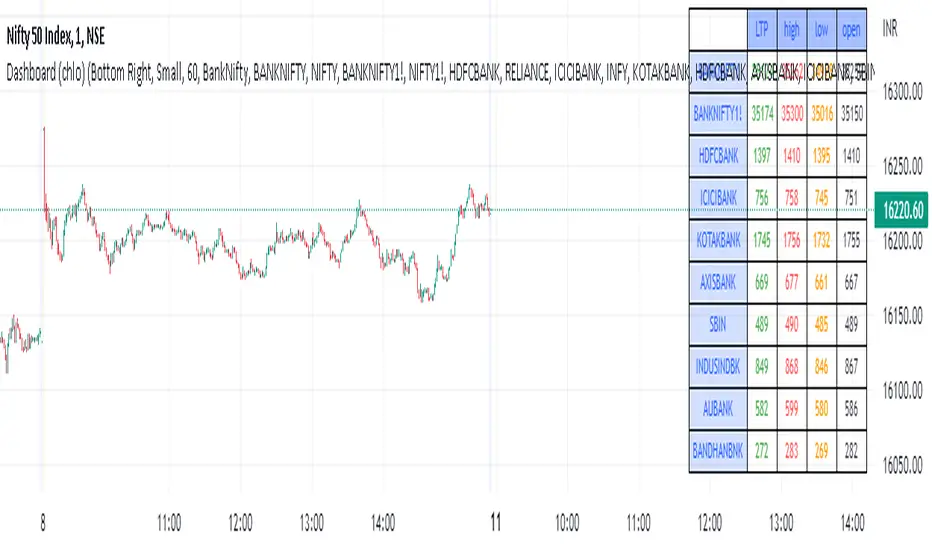
Dashboard (chlo) - v1I am an aircraft maintenance technician who is trying to get into software development in the financial sector.
This is a project in which a dashboard of other security(stocks) with open, close, high, and low will appear.
I could compile this after a detailed study of different dashboards and pine script for several hours
hope you like this.