Pivot TrackerThis script finds swing lows and swing highs based on input criteria for lookback and lookforward periods, and plots letters accordingly.
Helps identify trend or lacktherof
HH = higher high
LH = lower high
HL = higher low
LL = lower low
High

ICHIMOKU Crypto Swing StrategyThis is a crypto swing strategy designed for timeframes bigger than 1h.
The main components are
ICHOMOKU
KDJ
Average High
Average Low
Rules for entry
For long: we have the ichimoku crosses between tenkan and baselines, we have a rising kdj line and at the same time we have a increase in the average high
For short: we have the ichimoku crosses between tenkan and baselines, we have a falling kdj line and at the same time we have an increase in the average low
Rules for exit
We exit when we have inverse conditions than the initial ones used for entry.
Caution
This strategy does not use a risk management, so be careful with it !
If you have any questions let me know !

Michigandolf's 30min Opening RangeThis script plots the 30min Opening Range as well as the previous day's high & low.
Description:
Blue Line = Top of the 30min Opening Range for the session
Pink Line = Bottom of the 30min Opening Range for the session
White Line = Mid-Point of the 30min Opening Range for the session
White Transparent Area = The full range of the 30min Opening Range
Green Line = Yesterday's High for the session
Red Line = Yesterday's Low for the session
Use:
The Opening Range will continue to expand until the first 30minutes of trading has passed, at which point the range will lock in place for the remainder of the trading session. Many traders use these important levels to gauge trade entries and exits (e.g. Mark Fisher's ACD strategy).
This script does not work currently work for futures (e.g. ES, NQ, RTY) due to the session start time. Will configure for futures trading in a future update.

Light BalanceThe script is simple, going for a color scheme logic which tenderly avoids rigorous signals processing.
For the script to remain simple, logical derivatives are also out; as such, there are no secondary relations built off of primary ones. And it also ignores (unless you do this yourself) the logic in a varying order of lines.
Coloring has been done according to a limited set of relations between the four (4) plotted lines.
Quite a bit of information is capture, as you'll see when looking at line order, crossings, and transparency transitions and their patterns.
The approach makes the relations ones which can be learned over time; you become the algorithm to sort out signals. Ha ha. I know that sounds like a cop out doesn't it. Did I mention it's a simple script?
One thing you might want to play with right away are fills having red and green, and lime and fuchsia. It would be cool to reduce it all down to two (2) colors, but all the boolean relations might have to be listed, and it also may not be possible to cumulatively combine transparency overlays of the same value. Visually, that approach may not result to awaken a useful feature anyway. Also, fill() has its limitations in that it cannot be in a local scope; this includes function wrapped calls to fill(), or calls made using branching logic statements if/elseif, iff(), and var = (cond) ? t_val/exp : f_val/exp. So, to my knowledge, a fill() can not be made to be logically on/off.
Please, enjoy getting some use out of it.
Extremely high win rate FOREX swing strategyTHis is a very simple yet extremely efficient FOREX strategy .
In general it tends to work the best against NZD and AUD pairs, however other major pairs and crosses can work as well.
It's made of a time management, together with MACD , moving average , a price action rule and a risk management.
THe logic behind is the next one :
For LONG:
We have 3 ascending candles.
Histogram of MACD is positive.
Last close of a candle is was above moving average.
If all those previous condition happened before 17/18 UTC time depending if its summer time or not, we enter the trade.
For Short:
We have 3 descending candles.
Histogram of MACD is negative.
Last close of a candle is was below moving average.
If all those previous condition happened before 17/18 UTC time depending if its summer time or not, we enter the trade.
RIsk management
For risk management, since we aim to have a 95%+ win rate, we aim to have a 5:1 or 10:1 risk to reward ratio. Meaning that for each $ we can win, we can lose 5-10$.
THats why I recommend to be extremely careful when playing with leverage with this strategy.

Fib High Low PointsThis is a simple indicator which plot high and lows based on Fibonacci sequence.
Best part of this indicator is it don't rewrite itself once it got plotted on the chart, which make it unique from other High low indicators.

nonoiraq indicator it's very strong i edit this indicator to connect it with my bot to auto trading and he take the info from the volume, so when he is give me a single the bot take just 0.50% to 1% for 3 - 5 trade in day and this perfect, if u use a manual trading this indicator can reach to from 10% to 80% in some point .
the indicator have 3 line
(Red , Purple, Yellow)
1- The yellow line it's high sensitivity this mean it's when rich to the -3 or 3 you can open the order when the bar is close and the signal be sure
and u need to watch the your order because in some case he is reach to 0.30% to 2% and the price reflected to loss and when you wait the price reflected to but my advice you take profit and close the order directly.
2- The purple circles it's medium sensitivity this mean when the purple hit the 2.5 or 3 from down or up in indicator with yellow line you open the order when bar close and the signal is be sure , like example in the photo
3- The red circles it's low sensitivity and this one when reach to 3.0 with any line (yellow or purple) you open directly short or long , like the example in the photo
i am sorry for my english it's not very good
please support me to share other idea or script

Example - Custom Defined Dual-State SessionThis script example aims to cover the following:
defining custom timeframe / session windows
gather a price range from the custom period ( high/low values )
create a secondary "holding" period through which to display the data collected from the initial session
simple method to shift times to re-align to preferred timezone
Articles and further reading:
www.investopedia.com - trading session
Reason for Study:
Educational purposes only.
Before considering writing this example I had seen multiple similar questions
asking how to go about creating custom timeframes or sessions, so it seemed
this might be a good topic to attempt to create a relatively generic example.

OBV High / LOW (On-Balance Volume )This is a simple application of OBV indicator (On-Balance Volume ), to visually determine when a given stock current obv is near the highest or lowest based on the number of lookback bars.
Indicator examples:
### OBV value is near an all-time high ##
breakthrough , stock value could set new all-time highs.
rejection , stock value could come down or consolidate.
Example
Inputs
OBV High Lookback -> numbers of bars to look back for the obv high.
OBV LowLookback -> numbers of bars to look back for the obv low.
OBV EMA Length -> Ema length
Notes:
This script also comes with an ema indicator based on obv for smoothing the obv signal since it gets noise at lower timeframes (by default comes disabled)
OBV information
www.investopedia.com
Comments:
This is my first script any ideas, suggestions, or detected errors (language/script) don´t hesitate to send a message.
Best regards, Mauro.

Magic Band MA20 High LowMA 20 period Magic Band - based on Highs and Lows (as opposed to Close), can be used on any time frame for a better grip on price action.

R-HL-PDWThis script doesn't give buy or sell signals. It gives a reference point to the previous day's high and low as well as the previous week's high/low. This will be helpful for intraday trading decisions.

FirstBarRangeFirstBarRange study displays lines for the high and low of the first bar/candle of the trading day, along with shaded areas for the range on top of the first bar high and below the first bar low.
This study is very useful for intraday traders to see when stocks trade above the first bar high, it shows strength, and many times the high of the first bar is also good support.
On the contrary, below the first bar high tends to be good area of weakness and many times it becomes a good resistance level.
Many times when the stock trades inside the first bar range, price will be choppy and range bound.

Hi-Lo Channel StrategyHaven't seen a strategy quite like it. Buy when Heikin Ashi candle closes above a moving average that is sourced on highs - Sell when Heikin Ashi candle closes above a moving average that is sourced on lows. Moving average length should be between 5 and 20 ideally.
NOTE: the Heikin Ashi close values are calculated when the box is checkmarked. You do not need to view the chart with Heikin Ashi candles enabled on the chart. The buy and sell points of the strategy do not change whether or not you are viewing Heikin Ashi candles on the chart as long as the Heikin Ashi setting is enabled.

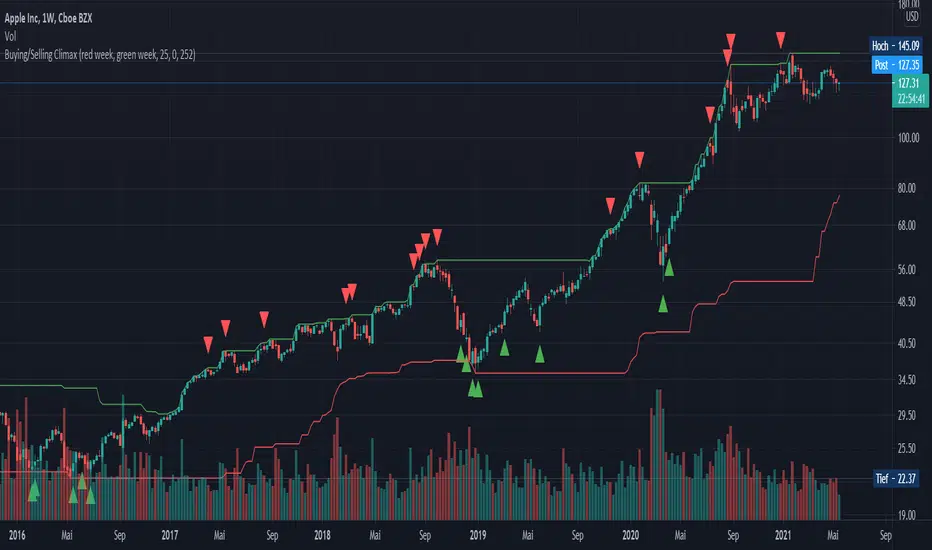
Buying/Selling ClimaxEnglish:
This indicator is designed for the stock market and marks potential buying or selling climaxes. If a "buying climax" or "selling climax" is marked, the probability is high that this price level will not be exceeded or undershot quickly. The indicator is used exclusively on the weekly time level.
Conditions for a "Buying Climax":
- New 52-week high
- The week closes in the loss "red week”
Alternative: The week closes below the opening price of the previous week
Conditions for a "Selling Climax":
- New 52-week low or crash (in the stock).
- The week closes in profit "green week”
- The 2 previous weeks are losing weeks
Alternative: The week closes above the opening price of the previous week
Deutsch:
Dieser Indikator ist für den Aktienmarkt ausgelegt und markiert potenzielle Kauf-/ bzw. Verkaufs-Höhepunkte. Wird ein „Buying-Climax“ bzw. „Selling-Climax“ markiert, ist die Wahrscheinlichkeit hoch, dass dieses Preisniveau nicht so schnell überschritten bzw. unterschritten wird. Der Indikator wird ausschließlich auf der wöchentlichen Zeitebene eingesetzt.
Bedingungen für einen „Buying Climax“:
- Neues 52-Wochen Hoch
- Die Woche schließt im Verlust „red week“
Alternative: Die Woche schließt unterhalb des Eröffnungspreises der Vorwoche
Bedingungen für einen „Selling Climax“:
- Neues 52-Wochen Tief oder Crash (in der Aktie)
- Die Woche schließt im Gewinn „green week“
- Die 2 Vorangegangenen Wochen sind Verlustwochen
Alternative: Die Woche schließt oberhalb des Eröffnungspreises der Vorwoche
High_Low level plots for yesterday, pre market , regular, and AHthis study will plot yesterdays, high and low price, pre market's high and low price, regular day's high and low price and post markets high and low price.

HiLo Extension This Strategy is finding high and low breaks of the day and enter into the trader based on RSI value and time value
1) This strategy is created for Indian Index like Nifty, Bank Nifty and so...
2) Trades are initiate only after 10:15 AM and before 3:10PM
3) High and Low of the day break will be check during the above time frame
4) RSI value will be check (RSI 50)
5) and trade will be initiate
6) Stop loss set as vwma 20...
Note: This Script will work fine in Index future chart not index spot chart...
This is just my idea only... Please back test yourselve, before using it..
Your comments are welcome!

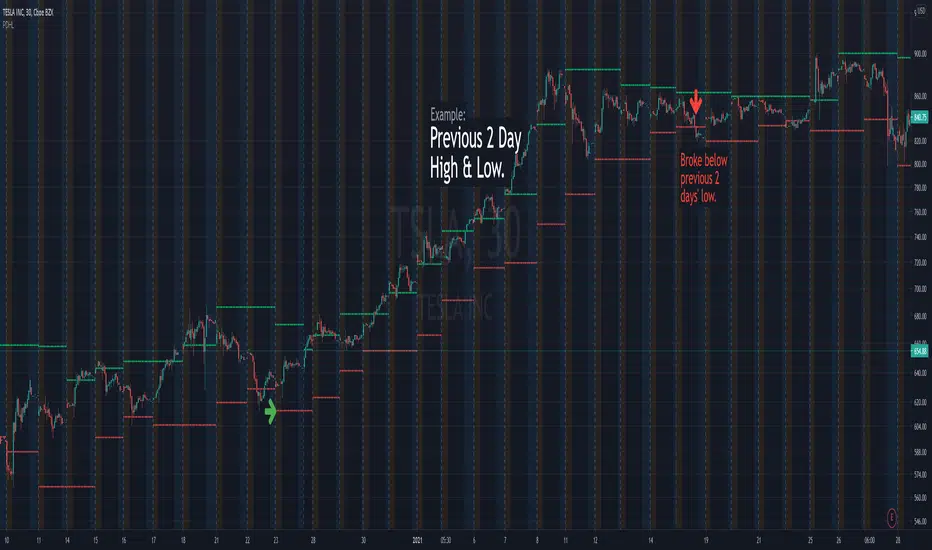
Previous Days High & LowRenders the high and low values from previous days.
Useful alert conditions are provided: "Less than low" and "Greater than high".
Configuration:
The number of days is configurable with a default of 1.
The source of the high and low values.
Use the close value instead of high and low values. Default is false.
The example above uses 2 days to demonstrate an exit strategy.
Strongholds - Objective & Accurate Reference Points / StructuresVery early in my trading career, I came across Pivot Points only to find out that there are as many calculations as one pleases. It was hard to find out which ones work. Most of them probably did only out of randomness, so I ditched the strategy and looked for something else.
I previously used my Oracle Eye and Reference Points scripts but it is time for an upgrade.
Stronghold is a script I have used for quite some time now. I ditched daily and weekly closing prices as not that important. Instead, Strongholds are equipped with:
►Daily High & Low • Azure color
►Weekly High & Low • Dark blue
►Weekly old High & Low • Semi-transparent dark circles
►Monthly High & Low • Wizardly purple
There is an option to print:
►4h High & Low • Semi-transparent red
►VWAP • Lovely purple
►Weekly VWAP • Black
All of the levels and lines are set for 1m, 5m, 10m, 15m, 30m, 1h, 4h, 1D timeframes. If you use any alien timeframe, you may need to enter the code.
You can opt-in and out for certain timeframes. For example, daily levels are visible from 15m or 30, so the indicator won't draw them unless you want to. However, they will not be seen on higher timeframes as there is no reason to show them and oversaturate the chart with lines.
▬▬▬▬▬▬▬▬▬▬▬▬▬▬▬▬▬▬▬▬▬▬
Remember that if you use this script with auto-scale, you need to tick Scale Price Chart Only . Otherwise, your chart will fly to the moon!
Good luck & have fun!

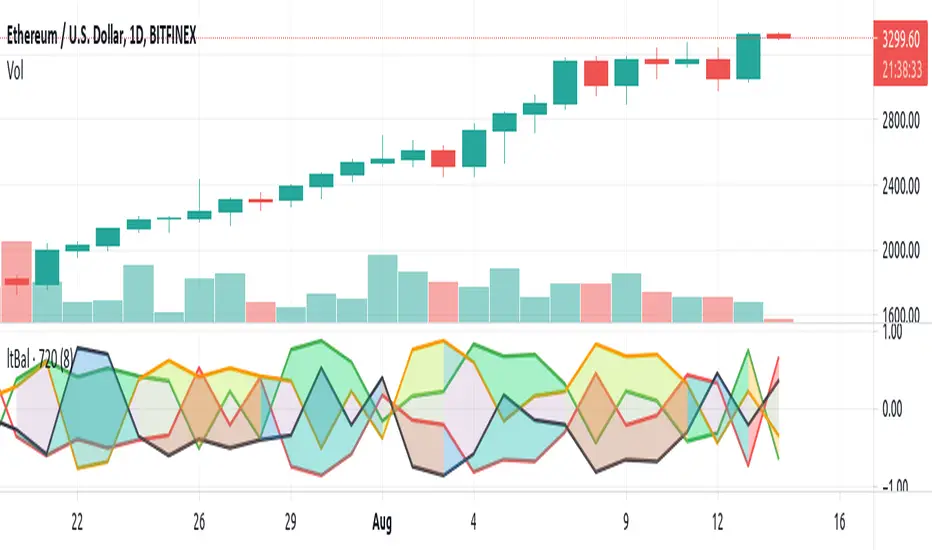
TSI Strength Meter vs USD with divergenceThis indicator consists of two lines. One is a gray line (USD) and the asset indicator is green or red.
The basis of this indicator is the true strength indicator (TSI) with parameters 5,15. Both line sets are based on a TSI (5,15).
The lookback period is for new highs / new lows. Default value is 200 periods.
GREEN/RED LINE
The first that is green and red is whatever you choose to display ( BTC in this case).
The green and red lines indicate going up or going down.
GRAY LINE
The gray line is the US Dollar . So everything is relative to that by default.
ZERO LINE CROSSES
These are momentum shifts. If you see a crossover of both around the zero line, its a good indication there is a change in momentum and a reversal of trend.
NEW HIGHS NEW LOWS
There are 4 new colors added to this indicator. For the asset you are viewing, a lime color means new highs within the lookback period. A new low is indicated by a yellow line color.
The new lows for the USD are white for new lows within the lookback period and blue line for the new highs.
DIVERGENCE
You can also spot divergences easily. For example, if a lime color is seen on the indicator line, that means "new high" but if it occurs below the last "new high" it means the asset is going up to new highs but the indicator is showing us that the readings are below the previous new highs, indicating a negative divergence.
The same goes for the yellow colored lines. higher yellows mean positive divergence.
And with the US Dollar , blue lines dropping means a negative divergence in the US Dollar , while white lines moving up means a positive dollar divergence.
INTERPRETATION
Examples:
If you see a green and sometimes red line of the asset indicator and a gray line that drops below the zero line; it may mean the asset is rising and the trend is up.
If you see a green and red line below the zero line and with a gray line above the zero line , it indicates there is a negative trend. If you suddenly see blue lines on the USD, this means its hitting new lows. If these blue lines then start to slowly move downwards; then we have a positive divergence. If that were to be followed by the green line crossing the zero line, its a pretty good be that the trend is changing and its a very good buying oportunity.

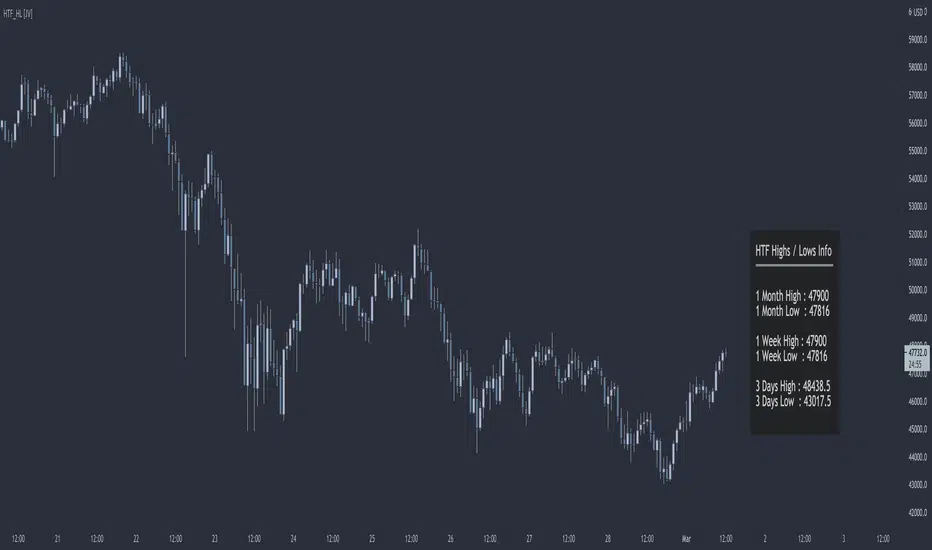
HTF Highs Lows [JV]█ OVERVIEW
This script presents a label with an overview of higher timeframe highs and lows. This can be useful information as we all know that price likes to revisit previous highs and lows area, specially on the higher timeframe.
█ CONCEPTS
This information can be relevant and valuable for various reasons:
Finding horizontal Support and Resistance
Get a better view on Market Structure
Provide some information about Order Flow
TrendLines
...
█ FEATURES
Plots
This script provides the option to show information about 3 timeframes
Each timeframe can be separately shown or hidden
The Y position of the info label can be user defined, based on high or low of the chosen timeframe
The X offset of the info label can be adjusted to the user's liking and the chart resolution
The label color and text color can be user defined
The info label's size can be user defined
█ NOTES
Caveat
The timeframes must be chosen in order of size. Meaning that the highest timeframe should be on top. This is title as such on the info label, but I want to mention it again as it's something to pay attention to.
Repainting
The question that pops up all the time is: Does it repaint ?
I will quote PineCoders on this:
We're pretty sure Wilder was not asked very often if RSI repainted. Why? Because it wasn't in fashion—and largely unnecessary—to ask that sort of question in the 80's. Many traders back then used daily charts only, and indicator values were calculated at the day's close, so everybody knew what they were getting. Additionally, indicator values were calculated by generally reputable outfits or traders themselves, so data was pretty reliable. Today, almost anybody can write a simple indicator, and the programming languages used to write them are complex enough for some coders lacking the caution, know-how or ethics of the best professional coders, to get in over their heads and produce code that does not work the way they think it does.
Briefly: yes, it repaints and no it does not matter.
Simple because we are working with highs and lows on a higher timeframe. So if we get a new high or low within a certain time frame, we want this new high or low to be displayed and, for me, it's not relevant if this information appears when it happens or when the candle closes.
Questions & Suggestions
Questions, suggestions or even a word of thanks are always welcomed in the comments section. I usually answer within the same day.
█ THANKS
A word of thanks to, and I hope I am allowed to use hyperlinks here, LonesomeTheBlue for being an inspiration on coding style and his work on arrays in Pine Script and to lmatl for his support, words of advice and letting me borrow his brain now and then.
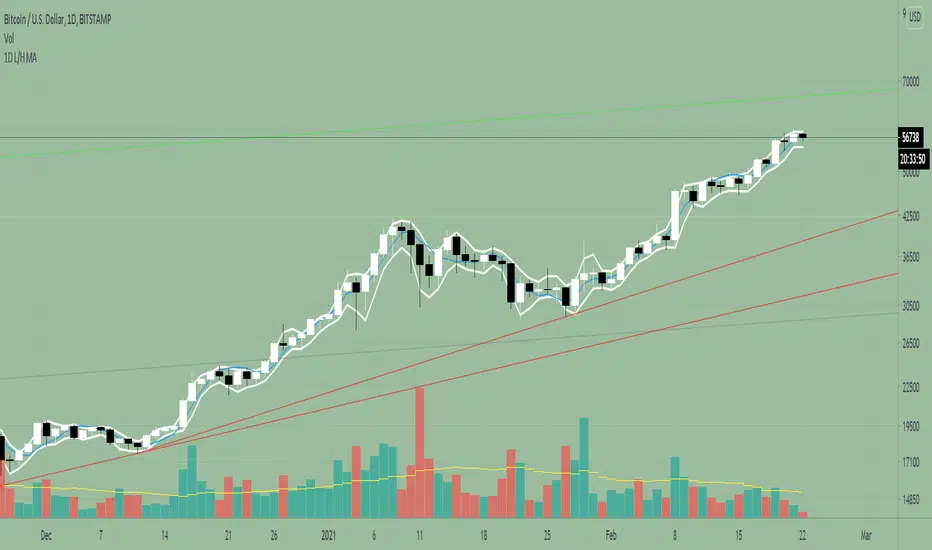
1D Low/High MA + Least Square Mean (3 indicators in 1)This indicator is a combination of 3 public indicators being:
* a standard Simple Moving Average with the source as the candle low & length of 2
* a standard Simple Moving Average with the source as the candle high & length of 2
* the Least Square Mean with a source of high + low /2 and length of 9
This combo was inspired by Tyler Coates who crafted EMASAR.
He regularly uses the a SMA with source of Low / High and length of 2 for defining trading daily ranges as well as the Least Square Mean for calculations in the his trading which he teaches via youtube.
I hope this indicator will reduce time spent on setting up charts.
NSDT Daily Key LevelsSimple script to show key levels of current day and previous day. Labels can be turned on and off as needed. Line colors, thickness and style can be changed. Modified the "M/W/D Level" script from paaax. Credit for original code goes to him. Link to script and profile posted in code of this script.

Daily High & Low BoundaryDisplays the day's progressive high and low of the day colorized by the day of the week.
