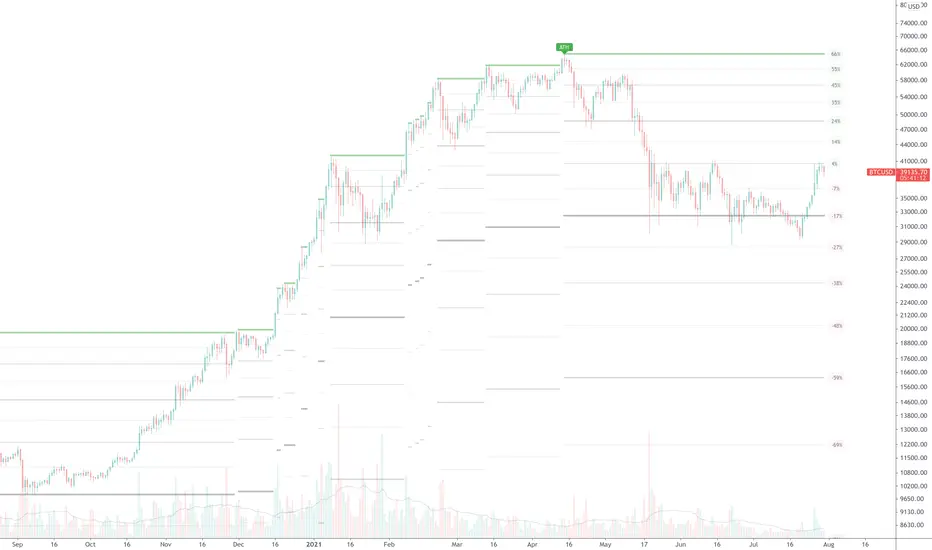
Realtime All-Time High and All-Time Low Tracker [WIP]This is a study intended to port the work of /u/QuantNomad's "Kozlod - All-time high/low alerts" to pine version 4 without giving any alerts. It is intended to capture the most extreme points on any given price chart in real time, the absolute high and absolute low points. Ideally, the plotted lines would strictly diverge from one another in opposite directions and widen with new highs or lows on a hypothetical "all-time" resolution.
Most of the original code was replaced and I'm trying to resolve a bug where the script fails to register new highs or lows while at the same time making sure that earlier data is plotted correctly. If applied to an asset that has not yet recovered , is just too new, or has not achieved a lower low than its opening price, this indicator ceases to function correctly. This would not be an issue if pine script was more general purpose and had something similar to Python's max(list) function.
Any and all suggestions are welcome. This is simply to serve as a springboard for any programmers trying to design algorithms or strategies that use these variables on any price chart.
Happy Hunting!
- Patch Hemlock
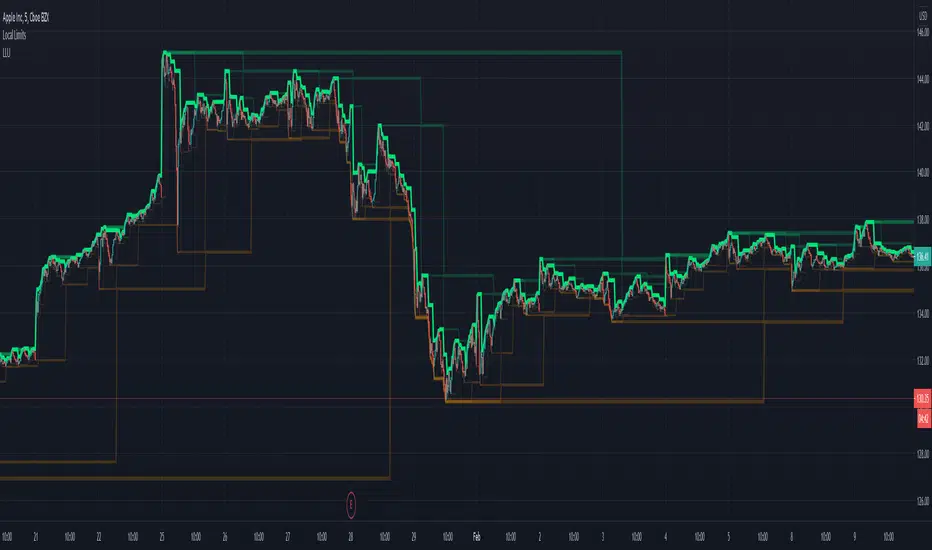
High

Local Limit UpperDisplays recent higher and lower highs.
In it's simplicity is a lot more powerful than might appear at first glance.
Does not rely on volatility calculation.
Can be linked together to create an objective view of recent resistance levels.
Makes current trends more visible.
Excellent as a trailing stop (short) algorithm.
Can be used with its sibling: Local Limit Lower
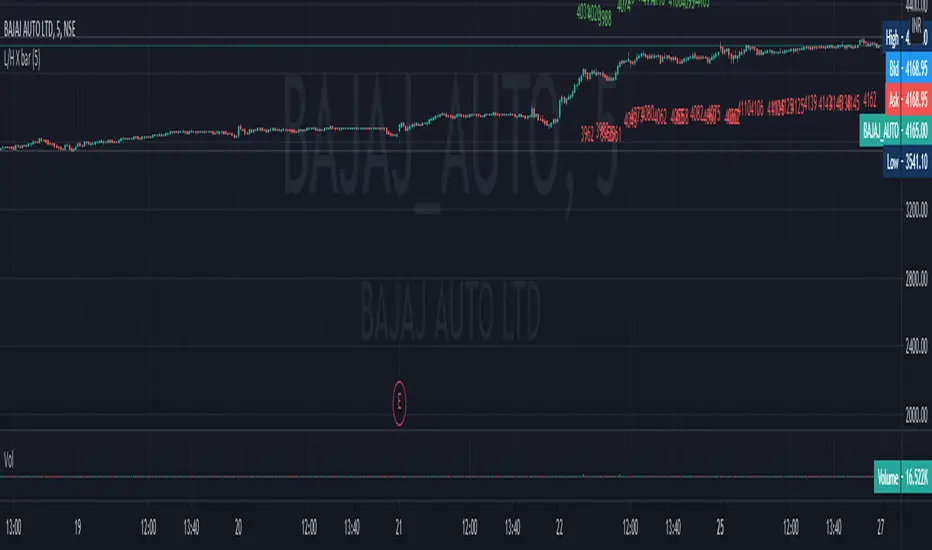
low and high X Bars//This script finds High and Low X bars back. Simple pine script, can customize lookback period.
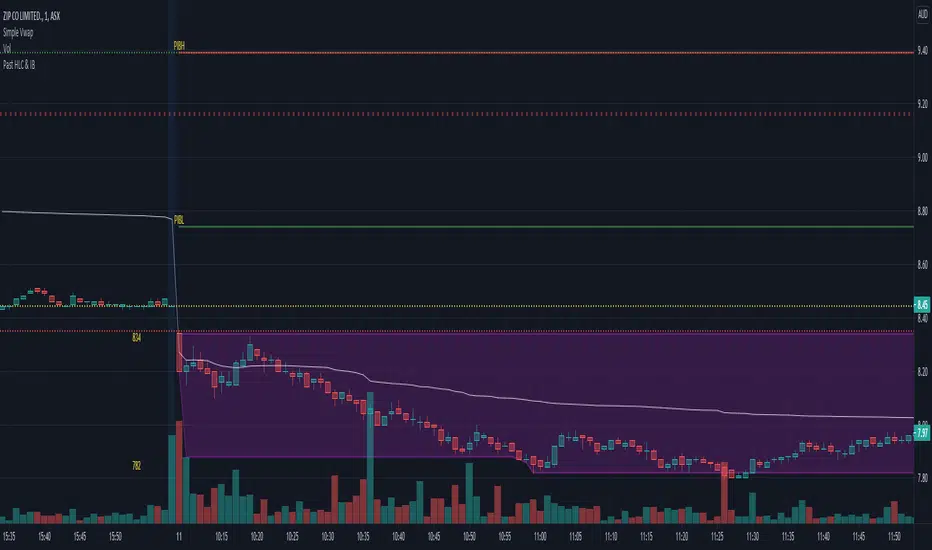
Initial Balance (IB) and Previous Day / Week High, Low & ClosePlots Historical key levels for volume profile idea.
Plots the following:
- Previous Day High
- Previous Day Low
- Previous Day Close
- Previous Day IB High
- Previous Day IB Low
- Current Days IB High
- Current Days IB Low
IB is based on first hour of trading.
Made specifically for ASX stocks, have not tested it on other exchanges or assets.
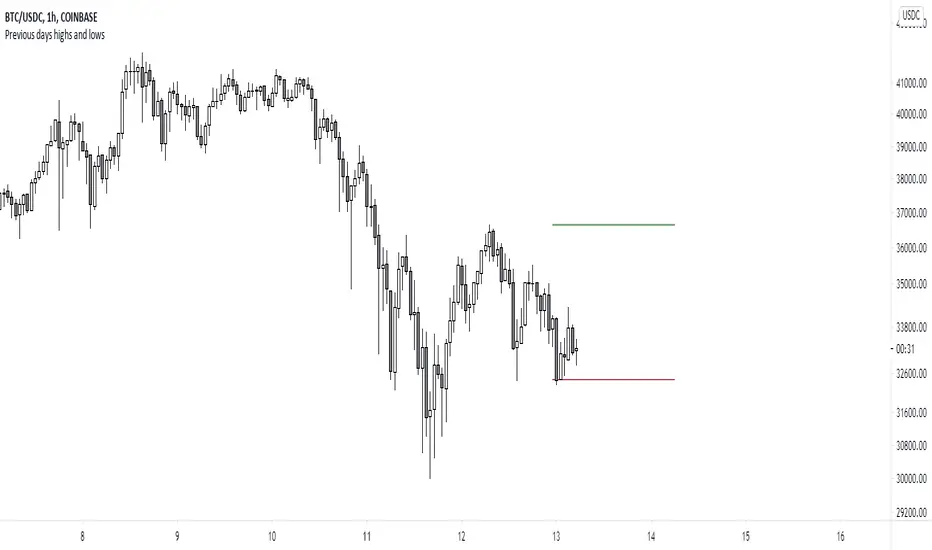
Previous days highs and lowsA script which marks a line pointing the highs and lows of the previous trading day.
Day start top and bottomThis code is modified to draw the first 15 minutes(variable in setting by default 15m is set) of the high and lows through out the day.
It will work on time frames less than than or equal to 1st input. Hope this code helps you all.
IMPORTANT SETTING DETAILS:
1.Res = input(title="Starting X minutes lines to be Displayed",defval="15", type=input.resolution)
2.Day_start_15m=input("0915-0930",title="your country's Trading session time (starting X minutes)")
make sure to enter the starting 15 min of your country trading time in the input in 2nd input
both the above input 1 and 2 must be equal in time i.e "0915-0930"=15min and first one is also 15m
you need to make sure that the input settings are correct. It is By default set For INDIAs trading start time, you have to set start time according to your country.

Rabbit HoleHow deep is the Rabbit hole? Interesting experiment that finds the RISING HIGHS and FALLING LOWS and place the difference between the highs and lows into separate arrays.
== Calculations ==
In case current high is higher than previous high, we calculate the value by subtracting the current highest high with the previous High (lowest high) into array A,
same method for the lows just in Array B.
Since we subtract highs and lows it means velocity is taken into consideration with the plotting.
After adding a new value we remove the oldest value if the array is bigger than the Look back length. This is done for both lows and highs array.
Afterwards we sum up the lows and highs array (separately) and plot them separately, We can also smooth them a bit with Moving averages like HMA, JMA, KAMA and more.
== RULES ==
When High Lines crosses the Low Line we get a GREEN tunnel.
When Low Lines crosses the High line we get the RED tunnel.
The Greenish the stronger the up trend.
The Redish the stronger the downtrend.
== NOTES ==
Bars are not colored by default.
Better for higher time frames, 1 hour and above.
Enjoy and like if you like!
Follow up for new scripts: www.tradingview.com

High Low Rate Of ChangeAn experimental indicator using Pine Script Arrays. The indicators measures the rate of change of the highest highs and lowest lows. I call it the "High Low Rate of Change".
The H/L Rate of Change indicator finds the delta between the current highest high and previous highest high and after some filtering places these values into an array.
Same goes for the lowest lows.
In the end Sum it all up into the Histogram with optional smoothing using Exponential moving average (EMA).
==Colors==
Green: Up Trending.
Light Green: Weakening up trend.
Red: Down Trending.
Light Red Weakening Down Trending.
==Notes==
Bar colors are disabled by default.
Supports EMA smoothing (enabled by default).
Like if you Like and Enjoy!
Follow up for upcoming indicators: www.tradingview.com

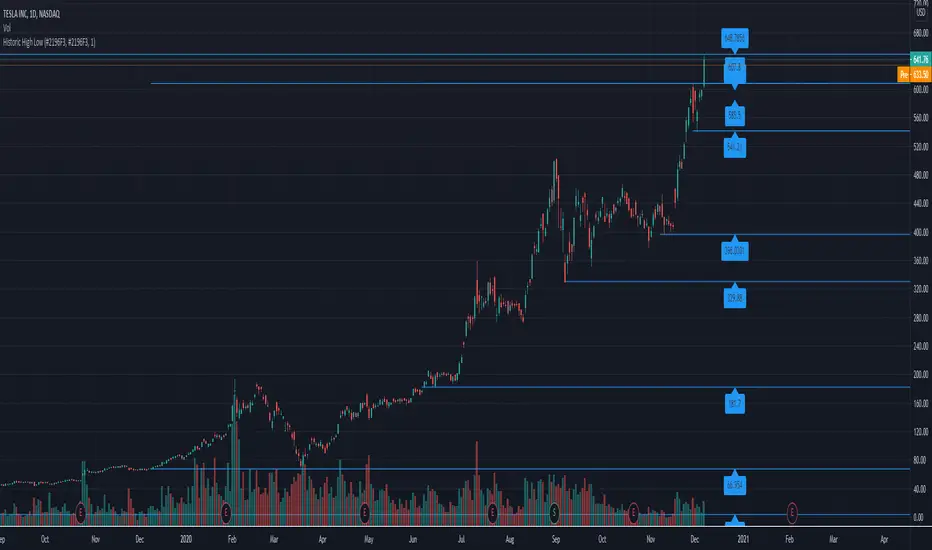
Historic High Lows AdaptiveThis will plot in the ticker opened:
-All-time High and Low
-1 Year High and Low
-6 Months High and Low
-3 Months High and Low
-1 Month High and Low
-1 Week High and Low
-Previous day High and Low
Colors, extending the line to the right, width, showing price tag are all parameters.
High and Low calculations are updated daily
Lines haves issues sometimes rendering when the candles are in a period too small.

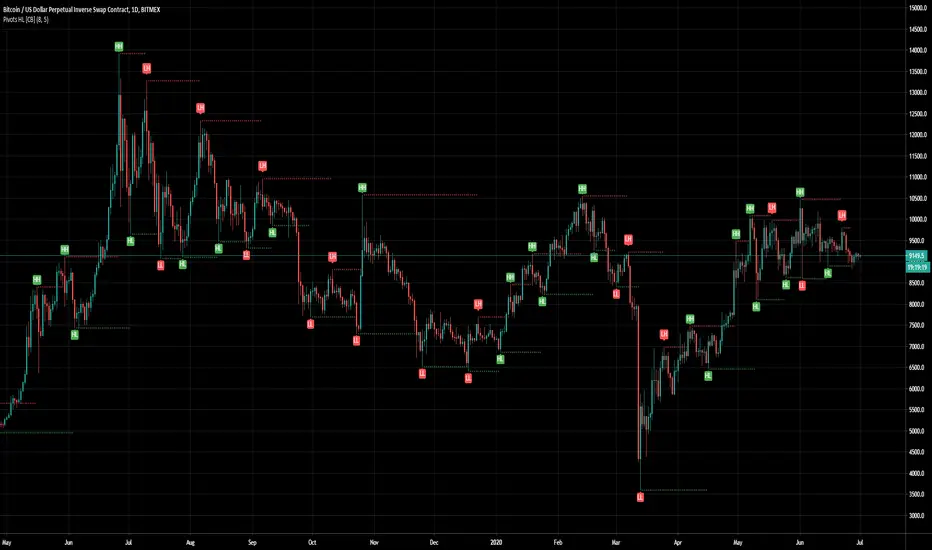
Pivots High Low (HH/HL/LH/LL)/Trend [Anan] Hello Friends,,
This is pivot points high low with pivot trend to define the trend direction.
Pivot trend is the pivot points average.
Options:
- Pivot Point Period
- Show/hide Pivot Points Labels
- Show/hide Bull/Bear Labels ( depends on pivot trend)
- Show/hide Pivot Center Line (Bull>Center, Bear<Center)
- Show/hide Support/Resistance Level Extensions
- Show/hide Fractal Break Arrows (you can set alerts as well)

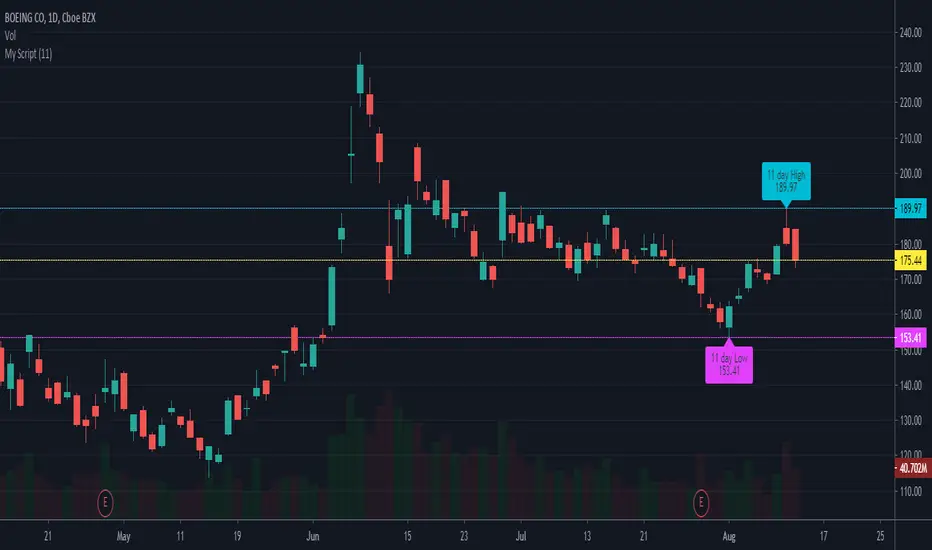
Session High and Session LowI have heard many people ask for a script that will identify the high and low of a specific session. So, I made one.
Important Note: This indicator has to be set up properly or you will get an error. Important things to note are the length of the range and the session definition. The idea is that you would set it up for what's relevant to your trading. Going too far back in the chart history will cause errors. Setting the session for a time that is not on the chart can cause errors. If you set it to look farther back than there are bars to display, you may get an error. What I've found is that if you get an error, you just need to change the settings to reflect available data and it will be able to compile the script. At the time of its publishing, the default range start is set to 10/01/2020. If you're looking at this years later, you'll probably have to set the range to something more recent.
Features:
Plot or Lines:
Using Plot (displayed), the indicator will track the high/low from the end of the session into the next session. Then at the start of the next session, it will start tracking the high/low of that session until its end, then track that high/low until the start of the next session then reset.
Using lines, it will extend horizontal lines to the right indefinitely. The number of sessions back that the lines apply to is a user-defined number of sessions. There are limits to the number of lines that can be cast on a chart (roughly 40-50). So, the maximum number of sessions you can apply the lines to is the last 21 sessions (42 lines total). That gets really noisy though so I can't imagine that is a limiting factor.
Colors:
You can change the background color and its transparency, as well as turn the background color on or off.
You can change the highs and lows colors
You can adjust the line width to your preference
Session Length:
You can use a continuous session covering any user-defined period (provided its not tooooo many candles back)
You can define the session length for intraday
You can exclude weekends
Display Options:
You can adjust the colors, transparency, and linewidth
You can display the plotline or horizontal lines
You can show/hide the background color.
You can change how many sessions back the horizontal lines will track
Let me know if there's anything this script is missing or if you run into any issues that I might be able to help resolve.
Here's what it looks like with Lines for the last 5 sessions and different background color.

Yesterday's open, high, low and closeA very simple script to plot the yesterday's OHLC, to be used in an intraday graph.
There were other scripts like this, but their code was ugly, filthy, smelly, and WET, so I did this.

Low - High Simple TrackerYet another "Low - High" indicator using the new Pine Script Arrays.
The indicator uses the latests Lows and Highs to plot a trend line and reversal/slowdown.
More detailed explanation inside the script.
Enjoy!
Green - Up Trending
Red - Down Trending
White - Slow Down/Reversal might occur.
Made for educational purposes of how to use Arrays, yet can be very useful.

Highs Lows and OpensThis script is an update to a lovely script by BURSATRENDBANDCHART
There original script gave Daily, Weekly and Monthly Highs but I loved the format
I required
Previous Days Highs and Lows
Previous Week High and Low
Previous Day Open
Previous Week Open
Hope this can be of use

Derivative Pivot HL Points Hello.
This script aims to take into account mutable variable Pivot Points' periods.
While doing this, it takes the period between 2 signals that I use in the script:
And these periods in my Pivot HL function integrated into len length (Mutable variables) :
The cornerstone of the script is these facts.
Pivot can be optimized by playing with reversal periods.
These pre-formed levels can be used as Supply and Demand levels.
Regards.

Pivot Points [CB]Automatically label pivots as HH/LH and HL/LL.
The criteria for determining pivot points can be configured.
[PX] Session LevelHello guys,
this scripts prints the high and low as well as the moving average of a user-defined session.
How does it work?
Basically, as soon as we are in the session range, the indicator will constantly keep track of the high and the low of this range. It also prints the moving average, which can either be a floating or a static line, that represents the latest MA value.
The indicator comes with multiple options to style the printed lines.
If you find this indicator useful, please leave a "like" and hit that "follow" button :)
Have fun and happy trading :)))
P.S: Check my signature if you want to get in touch with me.

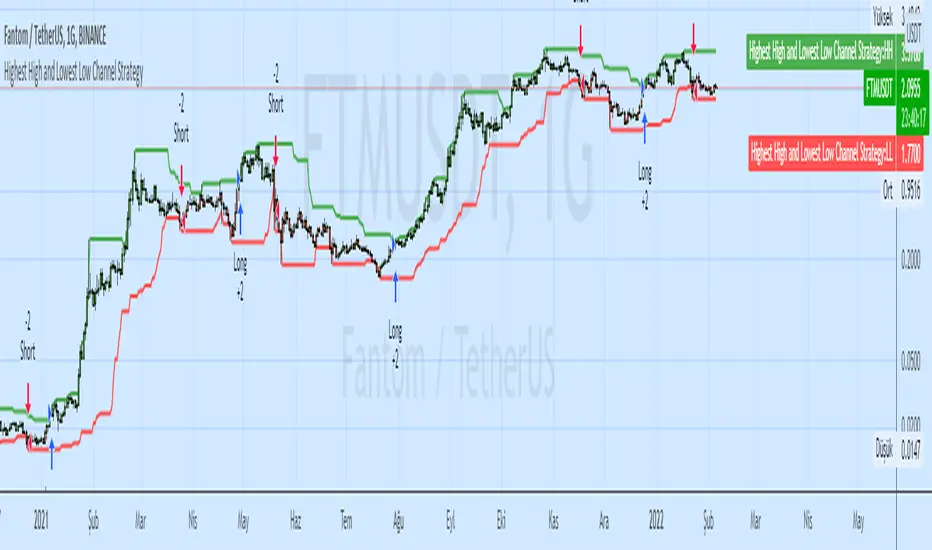
Highest High and Lowest Low Channel StrategyHighest / Highest High Highest (Data) - HHV (Data, Period)
Lowest / Lowest Low Lowest (Data) LLV (Data, Period)
These functions calculate the highest / lowest value of a selected data.
Highest High and Lowest Low options are mostly used.
The Highest function calculates the highest value of the selected data in the past.
The Lowest function calculates the lowest value of the selected data in the past.
Fractals | Swing Points | Highs & Lows | Custom PeriodsSimple script which marks out key swing highs & lows.
One of the only indicators I have on the chart most days
- perfect for naked charting
- quickly helps you to visually identify key areas of interest
An extension of Bill Williams fractals
- aka short term swing points
Allows you to filter for only the most prominent swing points
- you can even overlay multiple swingpoint filters in different colours (as per example chart)
The number ( Fractal Periods) is simply:
- the number of less prominent points either side of your swing high/low
- example shown on the chart
Otherwise make a fist
- look at your 5 knuckles
- swing high is your middle knuckle
- 2 lower points either side
Bill Williams Original Fractal:
Fractal Periods = 2
Your Fractal Period for Filtering:
3, 4, 5, 30, 365, etc
Allows you to find swing points down to:
Fractal Periods = 1
Simple, easy, shared to enjoy =)

Stochastic RibbonA series of highs and lows of different lengths to create a ribbon-like indicator to emulate the stochastic oscillator's top (100), middle (50) and bottom (0). Traders can determine the strength of the support and resistance by the number of converging lines, choose price points and visualise momentum waves.
Inputs:
Theme: multiple colours/themes (theme 2)
Length: high/low length (14)
Start: plot number to start ribbon on (1)
PlotNumber: number of plots to show; maximum 10 per top, middle, bottom (10)
Example:
Length: 14
Start: 5
PlotNumber: 10

True ATH/ATL w/ labelsPlots the All Time High and All Time Low, with optional labels when a new ATH/ATL is created. Reaches all the way back in history for the true high/low, not limited to the most recent 5000 candles like most scripts. Works on all time frames.