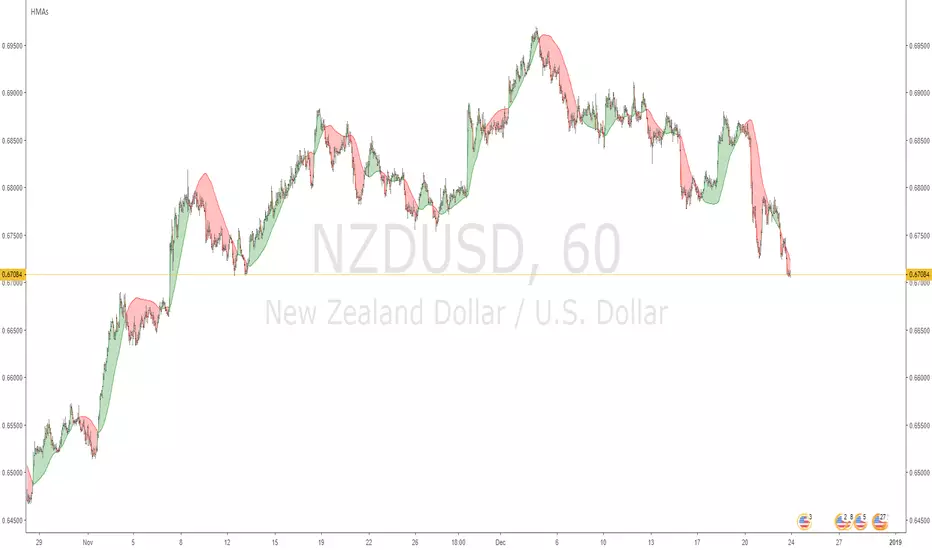
船體移動平均線(HMA)
Hull MAThis Hull MA uses the default settings of the built-in MA. The basic idea is that we are in a buy setup when hull is below price, and a sell setup when hull is above price. The indicator is extended with slightly change in contrast when moving average is declining and it plot the ma/price crossovers: green dot when a buy setup is appearing, and red dot when a sell setup is forming. It is possible to hide crossovers in the option panel.
Three alert conditions is added "Hull MA cross", "Hull MA sell" and "Hull MA buy". I use "Hull MA cross" on slow frames (2w, M) and "Hull MA buy/sell" on faster frames.

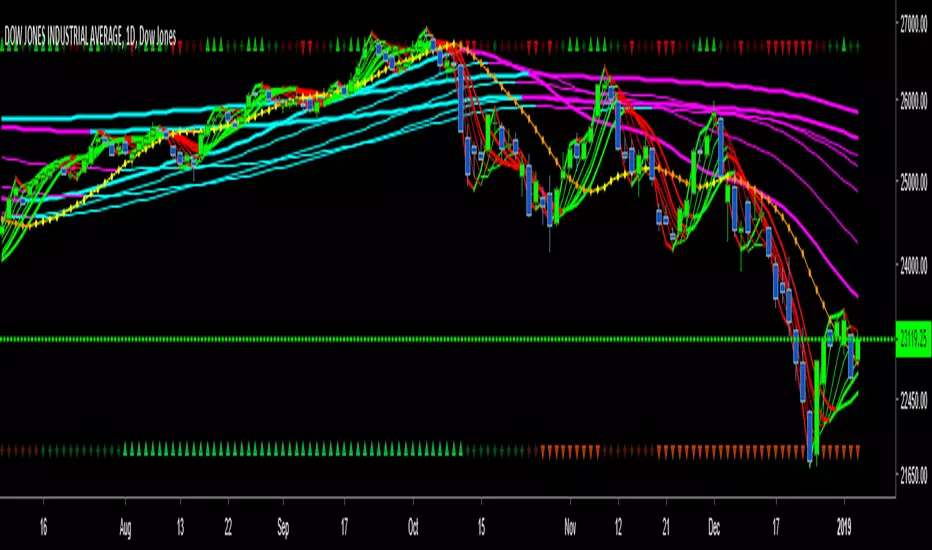
Fibo Guppy Multi MA RevisedThis is Guppy MA i customized for myself based on two scripts of GMMA from JustUncleL and NeoButane.
Its features are:
1. Besides standard EMA you can chose all kinds of exotic moving average types ike ALMA (my favorite), HullMA, ZeroLag EMA, VWMA, KAMA etc...
2. Two types of coloring scheme - depends on volatility try one that's best fit.
3. Multiple sets of predefined lengths: standard Guppy 3-60, Fibonacci based lengths 3-610, Fibo 5-987 and Custom (user defined lengths)

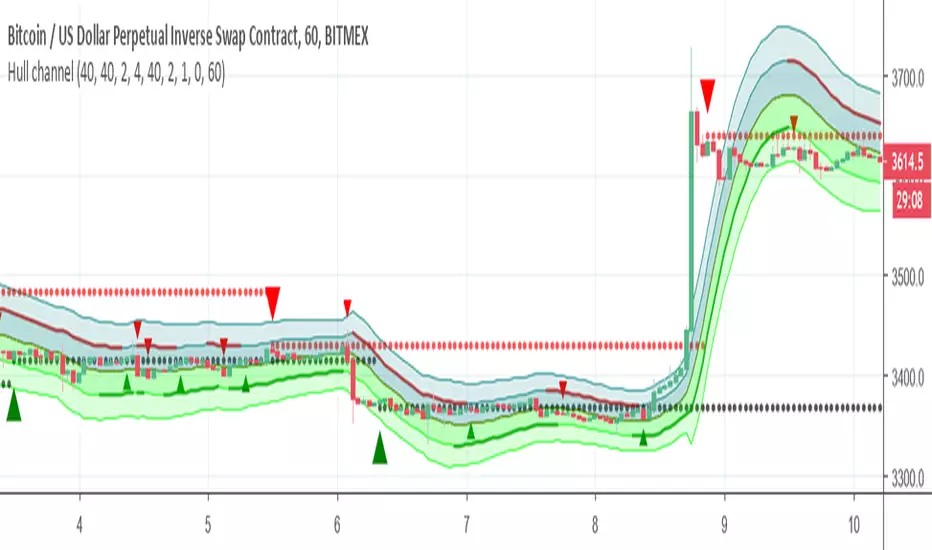
Hull channelThis Hull based channel , the resistance and the support based on Hull which also can be calculated as signal (big triangle) and represent by circles (red and black)
the channel has bands that are based on ATR and std (2 or 4) you can change as you like
The small arrow in green and red are the slope calculation (this also has signal and alerts)
there is bullish and bearish zone that you can highlight to see where you are according to slope
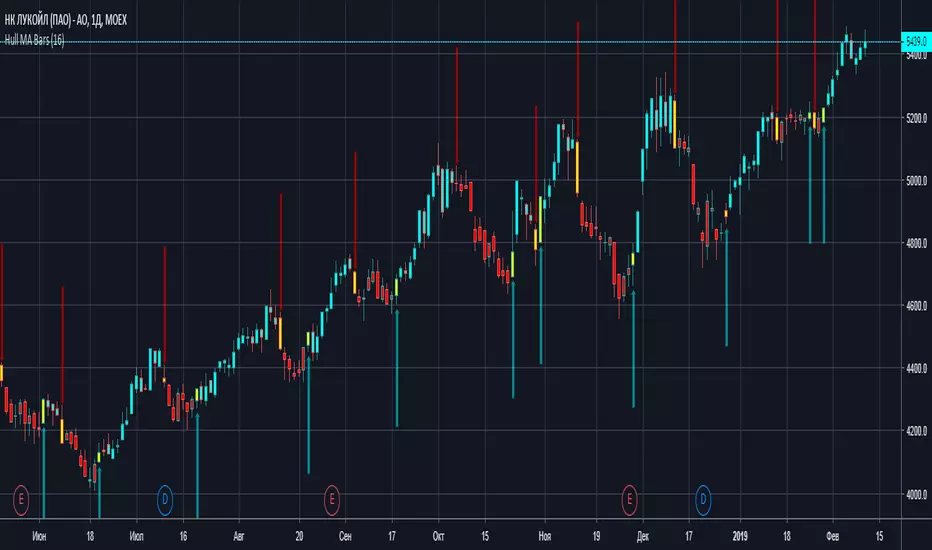
Hull MA BarsThis indicator fill bars with color of HullMA + warning yellow bars, then trend reversing
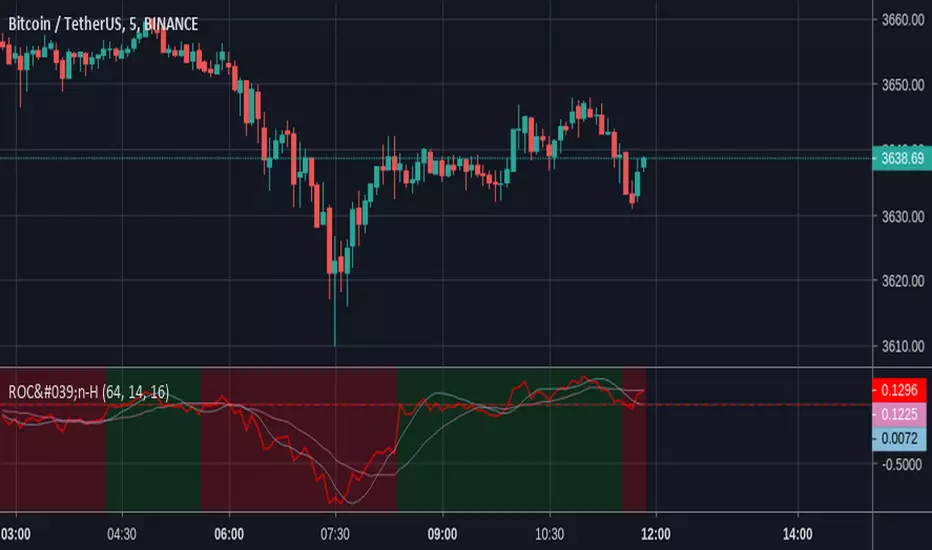
ROC'n-H is a ROC indicator with dynamic length From Investopedia "The Price Rate of Change (ROC) is a momentum-based technical indicator that measures the percentage change in price between the current price and the price a certain number of periods ago.
The ROC indicator is plotted against zero, with the indicator moving upwards into positive territory if price changes are to the upside, and moving into negative territory if price changes are to the downside."
In this script, ROC length (the moment from when ROC is calculated) is set by detected trend change.
Trend change is marked by indicators background colour.
"Trend Lenght" - Adjust this to fit the security and time frame
"SMA" - Simple Moving Average
"MHA" - Hull Moving Average
Feedback for improvements are welcome.
Hull MA & Warning Zones & Buy/Sell ArrowsThis moving average, in contrast to the standard, shows a slowdown of the current trend - it draws additional zones of yellow color. These zones show a possible trend reversal by 1-2 bars earlier than the standard Hull moving average. Additionally, there are arrows to enter a position and the second is the same MA for another timeframe, which can be selected in the settings.

CryptoCoyns HullMA [v2018-12-10]CryptoCoyns Hull Moving Average
This indicator implements the Hull moving average.
The Hull Moving Average (HMA), developed by Alan Hull, is an extremely
fast and smooth moving average. In fact, the HMA almost eliminates lag
altogether and manages to improve smoothing at the same time. A longer
period HMA may be used to identify trend. If the HMA is rising, the
prevailing trend is rising, indicating it may be better to enter long
positions. If the HMA is falling, the prevailing trend is also falling,
indicating it may be better to enter short positions. A shorter period
HMA may be used for entry signals in the direction of the prevailing trend.
The Source for price can be defined. i.e. Close, Open, High, Low, etc.
The period length used can be defined.
MA Line colour is fully configurable.
If you get some value out of this indicator please consider making
a small donation to my favourite charity the Save the Childrens Fund.
Every donation will make a difference to the lives of children.
All donations over $2 are tax deductable. You can donate here:
savethechildrenfundraising.org.au
Copyright (c) 2018, Grant Cause aka CryptoCoyns

HullDEMA MTFThis indicator based on non repaint HULL 720 min and dema MTF
i suugest to keep the Dema MTF on the time frame of your graph
using the HULL 720 min we can see how the signal of DEMA and the crossing of the hull 720 either by DEMA or by the candels
this enable us to detect trends more easy

Multiple Moving Average Colors7 moving averages in 1 indicator, including the Hull Moving Average.
I've updated with some graphics that print at the top of the chart (you can change color and placement on the indicator settings page)
All 7 MAs Up - Green and up triangle
All 7 MAs Down - Red and down triangle
4, 5 or 6 MAs Up - Dark green and a square
4, 5 or 6 MAs Down - Maroon and a square

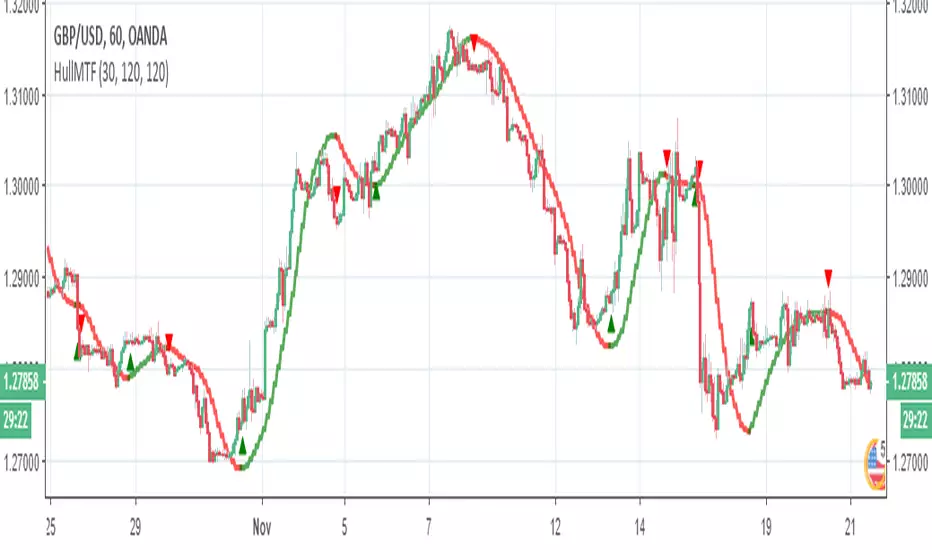
Hull Moving Averages2 Hull Moving Averages
Alan Hull developed Hull Moving Average in 2005 in his quest to create a moving average that is "responsive to current price activity while maintaining curve smoothness".
Hull claims that his moving average "almost eliminates lag altogether and manages to improve smoothing at the same time".
4 Hull MAThe Hull Moving Average (HMA) was developed by Alan Hull in 2005 for the purpose of reducing lag, increasing responsiveness while at the same time eliminating noise. Its calculation is elaborate and makes use of the Weighted Moving Average (WMA). It emphasizes recent prices over older ones, resulting in a fast-acting yet smooth moving average that can be used to identify the prevailing market trend. It can also be used for entry and exit signals. I have integrated 4 HMA's into one which can be used for taking entry and exits similar to 4 EMA strategies. All credit goes to Alan Hull for developing this technique.

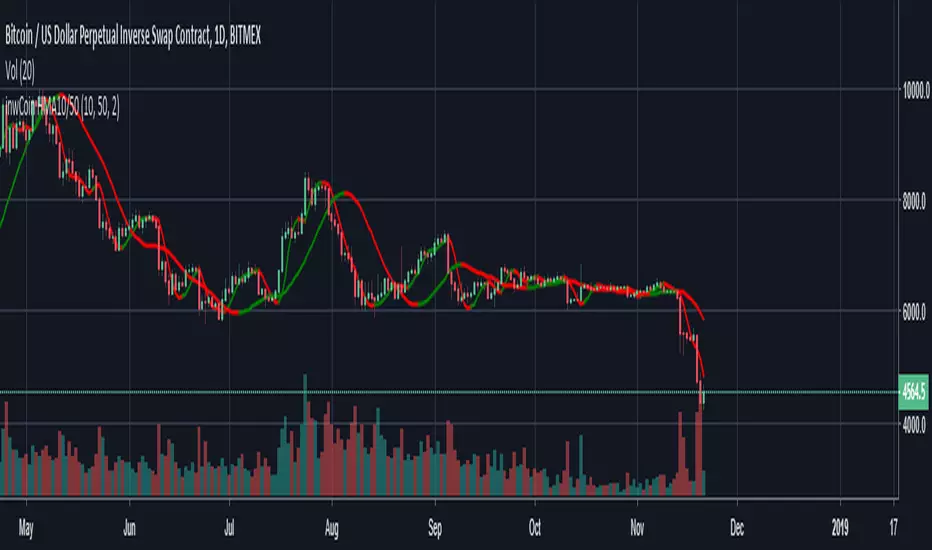
inwCoin HMA10/50Just simple HMA 10/50 with color change when trend change ( Red = downtrend / Green = uptrend )
Hull50Signals are based on Hull 50 length
You can change the length if you want it to buy more or less
have fun

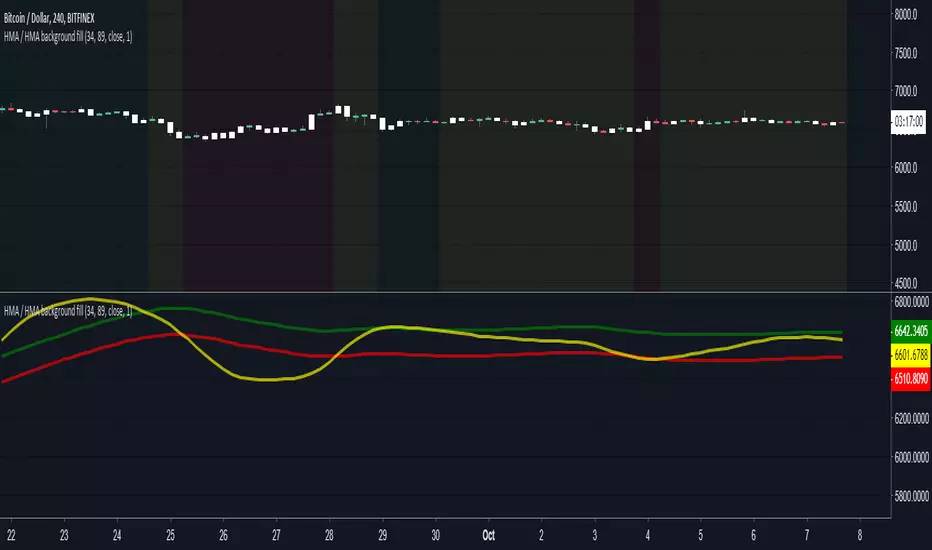
HMA + HMA + Dispersion background fill (ver 2.0)fast HMA • slow HMA • Dispersion Zone| background color's
---
Background colors: Red, Green and Yellow. Default transperent = 5%
• Green background: fast HMA above the dispersion zone
• Red background: fast HMA below the dispersion zone
• Yellow background: fast HMA inside the Dispersion Zone
---
# Alerts only for cross Yellow to Green and Yellow to Red zones.
---
• The dispersion zone is calculated relative to the slow HMA.
Fast - Slow HMA background fillfast HMA • slow HMA | background
---
Background colors: Red and Green. Default transperent = 2%
• Green background: "fastHMA" crossover "slowHMA"
• Red background: "fastHMA" crossdown "slowHMA"

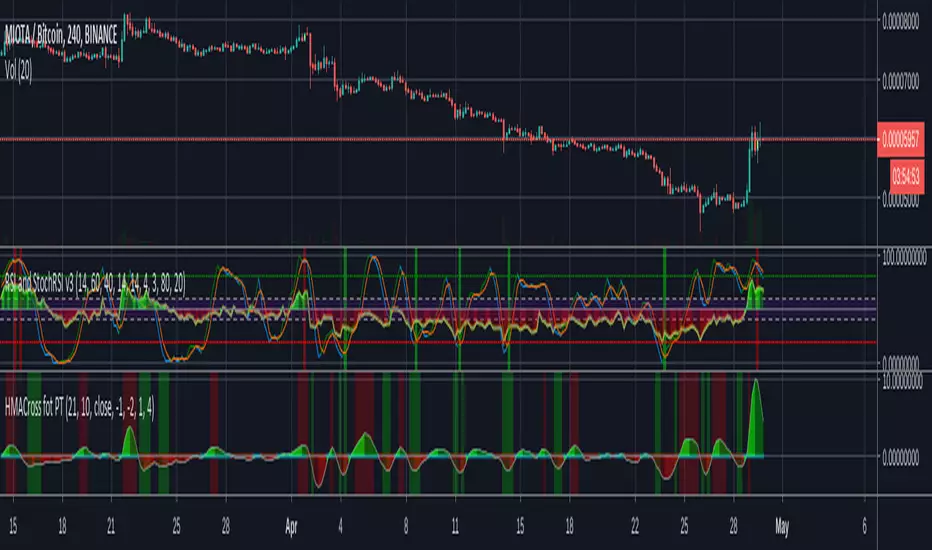
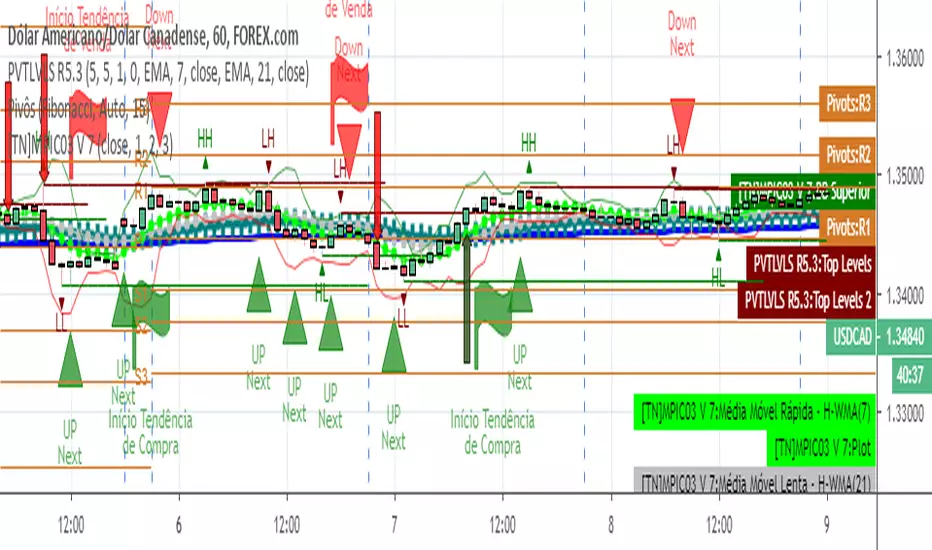
Hullfib-trailingso I add a trialing function based on volume pf the bars
this will ,ake the system more easy for the trader
1. Hull mean avreage with color changes (green -red that show the trend )
2. signal prouduce by Hull and bollinger fibs
3.signal prouduce by trailing volume bars (B , S)
4. upper and lower daily fibs
togetther you can make good combination when you bet on bitmex
have fun


Reap Hull SMA CrossoverHi this is my first script, it is a HMA 144 crossover with SMA 5 changes background (still needs work), provides alerts for crossover
