[TTI] Price confirmation indicator📜 ––––HISTORY & CREDITS––––
The Price Confirmation Indicator is an innovative tool developed by TintinTrading to help his students learn to interpret Price + Volume moves. It is designed to provide traders with a visual cue for price movement confirmation based on both price direction and trading volume. I got the idea from watching Daivd Ryan, how he explains that he looks at volume first before looking at the price of a stock.
🦄 –––UNIQUENESS–––
What sets this indicator apart is its dual analysis approach and easy interpretation: it not only evaluates price movements but also takes trading volume into account. The indicator's color-coded bars are dynamically adjusted based on the volume difference from a 50-day Simple Moving Average (SMA) of the volume. This offers traders an intuitive way to gauge both the market's direction and its strength.
🛠️ ––––WHAT IT DOES––––
The Price Confirmation Indicator performs the following functions:
👉Price Movement: Determines whether each trading day is an 'Up Day' or a 'Down Day' based on the closing price.
👉Volume Analysis: Calculates the 50-day SMA of trading volume and identifies the volume difference in percentage terms.
👉Transparency Adjustment: Dynamically adjusts the transparency of colored bars based on the volume difference.
👉Bar Coloring: Colors the bars blue for 'Up Days' and purple for 'Down Days', with the transparency indicating the strength of the volume.
Transparency Tresholds:
Full color (no transparency 0%) - Volume is greater than 40% compared to the 50DSMA Volume
Strong color (little transparency 20%) - Volume is between 20% and 40% greater than the 50DSMA Volume
Noticable color (moderate transparency 40%) - Volume is between 0% and 20% greater than the 50DSMA Volume
Negligable color (strong transparency 60%) - Volume is light and is less than 50DSMA Volume with less than 20% lower.
Weak color (very strong transparency 80%) - Volume is below 50DSMA, with between 40% and 20% lower.
Very weak color (max transparency 90%) - Volume is below 50DSMA, with between -40% and -80% lower.
Alarming weak color (color is orange) - Volume is noticably light - this generally signals velocity contraction before a breakout.
💡 ––––HOW TO USE IT––––
Installation: Search for " Price Confirmation Indicator" in TradingView’s indicator library and add it to your chart.
Settings:
Price Up Color: Customize the color for 'Up Days'.
Price Down Color: Customize the color for 'Down Days'.
Interpretation:
Blue bars signify 'Up Days', and their transparency indicates the strength of the volume.
Purple bars represent 'Down Days', with transparency again indicating volume strength.
Orange bars signify extremely low volume days.
Volume Transparency: The less transparent the bar, the stronger the volume, aiding in confirming the price direction.
The indicator is a great tool for newer traders to get in the habit of reading Price & Volume together!
Ibd

[TTI] Closing Range Indicator📜 ––––HISTORY & CREDITS––––
This Pine Script Utility indicator, titled " Closing Range Indicator," is designed and developed by TintinTrading but inspired by the teaching of Investor's Business Daily (IBD) and William O'Neil. It aims to help traders identify the closing range of a given timeframe, either daily or weekly.
🦄 –––UNIQUENESS–––
The unique feature of this indicator lies in its ability to simulate a functionality of Closing Range calculation based on hovering of the mouse over the close. It employs a conditional display that allows the user to set the indicator as 'invisible' without removing it from the chart and hence provides a numerical closing range value when hovering over the indicator.
🛠️ ––––WHAT IT DOES––––
The Closing Range Indicator calculates the closing range of a trading bar in terms of percentages. It computes the difference between the closing price and the low price of the bar, and then divides it by the range of the bar.
A stock that closes on the high would display 100%
A stock that closes on the low would display 0%
Generally, the higher the percentage the more bullish the close but there are exceptions to this rule.
The indicator can operate on two timeframes:
Daily : Computes the closing range based on the daily high, low, and closing prices.
Weekly : Computes the closing range based on the weekly high, low, and closing prices. If you enable the weekly it will show the weekly close on all daily timeframes. Meaning that if the week Closing range is 54.15% on Friday, it will show the value 54.15% for all days prior to Friday from the same week.
The indicator places a label at the close of each bar, with the label's tooltip showing the calculated closing range percentage. I generally hide the label and just reference the tooltip calculation with a a hoover on top of the bar.
💡 ––––HOW TO USE IT––––
Installation: Add the indicator to your TradingView chart by searching for " Closing Range Indicator" in the indicator library.
Reorder: Reorder the indicator so that it sits as the first indicator (even above the price) on the Pane. This will make sure that you always trigger the tooltip functionality.
Go to Settings:
Timeframe: Choose between daily ('D') and weekly ('W') timeframes from the settings.
Visibility: Enable the 'Make Invisible' option if you want the indicator to be hidden.
Interpretation:
A higher percentage indicates that the closing price is closer to the high of the range, signaling bullish sentiment.
A lower percentage indicates bearish sentiment.
Tooltip: Hover over the label to view the closing range in percentage terms.

MarketSmith VolumesThe 'MarketSmith Volumes' is to be used with the 'MarketSmith Indicator' and 'EPS & Sales' in order to mimic fully MarketSmith Graphs with the maximum number of indicators allowed by a free Tradingview Plan: 3
This indicator is no more than a simple volume indicator where all parameters are already adjusted to resemble MarketSmith graphical volumes.
Also you will find integrated:
High Volumes Bars Peak :
They allow us to see peak volumes at a glance.
10-Week Average Volume :
When viewing a weekly chart, this line represents a 10-week moving average volume level. It allows you to see if the current Volume Bar of the week is above or under the average volume traded in the past 10 Weeks.
50-Day Average Volume :
When viewing a daily chart, this line represents a 50-day moving average volume level. Whether or not volume is above or below the average for a certain period could have a significant impact on your stock chart analysis.

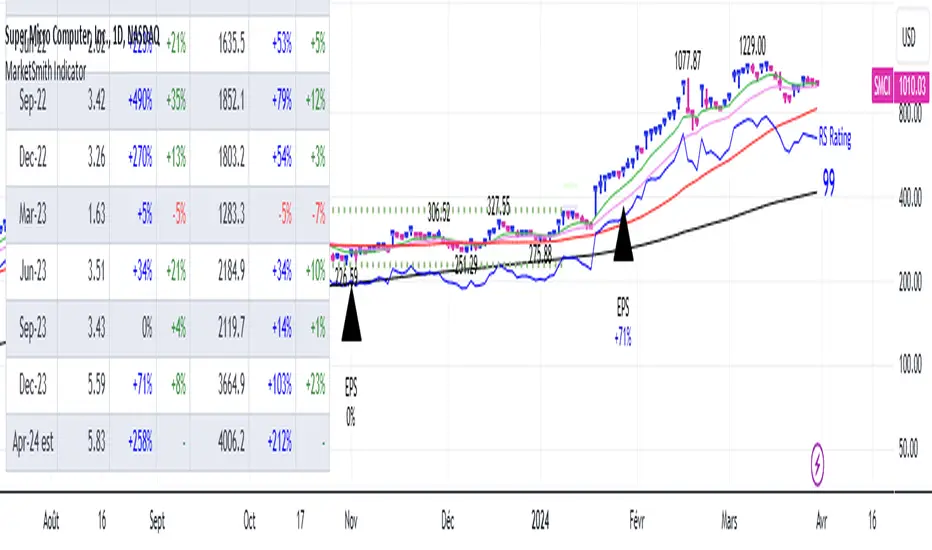
MarketSmith IndicatorThis script provides you with several indicators that will enable you to mimic MarketSmith charts, even with a free TradingView plan.
You can use this script with my ' EPS & Sales ' indicator.
MarketSmith-style bars
The script offers an original approach to managing candlesticks within the code, making them almost identical to those on MarketSmith.
For a perfect display, select ' Bars ' on your chart and set the opacity of your candles to 100% to display only the candles proposed by this indicator.
If you don't want them, you can simply disable them in the ' Style ' tab by unchecking 'MarketSmith Bars' and 'Chars'.
These candles are designed to be used with a fix chart. (No beautiful result with zooming in or out.)
Normally, the display will still be correct by right-clicking, and ' Reset Chart '.
Simple customizable moving averages
With automatic distinction of the weekly time unit. You can choose to display them or not, select the calculation method and modify their length via the panel.
The RS Rating indicator
I've integrated the RS Rating indicator into this script, as the RS Rating is a fundamental component of this layout.
High and valley points
These points are used by MarketSmith to detect bases, patterns, cup & handle.
Designed for US Market only you won't be able to screen correctly the India market for example.
MarketSmith Daily Market IndicatorsMarketSmith Daily Market Indicators is designed to mimic the Daily Market Indicators tab found in MarketSmith. This tab contains 4 different secondary indicators to help gauge the health of the overall market.
This indicator allows you to choose which of the 4 indicators to show, as well as which index to pull data from, Nasdaq or NYSE. There is also a snapshot table showing the following:
# of stock advancing and up volume
# of stocks declining and down volume
# of stock unchanged and unchanged volume
# of stocks making new highs and new lows
Now let's look at the 4 indicators and how they work.
Advance/Decline Line
Plots the number of advancing shares vs the number of declining shares. Heavily weighted index stocks can skew price action, this line helps reveal that and whether most stocks are aligned with the trend.
Short Term Overbought/Oversold Oscillator
A 10-day moving average of the number of stocks moving up in price less the number of stocks moving down in price.
10 Day Moving Average of Up & Down Volume
Two 10 day moving averages to represent the volume of all stocks. Blue line: total volume of all stocks moving up in price. Red line: the total volume of all stocks moving down in price.
10 Day Moving Average of New Highs & New Lows
Two 10-day moving average to represent stocks making new highs and new lows. Blue line: The number of stocks making new price highs. Red line: The number of stocks reaching new lows.
Note this indicator is designed to work on a daily time frame chart. Data typically updates 90 minutes after the close. Data may differ from Marketsmith due to different providers, however the general trends are the same.

Power Trend Detector [LevelUp]When a Power Trend is active, there is a stronger than usual uptrend underway. The concept of a Power Trend was defined by Investor's Business Daily, more specifically, the Market School course designed to mimic the trading style of IBD's Founder, William O'Neil.
The specifics of a Power Trend were defined by Mike Webster, Justin Nielsen and Charles Harris, while working with William O'Neil at IBD. The uptrends of the Nasdaq Composite were studied in great detail, looking for characteristics that were similar across significant uptrends. The end result was a set of rules that define when a Power Trend starts and ends.
Knowing that there is a Power Trend in play can be helpful to gauge how aggressive to be with your trades.
The price action in a major index, such as the Nasdaq Composite (IXIC), is the source for determining a Power Trend's status. Using an index is based on the definition of a Power Trend from Market School. With this indicator, in addition to indexes, it will allow an ETF (more specifically, a "fund" as defined by TradingView) to be used as the source. The reason for the latter is that various ETFs such as ARKK, which are focused on "disruptive technology," can be helpful to track trends for growth traders.
What Starts a Power Trend?
▪ Low is above the 21-day EMA for at least 10 days.
▪ 21-day EMA is above the 50-day SMA for at least five days.
▪ 50-day SMA is in an uptrend.
▪ Close up for the day.
What Ends a Power Trend?
▪ 21-day EMA crosses under 50-day SMA.
▪ Close 10% below recent high and below the 50-day SMA.
Show Power Trend Status
This indicator has two options to highlight each day of the Power Trend:
▪ Symbol over each bar.
▪ Symbol across the bottom of the chart for each day in a Power Trend.
How Does a Power Trend End?
One way for a Power Trend to end is when the 21-day EMA crosses under the 50-day SMA.
There are also "circuit-breaker" rules that result in the a Power Trend ending. For example, when the price breaks below the 50-day SMA and closes 10% or more from a recent high.
Important Notes
As designed and implemented by William O'Neil, Power Trends are only shown on a daily chart.

Flag FinderFlag Finder Indicator is a technical analysis tool to identify bull and bear flags.
What are flags
Flags are continuation patterns that occur within the general trend of the security. A bull flag represents a temporary pause or consolidation before price resumes it's upward movement, while a bear flag occurs before price continues its downward movement.
Both flag patterns consist of two components:
The Pole
The Flag
The pole is the initial strong upward surge or decline that precedes the flag. The pole is usually a fast move accompanied by heavy volume signaling significant buying or selling pressure.
The flag is then formed as price consolidates after the initial surge or decline from the pole. For a bull flag price will drift slightly downward to sideways, a bear flag will drift upward to sideways. The best flags often see volume dry up during this phase of the pattern.
Indicator Settings
Both components are fully customizable in the indicator so the user can adjust for any time frame or volatility. Select the minimum and maximum accepted limits from the % gain loss required for the pole, the maximum acceptable flag depth or rally and the minimum and maximum number of bars for each component.
Colors and what components are visible at any time are also user controlled.
Trading flags
Traders typically use flags to enter on breakouts. A breakout occurs when price moves above the left side high of a bull flag or below the left side low of a bear flag.
Alerts
The Flag Finder allows for four different types of alerts
New Bull Flag
New Bear Flag
Bull Flag Breakout
Bear Flag Breakout
Pine Script
On top of the indicator identifying bull and bear flags, throughout the source code I left notes on nearly every line to help anyone who is interested in pine script see my thought process and explain which each line of code does. This code isn't too complex, but it offers a look into many different concepts one might use when writing pinescript such as:
input groups
declaring and reassigning variables
for loops
plotshapes & lines
alerts

Webby's Tight IndicatorWebby's Tight Indicator is used to measure a securities volatility relative to itself over time. This is achieved by taking the average of three short term ATR's (average true range) and creating a ratio versus three longer term ATR's.
Mike Webster recently stated he is using the 3,5,8 for the short term ATR's and the 55,89,144 for the long term ATR's. All of the ATR lengths are part of the Fibonacci sequence.
The ratio of the ATR's is then calculated and plotted as a histogram with 0 representing the ATR's being equal. As a stocks short term ATR contracts the histogram will rise above 0 meaning volatility in the short term is contracting relative to long term volatility. On the other hand if the short ATR's are expanding versus the long term ATR's the histogram will fall below 0 and turn red, signifying short term volatility is greater than long term volatility.
The easy visualization of this indicator allows you to quickly see when a stock is in a tight range and could be ready for a potential breakout to the long side or breakdown to the short side.
In this example we see tight price action with a blue histogram followed by volatility to the upside coinciding with a breakout.
In this example we see volatility expanding as a stock continues to fall.
To help differentiate between trending contraction or expansion and just short term blips 5-day exponential moving average of the ratio is also plotted on the histogram and dynamically changes colors as it rises and falls.
Indicator options include:
Change histogram colors
Choose ema line width

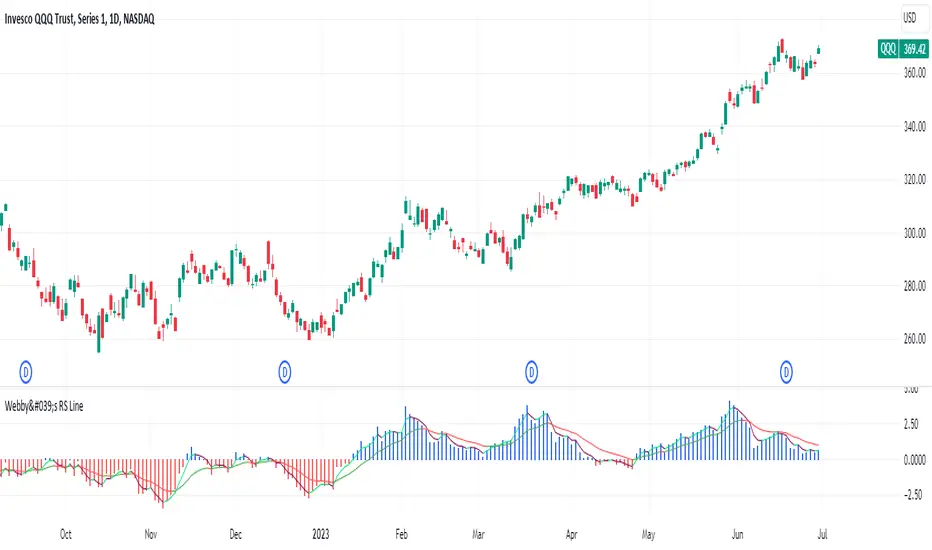
Webby's RS LineThe Relative Strength (RS) line is something many investors are familiar with. It is used to measure a stocks performance versus the S&P 500 and is typically calculated by dividing the closing price of the stock by the closing price of the S&P. This means if a stock moves up and the S&P moves down or the stock moves up more than the S&P the RS line will increase, if the stock moves down while the S&P moves up the line will decrease.
While the standard RS line is a powerful tool, Mike Webster recently discussed how he has made changes to the standard RS line and also uses a 21 exponential moving average of the RS line to help guide his decision making. This script puts those new twists on the standard RS line, by first calculating the RS line using the low of both the security and the S&P rather than the closing prices. Next it measures the 21-day exponential moving average of the RS line and plots the distance between the two as a histogram.
A strong trending stock that is out performing the market will see an extended period of a positive blue histogram signifying the RS line is above the 21-ema.
While on the other hand a stock in a downtrend that is underperforming will see a negative red histogram a red histogram signifying the RS line is below the 21-ema.
On top of all of that, the indicator also keeps 3 & 13 exponential moving average of the distance between the RS line and the 21 ema to help identify shorter term relative strength and capture more immediate shifts in momentum. Both of those are plotted on the histogram as well and will change color as they rise and fall making it easy to spot the direction.
Indicator options include:
Choose symbol to measure performance against
Change histogram colors
Choose ema line width
* Note this indicator does not plot the actual RS line, it is the histogram representing the distance between the RS line calculated using the lows and the 21 ema, as well as the two ema's of the relationship.
Webby % Off 52 WeekThis indicator measures a stocks distance from its 52 week high. The concept is based on what Mike Webster shared on his appearance on IBD Live, allowing users to see if a current pullback from the highs is normal compared to historical pullbacks or if more attention is warranted.
It is also important to pay attention to a stocks 52 week high in relation to it's current price to confirm trend, spot potential breakout levels or see if the high acts as an area of resistance.
The indicator has 3 different zones with shaded backgrounds to easily spot the distance off of the high.
Zones
Green Zone - 0 to 8% off highs
Yellow Zone - 8 to 15% off highs
Red Zone - 15 to 25% off highs
Similar Healthy Pullbacks
Possible concern as pullback undercuts previous pullback level

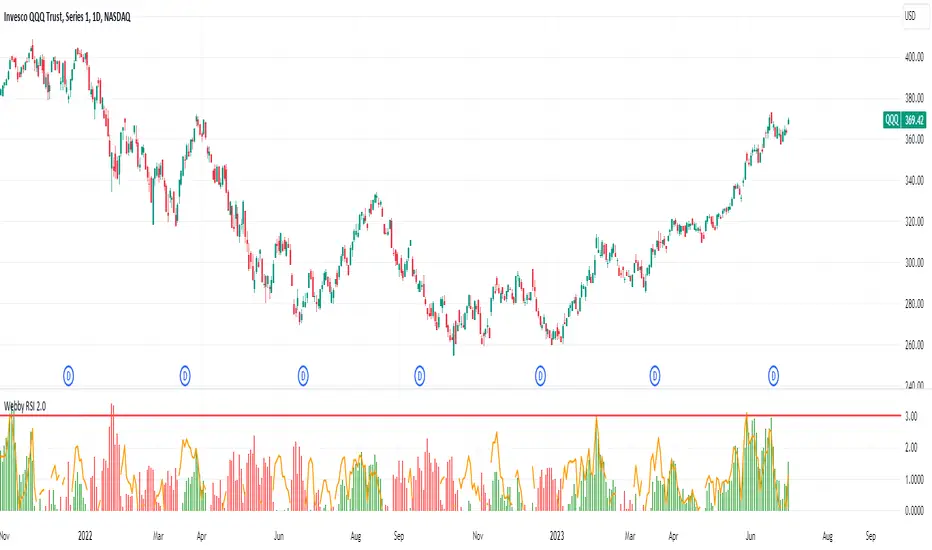
Webby's RSI 2.0Webby's RSI (Really Simple Indicator) 2.0 or version 5.150 as Mike himself calls it, builds upon the original Webby RSI by changing the way we measure extension from the 21-day exponential moving average.
Instead using the percentage of the low versus the 21-day exponential moving average, version 2 uses a multiple of the securities 50 day ATR (average true range) to determine the extension.
Version 2.0 also comes with some new additions, such as measuring the high vs 21-day exponential moving average when a security is below it, as well as an ATR extension from the 10-day simple moving average that Mike looks to as a guide to take partials.
[TTI] Reversion Alert on Nasdaq📜 ––––HISTORY & CREDITS 🏦
This script, titled " Reversion Alert", was developed by TinTinTrading with the intention of creating an easy visual tool based on the relationship between the price and different Exponential Moving Averages (EMAs). It is something TinTinTrading has learned over the years from studying the Investor's Business Daily courses and materials, especially seminars held by William O'Neil.
🎯 ––––WHAT IT DOES 💡
The " Reversion Alert" script monitors the distance between the closing price and the 9-period EMA as well as the distance between the 9-period and 20-period EMAs. It generates an alert when the closing price is far enough away from the 9-period EMA relative to the distance between the two EMAs. The sensitivity of this alert can be adjusted by the user. The script also plots the 9-period and 20-period EMAs on the chart for visual reference. When the distance between the closing price and the 9-period EMA is more than the distance between the 9 and 20 period EMAs (and meets several other coded conditions), the price is likely extended and we can anticipate a pullback within next 1-3 days on the chart.
IMPORTANT - I only use this indicator on the NASDAQ Composite ( NASDAQ:IXIC ) and S&P500 ( SP:SPX ) and Dow Jones Composite ( TVC:DJI ). If you decide to use it for individual assets (equities, crypto or forex) make sure you toggle the sensitivity input so that it makes sense for the asset you are trading.
🛠️ ––––HOW TO USE IT 🔧
After adding the script to your chart, you will see two lines representing the 9-period and 20-period EMAs. You can adjust the sensitivity of the alert using the 'Sensitivity (%)' input in the settings panel. The default sensitivity is set at 18.5%. When an alert condition is met, a downward pointing red triangle with an exclamation mark will appear above the bar. This indicates a potential reversion scenario based on the relative positioning of the closing price and the two EMAs.
If the indicator shows an exclamation mark above the chart we can anticipate a pullback. Some techniques that yuo could apply could be:
👉 Tighten stops
👉 Reduce position size
👉 Harvest profits (or scale down)
👉 Be cautious to add new positions
Remember that this tool is meant to aid in your analysis and not to dictate trades. Always use in conjunction with other tools and your own analysis.

Base Finder DailyThe Base Finder Daily is the companion tool to the original Base Finder which is used to identify consolidation periods in a stock's advance. The Base Finder Daily allows traders to zoom in from the weekly chart and get a more precise view of the daily price action during a basing period.
Base Finder Daily identifies three different types of bases (Flat Base, High Tight Flag, Consolidation) and provides key information about the consolidation such as the depth, length, and pivot point. This information allows traders to compare and analyze the best basing patterns quickly and easily.
This tool helps traders of all levels train their eye to identify potential trading opportunities that might have otherwise gone unnoticed.
Base Finder is a must-have tool for any trader, especially those that have studied the work of William O’Neil. Base Finder stacks up base for base with MarketSmith.
Easily customize the settings, from the look to the intricacies of a consolidation.
Default base settings:
Flat Base
length: 25 days minimum
depth: <= 15%
High Tight Flag
Flag Pole: up 80% or more in less than 40 days
Flag: Less than 25% correction in 10-20 days
Consolidation:
length: minimum 30 days
depth: <= 35%
Notes
This indicator is meant to be used on the daily timeframe.
In order to see the stats labels hover your mouse over the left side high of the consolidation and please make sure the indicator is brought to the front using the visual order of your chart. If the visual order is not correct you will not be able to see the stats label.
Disclaimer:
This indicator is for informational and educational purposes only. Do your own research before making any trade decisions. We accept no liability for any loss or damage, including without limitation any loss of profit, which may arise directly or indirectly from use of or reliance on this indicator.

Market Navigator OscillatorSimilar to the Market Navigator, the Market Navigator Oscillator turns the methodology taught in Market School by Investors Business Daily into an easy-to-use indicator, but in a more condensed form. The Market Navigator Oscillator plots all of the same information as the original Market Navigator, but keeps your main chart clear. This system follows a strict set of rules to help gauge when it's time to increase market exposure or back away.
The indicator considers 24 different buy and sell signals, as well as portfolio management rules, to keep you on the right side of the market with no guesswork.
Buy and sell signals are generated based on different criteria, including the relationship between price and key moving averages, volume, and time. Each signal is assigned a point value, which is then added (buy signal) or subtracted (sell signal) to the running exposure count when the signal occurs. This exposure count is then used to give a recommended maximum exposure level.
The Market Navigator Oscillator also identifies certain instances when being more aggressive is called for, known as a Power Trend. A Power Trend is triggered within the context of an uptrend that meets a certain criterion of price, length, and moving average relationship.
This indicator is a must-have for any trader looking to take the guesswork out of their trading by automating recommended exposure levels and being in step with the market.
Principles covered include:
Recommended maximum portfolio exposure
Buy switch / restraint rules
Follow through / distribution days
Power Trend
Dynamic Day 1
When you first put the indicator on your chart, it will ask you to select Day 1 of the current rally attempt. A Day 1 is defined as either:
The first positive day in a down trending market
A down day where the index closes in the upper half of the daily range
Disclaimer: This indicator is for informational and educational purposes only. Do your own research before making any trade decisions. I accept no liability for any loss or damage, including without limitation any loss of profit, which may arise directly or indirectly from use of or reliance on this indicator.
I am not affiliated with Investor's Business Daily. This is my original interpretation of the rules taught in the Market School Home Study Program.

Market NavigatorThe Market Navigator turns the methodology taught in Market School by Investors Business Daily into an easy-to-use indicator. This system follows a strict set of rules to help gauge when it's time to increase market exposure or back away.
The indicator considers 24 different buy and sell signals, as well as portfolio management rules, to keep you on the right side of the market with no guesswork.
Buy and sell signals are generated based on different criteria, including the relationship between price and key moving averages, volume, and time. Each signal is assigned a point value, which is then added (buy signal) or subtracted (sell signal) to the running exposure count when the signal occurs. This exposure count is then used to give a recommended maximum exposure level.
The Market Navigator also identifies certain instances when being more aggressive is called for, known as a Power Trend. A Power Trend is triggered within the context of an uptrend that meets a certain criterion of price, length, and moving average relationship.
This indicator is a must-have for any trader looking to take the guesswork out of their trading by automating recommended exposure levels and being in step with the market
Principles covered include:
Recommended maximum portfolio exposure
Buy switch / restraint rules
Follow through / distribution days
Power Trend
Customize the indicator so it fits and looks great on your charts!
Multiple ways to view key information
Customize colors
Show or hide different element to see as much or as little information as you want
Highlight the background of Power Trends
Change the bar color of distribution/stall days
Change table position & size
Show or hide key moving averages
Dynamic Day 1
When you first put the indicator on your chart, it will ask you to select Day 1 of the current rally attempt. A Day 1 is defined as either:
The first positive day in a down trending market
A down day where the index closes in the upper half of the daily range
With over 24 buy and sell signals, the built-in reference table makes it simple to crosscheck which signals occur.
Included with this indicator is access to the Market Navigator Oscillator, which plots the exposure count as a line in a separate pane, keeping your main chart uncluttered. This version allows you to see all of the same information in a condensed form.
Disclaimer: This indicator is for informational and educational purposes only. Do your own research before making any trade decisions. I accept no liability for any loss or damage, including without limitation any loss of profit, which may arise directly or indirectly from use of or reliance on this indicator.
I am not affiliated with Investor's Business Daily. This is my original interpretation of the rules taught in the Market School Home Study Program.

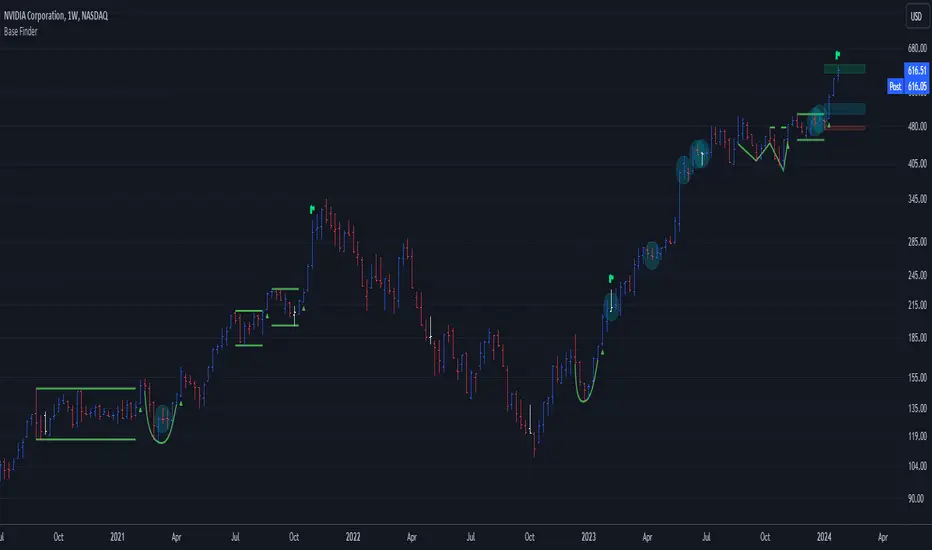
Base FinderThe Base Finder is a powerful tool to identify consolidation periods in a stock's advance. With this indicator, traders can effortlessly spot consolidation patterns on their charts providing them with a deeper understanding of the stock's price action.
Base Finder goes beyond identifying consolidation patterns, as it also offers key information about the consolidation such as the depth, length, pivot point, and the number of accumulation or distribution weeks throughout the pattern. This information allows traders to compare and analyze the best basing patterns quickly and easily.
With Base Finder, traders can differentiate between a Flat Base, a High Tight Flag, or a consolidation, like a cup with handle or double bottom base.
This tool helps traders of all levels train their eye to identify potential trading opportunities that might have otherwise gone unnoticed.
Base Finder is a must-have tool for any trader, especially those that have studied the work of William O’Neil. Base Finder stacks up base for base with MarketSmith.
Easily customize the settings, from the look to the intricacies of a consolidation.
Default base and accumulation/distribution settings:
Flat Base
length: 5 weeks minimum
depth: <= 15%
High Tight Flag
Flag Pole: up 80% or more in less than 8 weeks
Flag: Less than 25% correction in 2-4 weeks
Consolidation:
length: minimum 6 weeks
depth: <= 35%
Accumulation Week:
Current candle closes lower, but in the upper half of the weekly closing range on above average volume. OR Current candle closes positive in the upper 40% of the weekly closing range on above average volume.
Distribution Week:
Current candle closes positive, but in the lower quartile of the weekly closing range on above average volume. OR Current candle closes down on the week in the lower half of the weekly closing range on above average volume.
Notes
This indicator is meant to be used on the weekly timeframe.
In order to see the stats labels hover your mouse over the left side high of the consolidation and please make sure the indicator is brought to the front using the visual order of your chart. If the visual order is not correct you will not be able to see the stats label.
Disclaimer:
This indicator is for informational and educational purposes only. Do your own research before making any trade decisions. We accept no liability for any loss or damage, including without limitation any loss of profit, which may arise directly or indirectly from use of or reliance on this indicator.
[TTI] Minervini MonAlert Pro––––HISTORY & CREDITS 🏦
This indicator, Minervini MonAlert, is an updated version of the October 2022 Minervini MonAlert ( ).
Special thanks to Michael Walstedt @MichaelWalstedt for his valuable contributions to make this happen. The script is inspired by the stealth platform functionality, MonAlert, by Mark Minervini, the legendary trader and market wizard. The acronym MonAlert stands for Monitor and Alert.
––––WHAT IT DOES 💡
The Minervini MonAlert indicator is designed for traders who want to have "Minervini-like" eyes on technical setups for confirmation and violations. It helps to monitor and alert users about various technical setups, painting on the chart the things that Mark Minervini looks for pre and post buy to confirm or violate the trade. The indicator includes 58 daily and weekly indicators, covering various aspects of technical analysis that show confirming or violating action.
––––FUNCTIONALITIES
Label Plots
At each bar you can see how many confirmations and violations have triggered. The indicator prints a label with the sum of the total number of confirmations in green and violations in red. These can be turned on and off, so that only confirmations or violations are plotted.
🚨When you hover with the mouse over the labels, you can see exactly which indicators have triggered! Example of the functionality is shown on the chart with the picture in black outline.
Summary Label
You can turn on a label on the right hand side to show the total sum of the confirmations and violations. If violations are more than confirmations the label will color accordingly. The period for which the calculations are made is customizable in the settings.
Background Coloring
The background of the chart can be colored if it is turned on in settings.
👉Option 1 is to color the period which the indicator analyses
👉Option 2 is to color according to the recent balance (sum) between violations and confirmations. 🟩Green background means that there are more confirmations and 🟥Red means there are more violations. 🟨Orange means confirmations and violations are the same number
Bars only
If you add another instance of the indicator and move it to a new pane you can trigger the Additional Charts funcationalities and see the a histogram of bars. These can be set with 3 settings:
👉Net: Showing the net between the number of violations and confirmations
👉Confirmations only: Showing only the number of confirmations
👉Violations only: Showing only the number of violations.
––––CALCULATIONS
Some indicators are both confirming and violating, others are only violating or only confirming. Hence the total number of signals are 58.
// Indicator 1 - Lower Lows and Higher Highs: Looks at consecutive lower lows and higher highs based on thresholds suggested by Mark
// Indicator 2 - Looks for days with significant price advancement
// Indicator 3 - Good and Bad closes: Looks at how the stock is closing compared to its intraday range
// Indicator 4 - Analyzes the price action around the 50-day simple moving average
// Indicator 5 - Stock Under Pressure: Looks whether the stock is under technical pressure as per IBD methodology.
// Indicator 6 - Up days and Down days looks wether the stock has been mostly going up or down
// Indicator 7 - Studies the largest volume days and their directio
// Indicator 8 - Detects wether there is an Outside Day
// Indicator 9 - Identifies relative strength new highs and new lows
// Indicator 10 - Monitors for potential reversals in price trends
// Indicator 11 - Detects for pattern called "Megaphone" that signifies increases in volatility
// Indicator 12 - There is a famous rule of William O'Neil about stock making 20% advancement
// Indicator 13 - ANTS Confirmation - a pattern coined by David Ryan, that looks for both consecutive advancement and volume
// Indicator 14 - Angle D - an technical pattern coinded by Mark Minervini, that looks at the price direction vs the direction of the 50D SMA
// Indicator 15 - 17 Closes around key moving averages
// Indicator 18 / 19 Observes stock closing prices at high or low points
// Indicatro 19 - Detects significant reversals in stock price trends that are backed by significant volume
// Indicator 20 - Identifies stocks that decline with a substantial volume increase.
// Indicator 21 - Issues a warning for stocks that may be overextended, compared to its own price action
// Indicator 22 - Highlights days with a narrower price range than the previous day
// Indicator 23 - 24 Detects the largest down days accompanied by high trading volume.
// Indicator 25 -Pinpoints stocks that rise with a substantial volume increase (e.g. +30%)
// Indicator 26 - 30 Studies weekly price trends, analyses significant weekly declines on high trading volume and examines for the largest percentage price decline.
––––HOW TO USE IT 🔧
To use the Minervini MonAlert indicator, follow these steps:
1️⃣ Apply the indicator to your chart by searching for " Minervini MonAlert" in the TradingView indicators section. The script is 'invite-only'.
2️⃣ Customize the indicator's settings to suit your trading style and preferences.
3️⃣ Observe the various technical setups and alerts generated by the indicator on your chart.
4️⃣ Use the outputs of the technical setups as confirmation signals or violations to help make informed trading decisions. A stock that is gathering a lot of violating action before or after a breakout is a lower probabiltiy setup.
5️⃣ Combine the Minervini MonAlert indicator with other technical analysis tools or methods for a more comprehensive trading strategy.
Remember that the Minervini MonAlert indicator should be used as a supplement to your existing trading strategy and not as a standalone tool. Always consider other factors, such as fundamental analysis and risk management, to make well-rounded trading decisions.

[TTI] IBD's 3 (three) weeks tight close pattern––––HISTORY & CREDITS 🏦
The Three Weeks Tight Close pattern is a technical analysis pattern that occurs when a stock closes at nearly the same price for three consecutive weeks, suggesting a period of consolidation before the stock moves in a new direction. The concept of "line of least resistance" as mentioned by Jesse Livermore is closely related to this pattern. It indicates that there is a period of indecision in the market, with buyers and sellers fairly evenly matched. This pattern is often associated with stocks that have strong fundamentals and a solid business model. The pattern was first discovered by Investor's Business Daily founder William Bill O'Neill.
––––WHAT IT DOES 💡
The Three Weeks Tight Close pattern helps traders identify periods of consolidation in a stock's price movement. During these periods, the stock's closing price remains nearly unchanged for three consecutive weeks. This pattern can be a signal that the stock is under accumulation and potentially ready to make a significant move in either an upward or downward direction. By identifying these tight closes, traders can prepare to take advantage of the solid price run and make profitable trades.
The indicator plots 3 different dots/squares above the weekly bar on order to indicate which consecutive tight close wee have.
👉 Cyan color indicates 3 week tight closes
👉 Pink color indicates 4 week tight closes
👉 Red color indicates 5 week tight closes
––––HOW TO USE IT 🔧
• Focus on weekly charts for easier identification.
• Look for three consecutive weekly closes with nearly the same price, within 1-1.5% of each other. Using the indicator.
• Check for low volume during the tightening period.
• Once the pattern is confirmed, switch to the daily timeframe to find the exact buy point.
• Use other technical indicators to confirm a breakout before taking a position in the stock, such as breakouts, moving averages, and trend lines.
• Monitor the position regularly to ensure continued positive price movement.
• Be patient and wait for confirmation before buying in.
• Use stop-loss orders to limit losses if the stock does not move in the expected direction.
• Consider the overall market and its impact on individual stocks before making a trade.
• Keep in mind that not all three tight closes are created equal and use technical analysis to confirm your suspicions.
By following these steps, traders can use the Three Weeks Tight Close pattern to identify potential trading opportunities and increase their chances of making profitable trades.

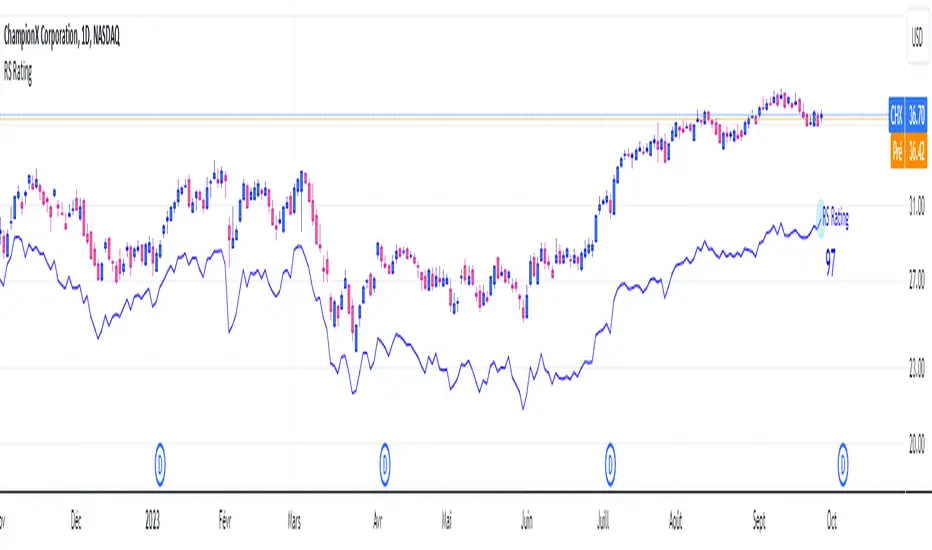
RS RatingHello everyone.
The RS Rating (or Relative Strenght Rating) is a metric that tracks a stock's price performance relative to the rest of the market. Specifically, it looks at a stock's relative strength over the last 52 weeks.
It allows you to identify at a glance stocks that are outperforming the market and may be poised for further gains.
Designed for break-out traders, trend follower, value investors, the RS Rating can help you identify promising opportunities and make informed investment decisions.
The Rating stands as follow:
- From 1 (worst) to 99 (best)
- 99 rating means the stock is outperforming 99% of all stocks in terms of relative share price performance over the last 52 weeks.
The RS Rating is accompanied by the RS line which is a representation of the progress of the asset against the comparative symbol. (Here SP500)
Of course this script is inspired by the IBD rating system.
The results may be equivalent but it is not guaranteed.
This indicator proposes a scoring system in the style of the one proposed by IBD.
Indeed for an optimal result, it would be necessary to compare the relative performance of all actions, which is not yet possible on PineScript.
Here is the formula for calculating the score:
RS Score = 40% * P3 + 20% * P6 + 20% * P9 + 20% * P12
With
P3 = Performance over the last 3 months
P6 = Performance over the last 6 months
P9 = Performance over the last 9 months
P12 = Performance over the last 12 months
There is no equivalent solution for the moment on TradingView.
The rating score will only appear on the daily timeframe.
For now it's my pleasure to share!
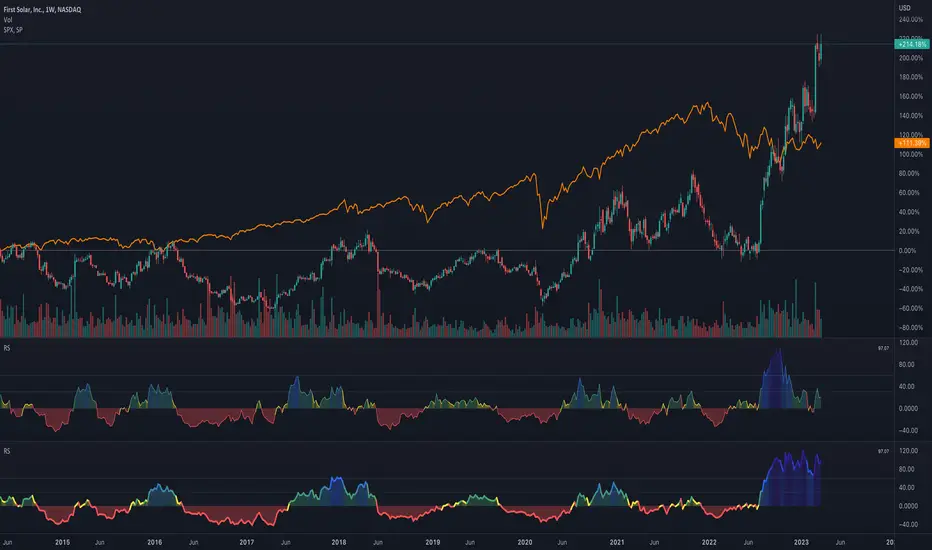
RS - Relative Strength ScoreRelative strength (RS) is a measure of a stock's price performance relative to the overall market. It is calculated by dividing the stock's price change over a specified period by the market's price change over the same period. A stock with a high RS has outperformed the market, while a stock with a low RS has underperformed. (Stock can any asset that can be compared to a reference index like as Bitcoin, Altcoins etc ...)
Here are some advantages:
- Provides a measure of a stock's performance relative to a benchmark index or sector, allowing for a more accurate comparison of performance.
- Helps identify stocks with strong price momentum that are likely to continue outperforming the market in the short to medium term.
- Allows investors to identify the strongest performers within a particular sector or industry.
- Provides a quantitative and objective measure of a stock's performance, which can help reduce bias in investment decisions.
- Can be used in conjunction with other technical indicators and chart analysis to identify potentially profitable trades.
- Helps investors make more informed decisions by providing a more comprehensive picture of a stock's performance.
How to use it:
- The indicator can be used in daily and weekly timeframes.
- Check, if the default reference index is suited for your asset (Settings) The default is the combination of S&P500+Nasdaq+Dow Jones. For Crypto, it could be TOTAL (ticker for total stock market), for German stocks it could be DAX.
- Decide (settings), if you want to see the RS based on annual calculation (IBD style) or based only for the last quarter
Color coding:
- Red: Stock is performing worse than index (RS < 0)
- Yellow: Stock get momentum, starting to perform better than index (RS > 0)
- Green: Stock is outperforming the index
- Blue: Stock is a shooting star compared to index
- When RS turns positive and stays there, it could be an indication for an outbreak (maybe into a stage 2)
No financial advise. For education purposes only.
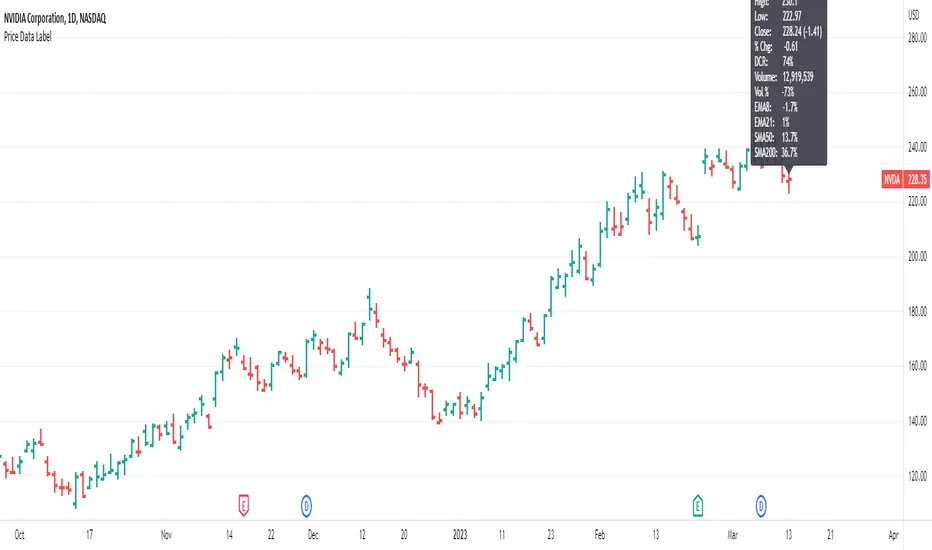
Price Data LabelThis indicator gives you the ability to see historical data for each bar on the chart by simply hovering over the high of the bar, similar to the functionality of MarketSmith.
Data for each bar includes:
Open
High
Low
Close + Change
Percentage Change
Closing Range
Volume
Volume Percent based on 50 day average
Distance to 4 selectable moving averages
Example of stats on a historical bar:
* Note this only works on the last 500 historical bars. If you use bar replay it will work with 500 historical bars from the last bar.
* If you have multiple indicators on your chart, in order to see the data you will need to use visual order to bring to front. This can be done by clicking the three dots next to the indicator name and selecting visual order.
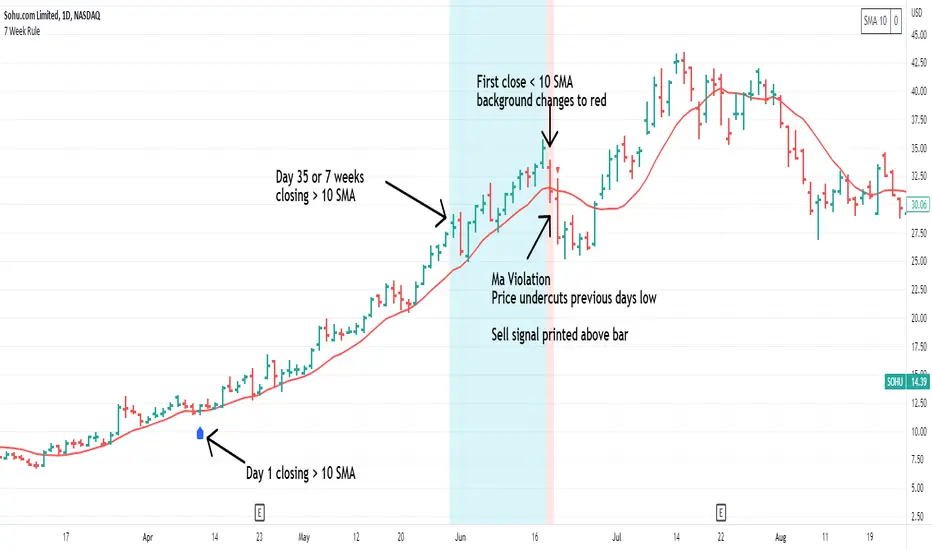
7 Week RuleThe 7 week rule was shared by Gil Morales in his book “Trade Like an O’Neil Disciple”. The rule is described as: Stocks that have shown a tendency to “obey” or “respect” the 10-day moving average for at least 7 weeks in an uptrend should often be sold once the stock violates the 10-day line. A “violation” is defined as a close below the 10-day moving average followed by a move on the next day below the intraday low of the first day.
This indicator makes using the 7 week rule easy. Once a stock has closed above its selected moving average (10SMA by default) for 35 days the 7 week rule is triggered. Once the stock then “violates” the moving average, a sell signal is printed on the chart.
Indicator Customizations
Moving Average Length & Type
Show or Hide Moving Average
Show Running Count of Days Above Selected MA
Highlight When 7 Week Rule Triggers
Option to Show First Day Above MA
Indicator is dynamic and will continue the count if no violation occurs.
[TTI] IBD Power Trend🏛️ History & Credit
IBD Power Trend is an indicator created by TintinTrading inspired by the Investor's Business Daily and William O'Neil's investment philosophy. It is part of the Market School methodology.. It's built on the principle that the market's Power Trend is the best time to get aggressive.
💪 What it does
IBD Power Trend helps traders identify when the market's Power Trend starts and finishes. The indicator uses rules about the position of the price relative to the 21EMA and 50SMA, as well as the relationship between the two moving averages, to give traders an edge.
👨🏫 How to use it
IBD Power Trend can be used as an additional criteria to decide when to get more aggressive in the market. It can also be used to assess when to be a pig/tiger. With IBD Power Trend, traders can have more confidence in their trades and make better investment decisions.
