Fierytrading: Volatility DepthDear Tradingview community,
I'd like to share one of my staple indicators with you. The volatility depth indicator calculates the volatility over a 7-day period and plots it on your chart.
This indicator only works for the DAILY chart on BTC/USD.
Colors
I've color coded the indicator as follows:
- Red: Extreme Volatility
- Orange: High Volatility
- Yellow: Normal Volatility
- Green: Low Volatility
Red: extreme changes in price. Often during local tops and bottoms.
Orange: higher than average moves in price. Often before or after a "red" period. Often seen in the middle of bear or bull markets.
Yellow: normal price action. Often seen during early stage bull-markets and late stage bear-markets.
Green: very low price movement. Often during times of indecision. Once this indicator becomes green, you can expect a big move in either direction. Low volatility is always followed by high volatility.
In a long-term uptrend, a green period often signals a bullish break out. In a long-term downtrend it often signals a bearish break out.
How to use
Save the indicator and apply it to your chart. You can change the length in the settings, but it's optimized for 7 days, so no need to change it.
I've build in alerts for all 4 different volatility periods. In most cases, the low volatility alert is enough.
Good luck!
Indicators

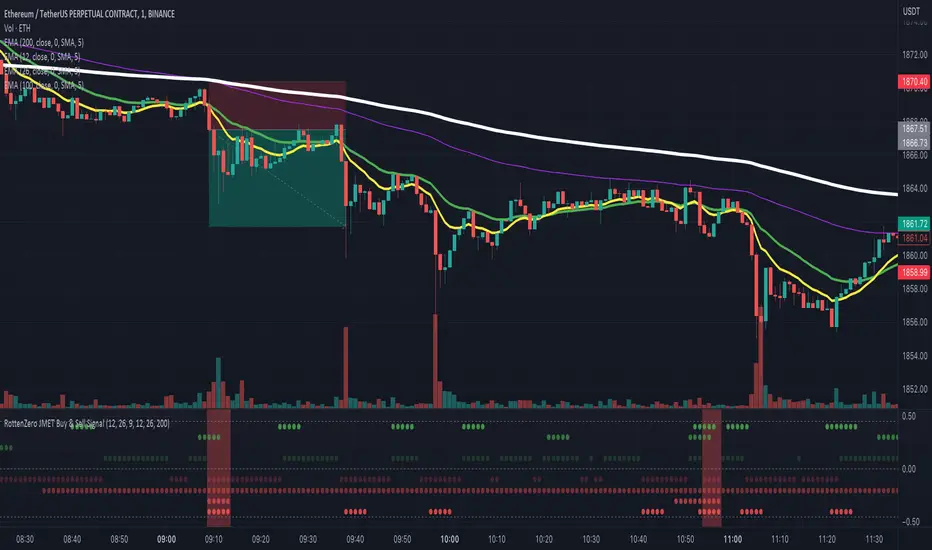
RottenZero JMET Buy & Sell Signal”RottenZero JMET Buy & Sell Signal" is a custom indicator designed to help traders identify potential buy and sell signals in the market by unifying multiple indicators into a single tool.
(J(JMA)+M(MACD)+E(EMA)+T(Trend))
This was inspired by YouTube videos that showcased trading strategies using separate indicators.
The indicator combines the Jurik Moving Average (JMA), Moving Average Convergence Divergence (MACD), and Exponential Moving Averages (EMA) into a concise visual representation using circles and background colors.
The indicator plots various events as circles with varying opacity levels, which helps visualize the strength of the signals.
It also changes the background color to green for a long signal and red for a short signal, indicating potential buy and sell signals, respectively.
Here's some examples:
(Please note that signals are not always accurate and should be used as a reference in your trading decisions, rather than relying solely on them.
It's essential to use proper risk management and incorporate other aspects of technical and fundamental analysis to make well-informed trading decisions.)
I hope this unified indicator proves to be a valuable tool in your trading.
-----
(KO)
"RottenZero JMET Buy & Sell Signal"은 여러 지표를 하나의 도구로 합쳐 잠재적인 매수 및 매도 신호를 파악하는 데 도움이 되도록 설계된 인디케이터입니다.
(J(JMA)+M(MACD)+E(EMA)+T(Trend))
이 인디케이터는 별도의 여러 지표를 사용한 거래 전략을 보여주는 YouTube 동영상에서 영감을 얻어 더 편하게 사용하기 위해 만들게 되었습니다.
지표는 Jurik 이동 평균 (JMA), 이동 평균 수렴 발산 (MACD), 지수 이동 평균 (EMA)을 원형 및 배경색을 사용하여 심플하게 보이도록 했습니다.
지표는 다양한 투명도 수준의 원으로 이벤트를 표시하여 신호의 강도를 시각화하는 데 도움이 됩니다.
또한 배경색을 Long 신호의 경우 초록색으로, Short 신호의 경우 빨간색으로 변경하여 잠재적인 매수 및 매도 신호를 나타냅니다.
(신호가 항상 정확하지는 않으므로, 이를 거래 결정에 대한 참조로 사용하고 전적으로 의존하지 마시길 바라며,
적절한 리스크 관리와 기술적이고 기본적인 여러 근거들을 포함하여 신중한 거래 결정을 내리시기를 바랍니다.)
이 인디케이터가 거래하실 때 도움이 되시기를 바라겠습니다.
No Code SignalsNo Code Signals is an intuitive user interface for users to generate their own signals based on indicators they already have applied to their chart.
This indicator makes use of the new input.source() limits for importing data from external sources (indicators) into 1 indicator.
You are now able to import ANY number of sources from up to 10 different indicators.
Features:
- Import up to 10 unique values from up to 10 different indicators already on your chart!
- Compare those values against other imported indicator values, or chart ohlc values.
- Option to use a defined level instead of an active source.
- 5 Signal Options (Currently)
- Alerts, Each signal has its own alert condition.
- Labeled Signals, to tell which signal is which.
Potential Future Plans:
- More Signals & Analysis Options
- Possibly more imports
- Combining 2 (or more) signals into 1
Here is a Screenshot of a chart with signals, and the Interface creating the signals.
Enjoy!

HTF Power of Three° [Pro+] by toodegreesDescription:
Power of Three ( PO3 ) is one of the many concepts introduced by the Inner Circle Trader , and inspired by Larry Williams .
The PO3 represents a three staged Smart Money campaign: Accumulation , Manipulation , and Distribution ( AMD ).
This tool helps to build narrative, as well as spotting important institutional levels.
ICT traders assume that this pattern represents how any candle is built.
“ This is applicable to every time measurement, as long as you have a beginning time, the highest value, the lowest value, and an ending in terms of measuring time. ”
Consider the development of a Bullish Candle over Time:
– Candle Open (initial value price, prior to dynamic imbalance)
– Accumulation of longs around the opening price
– Manipulation where short liquidity is engineered and long liquidity is neutralized
– Range Expansion (dynamic price imbalance)
– Distribution pairing long exits with pending buy interest
– Candle Close (ending value price, post dynamic imbalance)
The same goes for the development of Bearish Candles, in reverse.
Indicator Features:
The HTF Power of Three° Pro+ Indicator allows to monitor the selected Higher Timeframe Candles in real time:
– Follow HTF Candle development Live
– Plot unlimited HTF Candles on the current resolution
– Use NY Midnight time as the Candle Open on Daily and Weekly timeframes
– Spot HTF PD Arrays while on a lower timeframe
– See where the HTF Open, High, and Low are in the current lower resolution with high precision
– Know when the HTF candle is supposed to Close by monitoring its own countdown (below 1D)
– Note previous HTF Low to High ranges to gain a deeper understanding of LTF market profiles
Additional Features:
– Choose between Candles and Bars to display your HTF PO3s
– Hover on the open and close of past HTF candles to see their OHLC and Range values
– Resize and offset HTF candles to your liking
– Stack multiple instances on the indicator to show multiple higher timeframes at once on the same layout
– Backtest strategies with two (or more) timeframes on one chart
– Study and backtest PO3 in Replay Mode with ease
– Trade PO3 with confidence without needing multiple layouts
Indicator In Action:
To Get Access, and Level Up see the Author's Instructions below!
This indicator is available only on the TradingView platform.
⚠️ Intellectual Property Rights ⚠️
While this tool's base concepts are public, its interpretation, code, and presentation are protected intellectual property. Unauthorized copying or distribution is prohibited.
⚠️ Terms and Conditions ⚠️
This financial tool is for educational purposes only and not financial advice. Users assume responsibility for decisions made based on the tool's information. Past performance doesn't guarantee future results. By using this tool, users agree to these terms.
付費腳本

Kitchen [ilovealgotrading]
OVERVIEW:
Kitchen is a strategy that aims to trade in the direction of the trend by using supertrend and stochRsi data by calculating at different time values.
IMPLEMENTATION DETAILS – SETTINGS:
First of all, let's understand the supertrend and stocrsi indicators.
How do you read and use Super Trend for trading ?
The price is often going upwards when it breaks the super trend line while keeping its position above the indication level.
When the market is in a bullish trend, the indicator becomes green. The indicator level will act as trendline support in such a scenario. The color of the indicator changes to red to indicate a negative trend once the price crosses the support line. The price uses the super trend level as a trendline resistance during a bearish move.
In our strategy, if our 1-hour and 4-hour supertrend lines show the up or down train in the same direction at the same time, we can assume that a train is forming here.
Why do I use the time of 1 hour and 4 hours ?
When I did a backtest from the past to the present, I discovered that the most accurate and consistent time zones are the 1 hour and 4 hour time zones.
By the way we can change our short term timeframe(1H) and long term timeframe(4H) from settings panel.
How do you read and use the Stoch-RSI Indicator?
This indicator analyzes price dynamics automatically to detect overbought and oversold locations.
The indicator includes:
- The primary line, which typically has values between 0 and 100;
- Two dynamic levels for overbought and oversold conditions.
IF our stoch-rsi indicator value has fallen below our lower boundary line, the oversold event has been observed in the price, if our stoch-rsi value breaks up our bottom line after becoming oversold, we think that the price will start the recovery phase.(The case is also true for the opposite.)
However, this does not always apply and we need additional approvals, Therefore, our 1H and 4H supertrrend indicator provides us with additional confirmation.
Buy Condition:
Our 1H(short term) and 4H(long term) supertrrend indicator, has given the buy signal(green line and yellow line), and if our stochrsi indicator has broken our oversold line up on the past 15 bars, the buy signal is formed here.
Sell Condition:
Our 1H(short term) and 4H(long term) supertrrend indicator, has given the sell signal(red line and orange line), and if our stochrsi indicator has broken our overbuy line down on the past 15 bars, the sell signal is formed here.
Stop Loss or Take Profit Conditions:
Exit Long Senerio:
All conditions are completed, the buy signal has arrived and we have entered a LONG trade, the 1-hour supertrend line follows the price rise(yellow line), if the price breaks below the 1-hour super trend line and a sell condition occurs for 1H timeframe for supertrend indcator, LONG trade will exit here.
Exit Short Senerio:
All conditions are completed, the Sell signal has arrived and we have entered a SHORT trade, the 1-hour supertrend line follows the price down(orange line), if the price breaks up the 1-hour super trend line and a buy condition occurs for 1H timeframe for supertrend indcator, SHORT trade will exit here.
What can you change in the settings panel?
1-We can set Start and End date for backtest and future alarms
2-We can set ATR length and Factor for supertrend indicator
3-We can set our short term and long term timeframe value
4-We can set StochRsi Up and Low limit to confirm buy and sell conditions
5-We can set stochrsi retroactive approval length
6-We can set stochrsi values or the length
7-We can set Dollar cost for per position
8- We can choose the direction of our positions, we can set only LONG, only SHORT or both directions.
9-IF you want to place automatic buy and sell orders with this strategy, you can paste your codes into the Long open-close or Short open-close message sections.
For example
IF you write your alert window this code {{strategy.order.alert_message}}.
When trigger Long signal you will get dynamically what you pasted here for Long Open Message
ALSO:
Please do not open trades without properly managing your risk and psychology!!!
If you have any ideas what to add to my work to add more sources or make calculations cooler, suggest in DM .

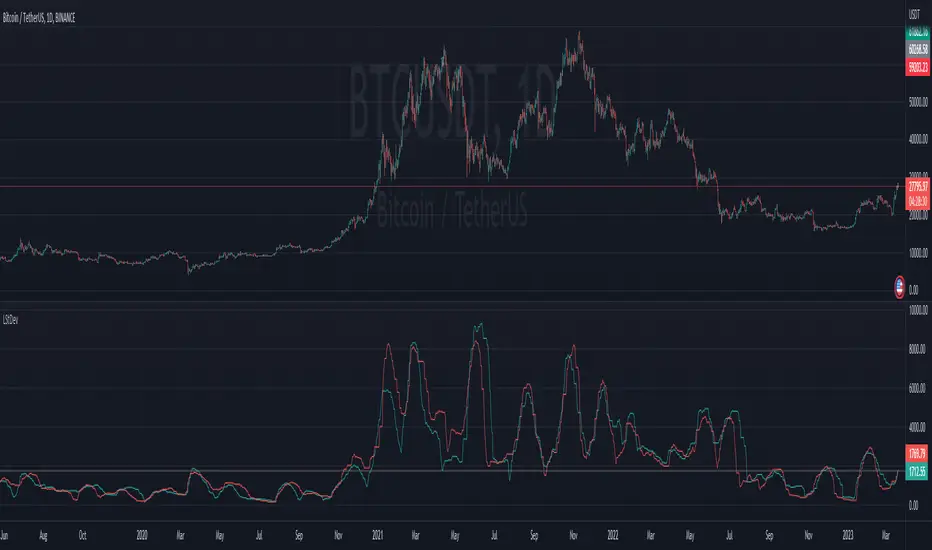
Ladder StDevThis indicator shows the upwards (green) and downward (red) volatility of the market. It is a standard deviation of the price but with a twist! For the upwards volatility , only the green candles are taken into account, and for the downwards only the red candles are.
Compared to my previous "Ladder ATR" indicator this a different approach to measure the the upwards and downwards volatility of the market by utilizing the standard deviation instead of the ATR. When both measure the volatility they have different "dynamics". Standard deviation increases the weight of larger values over smaller values. The ATR indicator is based on the average of absolute changes. So, if we apply the indicators on a daily chart , ATR considers intraday and between-day data, while the standard deviation calculation includes only daily returns (source price).
Momentum Composite Indicator@CRYPTOSLIFE
This script creates a Momentum Composite Indicator (MCI) that combines four different momentum indicators: RSI, MACD, Stochastic Oscillator, and Rate of Change (ROC). Each of these indicators is calculated, normalized, and then combined with equal weights (25% each) to create the composite indicator. The script also includes a color change based on the change in the composite indicator's value.
Here's a brief explanation of the indicator:
Parameters: The script takes one input parameter, 'length,' which is used as the length for RSI, Stochastic Oscillator, and ROC calculations.
RSI: The Relative Strength Index (RSI) is calculated using the 'length' input parameter. The RSI is then normalized to range between 0 and 1.
MACD: The Moving Average Convergence Divergence (MACD) is calculated using the default lengths of 12, 26, and 9. The histogram is then computed as the difference between the MACD line and the signal line. The MACD histogram is normalized to range between 0 and 1.
Stochastic Oscillator: The Stochastic Oscillator is calculated using the 'length' input parameter, taking the lowest low and highest high over the specified period. The oscillator is then normalized to range between 0 and 1.
Rate of Change (ROC): The Rate of Change (ROC) is calculated using the 'length' input parameter. The ROC is then normalized to range between 0 and 1.
Composite Indicator: The normalized values of RSI, MACD, Stochastic Oscillator, and ROC are combined with equal weights to create the composite indicator.
Color Change: The line color changes based on the change in the composite indicator's value. If the value increases, the line color is green; if it decreases, the line color is red.
Plotting: The composite indicator is plotted on the chart with a linewidth of 5.
This Momentum Composite Indicator can help traders assess the overall momentum in the price movement of a financial instrument by combining the information from four popular momentum indicators.

Ladder ATRThis indicator shows the upwards (green) and downward (red) volatility of the market. It is a moving average of the true range values like the ATR indicator does but with a twist! For the upwards volatility, only the green candles are taken into account, and for the downwards only the red candles are.
To the best of my knowledge, this technique had been introduced by HeWhoMustNotBeNamed in his "Supertrend - Ladder ATR" publication where the different types of volatility helped to improve the "trend reversal" conditions compared to the "Supertrend" indicator.
However, the actual "Ladder ATR" values were hard to see. This indicator shows the actual upward and downward volatility making it easy to reason about long and short price moves and potential biases in each direction.
In layman's terms this indicator "Ladder ATR" is to the "Supertrend - Ladder ATR" what the "Average True Range" indicator is to the "Supertrend" indicator.

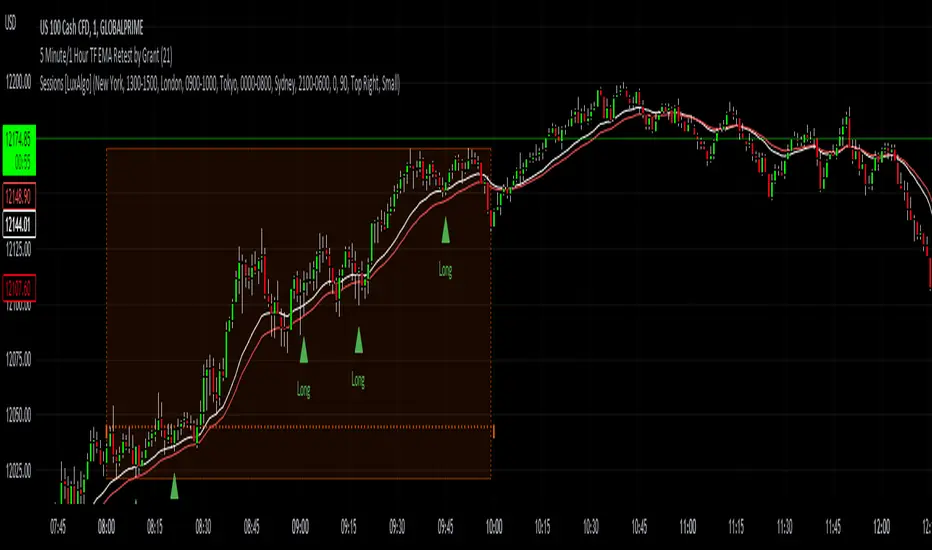
5 Minute TF 200 EMA Retest by Grantwww.tradingview.com
This indicator is a simple script meant to find retests on the 200 period moving average. It's current state is optimized for the 5 minute timeframe.
This works in all markets and all timeframes as long as you adjust certain rules for higher timeframes.
It's strengths and weaknesses
- Good at trend continuation in strong markets
- Bad in ranging markets (not surprising)
How does it work?
- It first identifies an overall trend by using the 200 ema.
- For long positions, it waits for price to close below the 200 ema, and then shortly closing back above the ema. For short positions its the opposite.
- For lower timeframes there are some other factors that help filter out bad signals that include:
- Makes sure that volume is increasing.
- Makes sure that volume is higher than average volume.
- For higher timeframes, the more specific factors aren't required.
How to use this indicator:
- Green triangles mean long positions
- Red triangles mean short positions
- Always trade with stoplosses and never risk too much of your account, please practice proper risk managment.
DISCLAIMER: Trading is inherently dangerous and carries lot's of risk. What you decide to do with my script has nothing to do with me. I am not responsible for any financial gains or losses made using this script. It is important to recognize other factors in the market to make better decisions.
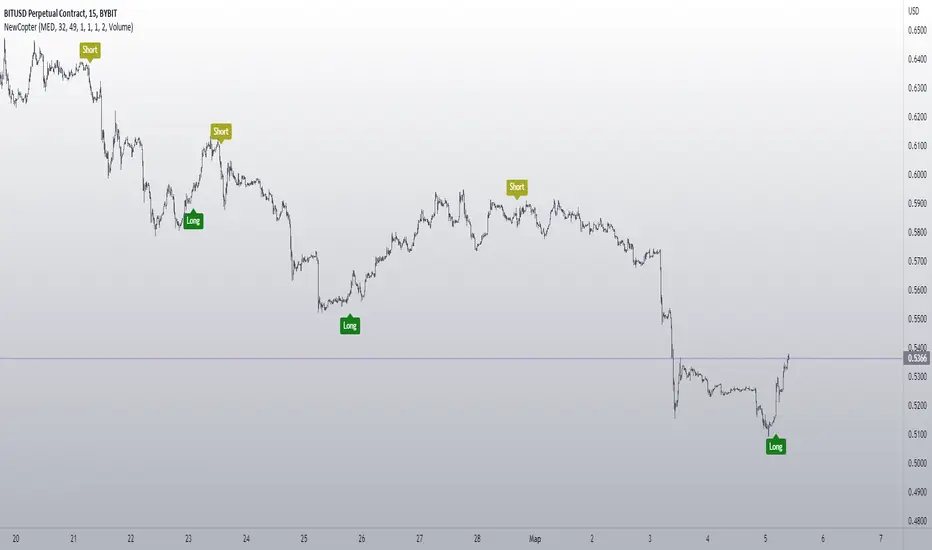
NewCopter📊 Indicator overview!
The indicator's strategy is based on calculations that are displayed on the chart based on price or volume.
Indicator uses a customizable volume threshold to filter out low volume candle and only display those with significant volume.
The algorithm analyzes market data and sets an entry/exit signal.
The key point of the indicator is reverse trades.
After the algorithm analyzes the current characteristics of the market, an entry signal is placed on the chart.
So whether you're a novice or experienced trader, indicator can help you stay ahead of the game and make more informed trading decisions.
As a result, the trader can be sure that the signal is based on data analysis.
A long or short position can be stopped either at a profit or at a small
loss without compromising the potential profit.
Signals without redrawing
📌Management of risks.
The market is unstable, and it is impossible to know what the future holds for it.
The only way to manage risk. You can limit the loss by setting a stop loss of 1% from the entry point.
Take profit is recommended to set with a ratio of 1:1, 1:2,1:3, with partial fixation of 40%, 30%, 30%!
We recommend fixing positions in parts. The signal in the opposite direction will be when the volume exits.
❕ To match the risk per trade, we recommend not entering with high leverage.
Trade only the amount you are willing to lose.
With increased volatility in the market and flat movement , the indicator can give many signals.
After a strong fall or rise, we recommend not to open positions, because.
high probability of flat movement.
✅Recommendations for the indicator!
Reverse transactions, the indicator shows where to buy-sell, sell-buy.
Entry / exit is carried out on the next candle after the candle with a signal (buy / sell)
Timeframes up to 1 hour (inclusive) are used, you can also use a higher timeframe.
Main trading pairs BTC BNB BIT
You can also trade other pairs, but you NECESSERY do a back test of the indicator.
⚙️!Technical part
The indicator is based on the EMA 20 and EMA 200 moving averages.
Which determine the current trend and the trend on higher timeframes.
the basic idea is that when we combine both we can see trend of the current and the past linear when they cross each other and from this we can make signals
Assuming that past shorter trend has the value of resistance or threshold values, so cross of current linear of those points can show if the trend is to buy or to sell by signals seen in the arrows .
So past and present mix and give us the future.
need to solve issue when market goes sideways but it easy to see how the trend look by the signals
It is also based on the open and close of past days, weeks, months.
The pivot high function calculates the pivot high, which is an important step in detecting bullish structures in the market.
The function also determines the swing state (high or low) of the current candle and returns the calculated swing values.
RSI are used.
RSI is a classic oscillator built on the basis of calculating the relative rate of change in asset prices
over a given period.
Additional tools: volume and volatility .
🗯Disclaimer
Please remember that past performance may not be indicative of future results.
Due to various factors, including changing market conditions, the strategy may no longer perform as well as in historical backtesting.
This post and the script don’t provide any financial advice.
And remember that past results in no way guarantee future results.
✔️If you already have your own strategy, you can use it along with the indicator.
Enjoy trading with our indicator.
Multi indicators tableThis is a comprehensive trading tool that presents an overview of the market in a tabular format. It consists of five distinct categories of trading indicators : Volatility, Trend, Momentum, Reversal, and Volume. Each category includes a series of indicators that are widely used in the trading communauty.
The Volatility category includes the Average True Range (ATR) and Bollinger Bands indicators. The Trend category comprises the Average Directional Index (ADX), four Exponential Moving Averages (EMAs), Aroon, Parabolic SAR, and the Supertrend. The Momentum category includes the Stochastic Relative Strength Index (StochRSI), Money Flow Index (MFI), Williams %R, Relative Strength Index (RSI), and Commodity Channel Index (CCI). The Reversal category includes Parabolic SAR, Moving Average Convergence Divergence (MACD), and PP Supertrend. Finally, the Volume category includes the Volume Exponential Moving Average (EMA) indicator.
The indicators states are easily readable, the indicator case is colored based on his actual state. A bullish color (green by default), a bearish color (red by default),
a very bullish color (dark green by default), a very bearish color (dark red by default) and a neutral color (gray by default) displayed when the indicator doesn't give us a clear signal. Some indicators do not have a very bullish or very bearish state. Concerning volatility indicators, the bullish color indicates high volatility, the bearish color indicates low volatility, and the neutral color indicates normal volatility.
Most of the indicators displayed in the table are customizable, and traders can choose to hide the categories they don't want to use. The Indicator provides a quick and easily readable view on the market and allows traders to reduce the number of indicators on their chart making it lighter and more readable.

Quantitative Price Forecasting - The Quant ScienceThis script is a quantitative price forecasting indicator that forecasts price changes for a given asset.
The model aims to forecast future prices by analyzing past data within a selected time period. Mathematical probability is used to calculate whether starting from time X can lead to reaching prices Y1 and Y2. In this context, X represents the current selected time period, Y1 represents the selected percentage decrease, and Y2 represents the selected percentage increase. The probabilities are estimated using the simple average.
The simple average is displayed on the chart, showing in red the periods where the price is below the average and in green the periods where the price is above the average.
This powerful tool not only provides forecasts of future prices but also calculates the distribution of variations around the average. It then takes this information and creates an estimate of the average price variation around the simple average.
Using a mean-reverting logic, buying and selling opportunities are highlighted.
We recommend turning off the display of bars on your chart for a better experience when using this indicator.
Unlock the full potential of your trading strategy with our powerful indicator. By analyzing past price data, it provides accurate forecasts and calculates the probability of reaching specific price targets. Its mean-reverting logic highlights buying and selling opportunities, while the simple moving average displayed on the chart shows periods where the price is above or below the average. Additionally, it estimates the average variation of price around the simple average, giving you valuable insights into price movements. Don't miss out on this valuable tool that can take your trading to the next level

Dynamic Volume Oscillator [CryptoScripts]The Dynamic Volume Oscillator uses a combination of volume and momentum to nail whenever a reversal is likely to happen. I've also included divergences (both regular and hidden) that you can toggle on/off and adjust the settings to fit your trading style.
Colors - The green wave indicates an uptrend while the purple wave indicates a downtrend.
Overbought/Oversold - Green backgrounds indicate the DVO is oversold and a reversal to the upside is likely to happen within the next few candles. Red backgrounds indicate the DVO is overbought and a reversal to the downside is likely to happen within the next few candles. You can adjust the levels to trigger when the signal flashes. Experiment with different timeframes/altcoins to see which settings work best. Some coins are more volatile than others and lower timeframes tend to reach higher levels vs higher timeframes.
Divergences - The settings of 1 and 3 for the lookbacks are so the divergence signal appears only 1 candle before the actual divergence happens (on the replay tool) vs 4-5 candles from other indicators. This means your entry on a divergence signal is 2 candles after it prints (for backtesting purposes).
Alerts - I also added alerts for Overbought, Oversold, Regular and Hidden Bearish/Bullish Divergences.
Let me know if you have any questions! Enjoy :)

Encounters Pro - Free versionThe Encounters Pro indicator is a general-purpose tool to improve the capacity of forecasting future market price moves.
This free version has one engine active and a second engine partially active between 15h and 17h UTC.
This indicator does not provide buy, sell or hold signals ; instead, it helps to determine the future direction of prices .
How to read it:
The engines must be tracked from bottom to the top. Red color is bearish or descending and green color is bullish or ascending. The upper engine (line) is the one that represents the immediate price direction, take it into consideration.
When two or more consecutive engines change, sequentially, from bottom to top, and they have, after this process, the same color, it may indicate that price is about to move in that direction. However, that is not enough, the trend must be already present or you must have a sound technical reason to validate the idea provided by the Encounters Pro indicator.
There are four examples on the image above.
Case 1 is a valid signal because the three upper engines changed from red to green, from bottom to top: firstly the third one, then the second one and, finally, the first one on top.
Case 2 would not be a valid singnal considering that the third engine was red before the first one turned green. However, it was a valid bullish signal because the fourth level was green before the second and the first.
Case 3 is not a valid signal because the first engine is green and the rest are red.
Case 4 is not a valid signal because the sequence goes from top to bottom and it is mandatory that the sequence goes from the bottom or lower engines to the ones on top.
Two engines switching color at the same time are valid. This is the only exception to the bottom to top rule.
The engines
The first one (the top one) leads the rest from the temporal perspective, but it is the weaker one. The sencond and rest of lines, to the bottom, reflect an increasing directional strength, and may represent deeper effects on market prices. You will have to carefully examine the chart, with historical data, and observe how price reacts as you spot different patterns among the engines of the Encounter Pro indicator.
On the main image above, the green arrows show a clear bullish tendency upon London Markets open time, for instance.
The slope and the engine position
The lines should be considered in terms of their slope and position. An ascending line is a bullish strength signal, even if a red color temporarily appears, specially if above the middle level of the engine. When the lines are on top, it means the engine is gauging the maximum possible bullish pressure, but if the line were falling at the same time, above the middle level, the bullish implication of that engine would be significantly lower.
Conversely, when lines are either stalling or close to the bottom, it is a signal of bearish increasing power.

Sup/Res Levels [QuantVue]Shows basic pivot point of support and resistance levels. Will show alerts for break of sup. or res. Allows for a volume filter for sup. res. breaks as well.
"B" means break of either a Sup. or Res. level with volume greater than the threshold.
"Bull/Bear Wick" means bullish/bearish candle on break.
Left - number of bars left hand side of the pivot .
Right - number of bars right hand side of the pivot .
Volume Thres. - the threshold value (%) for the Volume.
This indicator is useful to filter our insignificant breaks of sup. or res. Can help trader determine when to sit on their hands, or enter a trade.

Fibonacci Breakout Target LevelsFibonacci Extension
Fibonacci Extension is a powerful technical analysis tool that traders use to predict where the market might find support and resistance. It is based on the Fibonacci sequence and uses levels that are found by extending the 23.6%, 38.2%, 50%, 61.8%, and 100% Fibonacci ratios from a swing high or low. These levels can be used to find possible areas of support and resistance, and traders often use them to figure out when to get into or get out of a trade.
What does this indicator do?
This indicator gets five levels of the Fibonacci Extension and uses it for both the low and the high. The default lookback period is 10 days, and it checks for the highest and lowest price in that period. Then it calculates the extension levels and plots them, and it also adds a line that shows you the current breakout target levels.
How to use?
The primary use intended for this indicator is to be used to determine possible breakout target levels. Let's say you are trading a range and a breakout happens. You can use this indicator to determine possible take-profit zones and possible support and resistance zones.
Features:
Change the lookback period for the Fibonacci Extension levels.
Disable the Fibonacci Bands if you just want to see the FIB levels.
You can also change the 5 levels and add different Fibonacci numbers.
In this image, you can see how you can use this indicator to determine take-profit levels. The Fibonacci Extensions will determine potential support and resistance levels, which could be good places to exit your long or short positions.

Power Indicator - EMAs + VWAP + Volume BarThe Power Indicator is intended to return some exponential moving average, vwap, volume bar, and others. With this compilation, you will be able to use them as one indicator in Trading View.
The components are:
- EMA9 - Exponential Moving Average of 9 days
- EMA21 - Exponential Moving Average of 21 days
- EMA50 - Exponential Moving Average of 50 days
- EMA200 - Exponential Moving Average of 200 days
- Volume Bar - This indicator provides the volume of the candle and its strength by showing different colors. It's a way to check expressive volume in one bar.
- Vwap line
- Indicator
If you have any questions, let me know!
Flying Dragon Trend IndicatorFlying Dragon Trend Indicator can be used to indicate the trend on all timeframes by finetuning the input settings.
The Flying Dragon Trend family includes both the strategy and the indicator, where the strategy supports of selecting the optimal set of inputs for the indicator in each scenario. Highly recommended to get familiar with the strategy first to get the best out of the indicator.
Flying Dragon Trend plots the trend bands into the ribbon, where the colours indicate the trend of each band. The plotting of the bands can be turned off in the input settings. Based on the user selectable Risk Level the trend pivot indicator is shown for the possible trend pivot when the price crosses the certain moving average line, or at the Lowest risk level all the bands have the same colour. The trend pivot indicator is not shown on the Lowest risk level, but the colour of the trend bands is the indicator instead .
The main idea is to combine two different moving averages to cross each other at the possible trend pivot point, but trying to avoid any short term bounces to affect the trend indication. The ingenuity resides in the combination of selected moving average types, lengths and especially the offsets. The trend bands give visual hint for the user while observing the price interaction with the bands, one could say that when "the Dragon swallows the candles the jaws wide open", then there is high possibility for the pivot. The leading moving average should be fast while the lagging moving average should be, well, lagging behind the leading one. There is Offset selections for each moving average, three for leading one and one for the lagging one, those are where the magic happens. After user has selected preferred moving average types and lengths, by tuning each offset the optimal sweet spot for each timeframe and equity will be found. The default values are good enough starting points for longer (4h and up) timeframes, but shorter timeframes (minutes to hours) require different combination of settings, some hints are provided in tooltips. Basically the slower the "leading" moving average (like HMA75 or HMA115) and quicker the "lagging" moving average (like SMA12 or SMA5) become, the better performance at the Lowest risk level on minute scales. This "reversed" approach at the minute scales is shown also as reversed colour for the "lagging" moving average trend band, which seems to make it work surprisingly well.
The Flying Dragon Trend does not necessarily work well on zig zag and range bounce scenarios without additional finetuning of the input settings to fit the current condition.

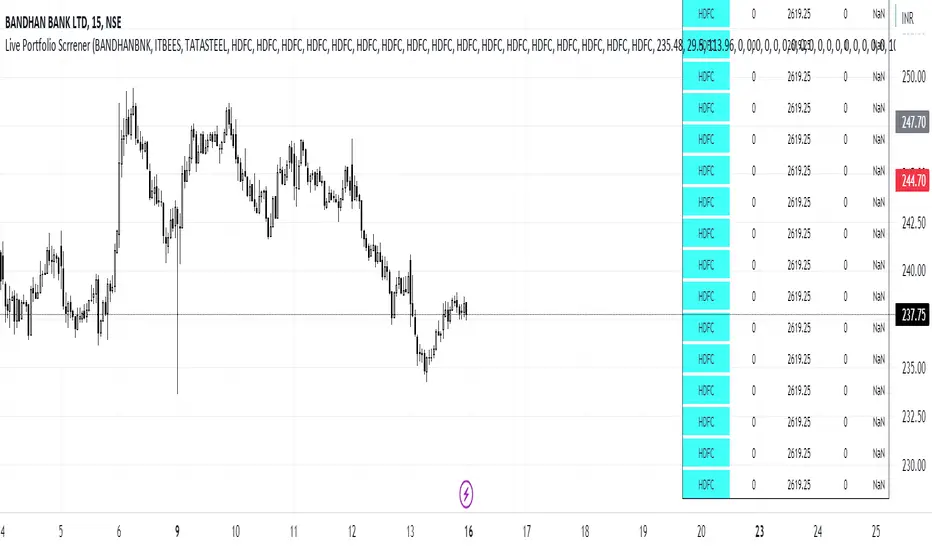
Live Portfolio ScreenerThe live portfolio screener indicator is a tool that help users to track the performance of their investments in real-time. The indicator provides a detailed breakdown of the user's portfolio, including the current profit and loss (P&L) for each stock that is invested in. This allows users to quickly and easily see how their portfolio is performing and make informed decisions about their investments on charts. Overall, this tool is an essential tool for anyone looking to stay on top of their investments and make data-driven decisions.
This indicator can load any symbol globally usable.
How to use this indicator ?
in this indicator firstly
you have add script name. (For example if you want to add symbol you have add in 's01 ' means the first symbol)
after that
you have to add price for each (For example if you want to add buy price for the first symbol then add the buy price in ' Bp01 ')
then the quantity comes in picture which is below price list and named here as Bq01 which means 'Buy quantity for first symbol'
Trendly
╭━━━━╮╱╱╱╱╱╱╱╱╭┳╮
┃╭╮╭╮┃╱╱╱╱╱╱╱╱┃┃┃
╰╯┃┃┣┻┳━━┳━╮╭━╯┃┃╭╮╱╭╮
╱╱┃┃┃╭┫┃━┫╭╮┫╭╮┃┃┃┃╱┃┃
╱╱┃┃┃┃┃┃━┫┃┃┃╰╯┃╰┫╰━╯┃
╱╱╰╯╰╯╰━━┻╯╰┻━━┻━┻━╮╭╯
╱╱╱╱╱╱╱╱╱╱╱╱╱╱╱╱╱╭━╯┃
╱╱╱╱╱╱╱╱╱╱╱╱╱╱╱╱╱╰━━╯
About the script:
This script is an easy-to-use trend indicator, which is based on another popular indicator called "Supertrend" . The basic idea is very simple, i.e. to compute Average True Range(ATR) and use that as the basis for trend detection. The key difference lies in a custom trend detection method, that computes trends across different timeframes and projects them in a table view. The script also tries to improve the behaviour of the existing indicator by highlighting flat regions on the chart, indicating sideways market or potential trend reversals.
How to use it:
You can use it just like any other indicator, add it to your chart and start analysing market trends. Results can be interpreted as follows.
Indicator output is currently made up of two main components:
>> Trend Table:
Appears at the bottom right of your screen
Contains trend indicator for 9 different timeframes
Timeframes can be adjusted using indicator settings panel
Green Up Arrow --> Up Trend
Red Down Arrow --> Down Trend
>> Enhanced Supertrend:
Shows up as a line plot on the chart
Green line indicates up trend
Red line indicates down trend
White regions indicates slow moving markets or a potential trend reversal
Indicator can be used on any timeframe, it provides a view of current and historical market trend
Can be used as an indicator for entering/exiting trades
Can be used to build custom trading strategies

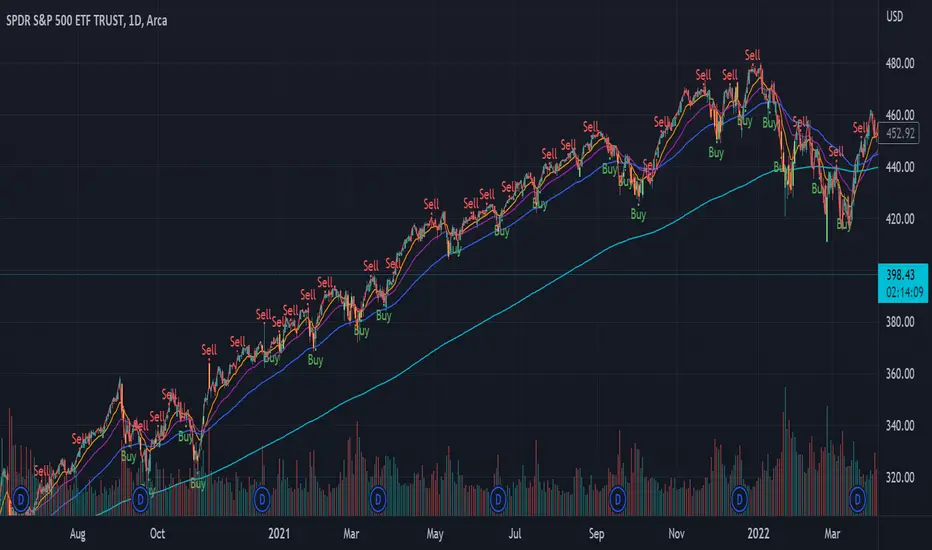
Investing ZonesInvesting Zones indicator shows the areas where LONGS or SHORTS can be made, the areas are calculated based on the mathematical averages of the high and low peaks of the price.
-There is an area called "No trading Zone" where the price is too slow, It also has a Alma Trend Ribbon (blue for uptrend, pink for downtrend) that helps to make trading decisions.
-You can make shorts when the price enters the Yellow zone called the "Sell Zone" and the price is below the Alma trend, set the TP1 in the white dotted line, and TP2 in the white lower line
-You can make longs when the price enters the Green zone called the "Buy Zone" and the price is above the Alma trend, set the TP1 in the yellow dotted line, and TP2 in the yellow upper line
-It works in all timeframes, personally I use it in 1min, 5min and 1hr.

S&P 500 Quandl Data & RatiosTradingView has a little-known integration that allows you to pull in 3rd party data-sets from Nasdaq Data Link, also known as Quandl. Today, I am open-sourcing for the community an indicator that uses the Quandl integration to pull in historical data and ratios on the S&P500. I originally coded this to study macro P/E ratios during peaks and troughs of boom/bust cycles.
The indicator pulls in each of the following datasets, as defined and provided by Quandl. The user can select which datasets to pull in using the indicator settings:
Dividend Yield : S&P 500 dividend yield (12 month dividend per share)/price. Yields following June 2022 (including the current yield) are estimated based on 12 month dividends through June 2022, as reported by S&P. Sources: Standard & Poor's for current S&P 500 Dividend Yield. Robert Shiller and his book Irrational Exuberance for historic S&P 500 Dividend Yields.
Price Earning Ratio : Price to earnings ratio, based on trailing twelve month as reported earnings. Current PE is estimated from latest reported earnings and current market price. Source: Robert Shiller and his book Irrational Exuberance for historic S&P 500 PE Ratio.
CAPE/Shiller PE Ratio : Shiller PE ratio for the S&P 500. Price earnings ratio is based on average inflation-adjusted earnings from the previous 10 years, known as the Cyclically Adjusted PE Ratio (CAPE Ratio), Shiller PE Ratio, or PE 10 FAQ. Data courtesy of Robert Shiller from his book, Irrational Exuberance.
Earnings Yield : S&P 500 Earnings Yield. Earnings Yield = trailing 12 month earnings divided by index price (or inverse PE) Yields following March, 2022 (including current yield) are estimated based on 12 month earnings through March, 2022 the latest reported by S&P. Source: Standard & Poor's
Price Book Ratio : S&P 500 price to book value ratio. Current price to book ratio is estimated based on current market price and S&P 500 book value as of March, 2022 the latest reported by S&P. Source: Standard & Poor's
Price Sales Ratio : S&P 500 Price to Sales Ratio (P/S or Price to Revenue). Current price to sales ratio is estimated based on current market price and 12 month sales ending March, 2022 the latest reported by S&P. Source: Standard & Poor's
Inflation Adjusted SP500 : Inflation adjusted SP500. Other than the current price, all prices are monthly average closing prices. Sources: Standard & Poor's Robert Shiller and his book Irrational Exuberance for historic S&P 500 prices, and historic CPIs.
Revenue Per Share : Trailing twelve month S&P 500 Sales Per Share (S&P 500 Revenue Per Share) non-inflation adjusted current dollars. Source: Standard & Poor's
Earnings Per Share : S&P 500 Earnings Per Share. 12-month real earnings per share inflation adjusted, constant August, 2022 dollars. Sources: Standard & Poor's for current S&P 500 Earnings. Robert Shiller and his book Irrational Exuberance for historic S&P 500 Earnings.
Disclaimer: This is not financial advice. Open-source scripts I publish in the community are largely meant to spark ideas that can be used as building blocks for part of a more robust trade management strategy. If you would like to implement a version of any script, I would recommend making significant additions/modifications to the strategy & risk management functions. If you don’t know how to program in Pine, then hire a Pine-coder. We can help!

Wave Fusion By CryptoScriptsThe Wave Fusion indicator is finally here! This indicator is a combination of the Wave Strength Oscillator and RSVP Extractor. It used a combination of momentum waves, volume, price, RSI, and statistical analysis to help nail down whenever the current price is overextended and due for a reversal. I'm currently using the 1D timeframe for BTC but feel free to experiment on different timeframes to see what works best for you. In the description below, I'll go over each signal, how it's derived, and how to use them!
Oversold (Green shaded area) - The oversold indication appears whenever all oscillators are oversold and is usually a good indicator that a reversal to the upside is around the corner (at least for a short period). Be advised these are the weakest of the three signals so I recommend using this signal with other indicators (such as my MFI Pro).
Overbought (Red shaded area) - The overbought indication appears whenever all oscillators are overbought and is usually a good indicator that a reversal to the downside is around the corner (at least for a short period). Be advised these are the weakest of the three signals so I recommend using this signal with other indicators (such as my MFI Pro).
Green Diamond - The green diamonds indicate whenever one or more oscillators are oversold AND one or more oscillators are outside of the bollinger bands, which is great for catching reversals to the upside. These may come two or three at a time so it may be best to wait until they have all printed before entering.
Red Diamond - The red diamonds indicate whenever one or more oscillators are overbought AND one or more oscillators are outside of the bollinger bands which is great for catching reversals to the downside (as seen in the chart). These may come two or three at a time so it may be best to wait until they have all printed before entering.
Rocket - The rocket symbol occurs whenever ALL oscillators are oversold and one or more oscillators are outside of the bollinger bands . This is great for catching reversals to the upside but may come two or three at a time so it may be best to wait until they have all printed before entering.
Red Alarm - The red alarm symbol occurs whenever ALL oscillators are overbought and one or more oscillators are outside of the bollinger bands . This is great for catching reversals to the downside but may come two or three at a time so it may be best to wait until they have all printed before entering.
Moon - The Moon symbol occurs whenever ALL oscillators are oversold and ALL oscillators are outside of the bollinger bands . This is great for catching reversals to the upside but may come two or three at a time so it may be best to wait until they have all printed before entering.
Blood Moon - The red alarm symbol occurs whenever ALL oscillators are overbought and ALL oscillators are outside of the bollinger bands . This is great for catching reversals to the downside but may come two or three at a time so it may be best to wait until they have all printed before entering.
Strongest to Weakest Buy Signals - Moon --> Rocket --> Green Diamond --> Green Shaded Area
Strongest to Weakest Sell Signals - Blood Moon --> Red Alarm --> Red Diamond --> Red Shaded Area
Input Options
Show Histogram - I also included a Histogram in the indicator to help gauge the level of buys/sell strength but kept it hidden for the default levels (i.e a green diamond with a red histogram bar is usually a good sign a reversal is about to happen to the upside whereas a green diamond with a green histogram bar may indicate a false reversal and there's still more room to the downside until a red bar appears. Always backtest this!)
Show Overbought/Oversold Levels - This is if you want to ignore all of the green/red shaded areas and only focus on the diamonds and rocket/alarm signals
Wave Overbought/Oversold Levels - Free free to change to value of the overbought/oversold levels to change where the green/red shades areas print
Momentum Overbought/Oversold Levels - Free free to change to value of the overbought/oversold levels to change where the green/red shades areas print
Histogram Length - This will not change anything with the signals but I included it so you can change the visuals if it helps you
Momentum Length - This will change where the signals plot
Momentum Signal - This only changes the yellow signal line and nothing else. It's not incorporated into any equation
Average Length - This will change where the signals plot
Alerts
I've set alerts on this indicator for each icon (Oversold, Overbought, Green Diamond, Red Diamond, Rocket, Red Alarm, Moon , Blood Moon). I HIGHLY recommend setting the alerts for Candle Close so that you can be sure the signal is confirmed.
You may notice that the indicator can give multiple signals back-to-back or be overbought/oversold for multiple candles. When this happens, it's best to look at other indicators such as the MFI Pro, MACD, etc to nail the best entry and have confluence with your decision. With that said, having multiple signals back-to-back can also be an indication that the move is close to happening. This indicator works with crypto and stocks as well.
If you have any questions or would like to purchase this indicator, please comment below or PM me. I also made a video tutorial for the indicator on my Youtube channel (link is next to my profile pic)
Be advised past performance is not indicative of future returns. Backtest EVERY timeframe and NEVER blindly take signals! Also, never invest more than you can afford to lose.
Enjoy :)
