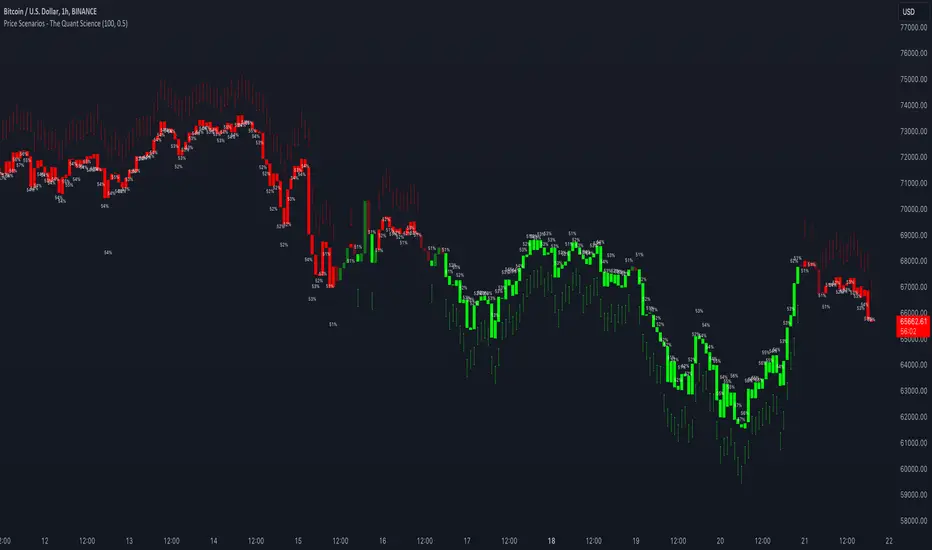
Price Scenarios - The Quant ScienceGENERAL OVERVIEW
Price Scenarios - The Quant Science is a quantitative statistical indicator that provides a forecast probability about future prices moving using the mathematical-statistical formula of statistical probability and expected value.
HOW TO USE
The indicator displays arrow-shaped signals that represent the probable future price movement calculated by the indicator, including the current percentage probability. Additionally, the candlesticks are colored based on the predicted direction to facilitate visual analysis. By default, green is used for bullish movements and red for bearish movements. The trader can set the analysis period (default value is 200) and the percentage threshold of probability to consider (default value is greater than 0.50 or 50%) through the user interface.
USER INTERFACE
Lenght analysis: with this features you can handle the length of the dataset to be used for estimating statistical probabilities.
Expected value: with this feature you can handle the threshold of the expected value to filter, only probabilities greater than this threshold will be considered by the model. By default, it is set to 0.50, which is equivalent to 50%.
Design Settings: modify the colors of your indicator with just a few clicks by managing this function.
We recommend disabling 'Wick' and 'Border' from the settings panel for a smoother and more efficient user experience.
Indicators
QQE MOD + SSL Hybrid + Waddah Attar Explosion IndicatorINDICATOR PURPOSE
This indicator is designed to complement my original QQE MOD + SSL Hybrid + Waddah Attar Explosion strategy.
Multiple users have requested that I convert the strategy to an indicator because alertconditions do not work on strategies and people want to specific set alerts for BUY, SELL, CLOSE BUY and CLOSE SELL. This can only be achieved using alertcondition().
This indicator functions in the exact same way as the strategy, but it doesn't have any backtesting functionality. I recomment that you use the original QQE MOD + SSL Hybrid + Waddah Attar Explosion strategy for parameter tuning and backtesting, then if you need more control on alerts you can use this indicator for that purpose.
Only other difference is that I have added grey exit labels on the chart since it's not obvious where the exits would happen like it was in the strategy version.
CREDITS
QQE MOD byMihkel00
SSL Hybrid by Mihkel00
Waddah Attar Explosion by shayankm

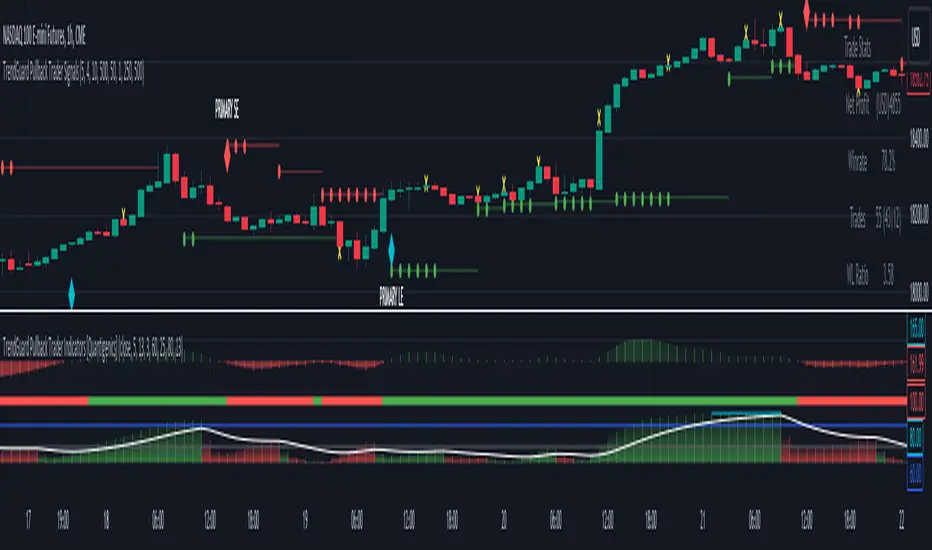
TrendGuard Pullback Trader Indicators [Quantigenics]The 'TrendGuard Pullback Trader Indicators' offers a synergistic representation of Trend Wave, Trend Pulse, and Trend Strength, each interrelated to provide intuitive and comprehensive market analysis—combining momentum, trend fluctuation insights, and trend strength in one cohesive tool.
The "TrendGuard Pullback Trader Indicators " utilize a novel approach in market trend analysis, distinctly combining multiple Exponential Moving Averages (EMA) layers for enhanced momentum tracking. This script employs a triple-layered EMA system for the Trend Wave component, adeptly filtering market noise and providing a refined view of underlying momentum. In parallel, the Trend Pulse feature contrasts current prices against a double-EMA of modified averages, offering granular insights into short-term market dynamics. This synergy is further enriched by the Trend Strength Identifier, which leverages the differential between fast and slow EMAs. This element is key in distinguishing significant market trends from minor fluctuations, thus offering a comprehensive gauge of market sentiment. These components, while advanced in their individual functionalities, are integrated to provide a holistic market analysis tool, far surpassing the capabilities of standard trend-following indicators. This sophisticated integration, underpinned by complex mathematical modeling, ensures that the "TrendGuard Pullback Indicators" script is not just a collection of indicators but a refined, cohesive system for strategic trading.
Integrated Analysis System: Trend Wave, Trend Pulse, and Trend Strength Identifier:
Trend Wave : Advanced Momentum Analysis
Calculation : Implements an advanced smoothing technique using a triple-layered Exponential Moving Average (EMA). This complex approach reduces market noise by refining the momentum tracking algorithm, thereby enhancing trend line smoothness.
Output : The output is visualized as a color-changing histogram, pivoting from green to red to indicate bullish and bearish momentum. This histogram is based on a scaled and adjusted Trend Wave value, providing a nuanced understanding of market momentum shifts.
Trend Pulse : Precision in Short-term Market Dynamics
Design : Contrasts a unique combination of high and low prices with their double EMA, diverging from standard closing price analysis. This results in a dynamic indicator sensitive to immediate market shifts.
Function : Acts as a vital complement to Trend Wave, offering fine-grained insights into short-term market behavior. It enhances the overall system by adding depth to the trend context set by the Trend Wave
Trend Strength Identifier: In-Depth Trend Viability Assessment Mechanism
Mechanism : Utilizes a sophisticated differential EMA strategy, comparing fast and slow EMA outputs. The script’s complexity extends beyond basic EMA differences, incorporating advanced trend/noise ratio calculations and trend quality assessments.
Indicator Dynamics : Generates a histogram that colors and positions itself based on the strength and direction of market trends, further informed by calculated trend quality metrics. It crucially differentiates between major trends and minor market noise.
System Synergy :
The three components are designed to operate in unison, forming an integrated trading system. Their interrelation is not merely additive but synergistic, where each element informs and enhances the others, making them indispensable to one another.
This interconnected functionality blends the indicators, as each component is tailored to contribute to a unified decision-making process, rather than functioning as standalone entities. The system's unique construction and its reliance on the interplay between its components underscore its distinctiveness and necessity for combined usage.
How to Trade with the "TrendGuard Pullback Trader Indicators"
Integration with "TrendGuard Pullback Signals" script :
The "TrendGuard Pullback Trader Indicators" script is an integral part of the "TrendGuard Pullback Trader" system, designed to operate in tandem with the "TrendGuard Pullback Trader Signals" script. This script amalgamates three sophisticated indicators, each contributing a unique perspective to market analysis.
This script, while useful as a standalone trading method, is one part of a two-part system. The “TrendGuard Pullback Trader Signals” script can be found below:
Integrated Trend Analysis: Aligning Wave, Pulse, and Strength :
Trend Wave & Trend Pulse Alignment : Look for moments when both the Trend Wave and Trend Pulse indicate a similar direction (both turning green for bullish or red for bearish). This alignment often marks the beginning of a new primary trend.
Confirmation with Trend Strength : Ensure that the Trend Strength histogram supports the new trend. A rising histogram above the lower threshold (white line) indicates growing trend strength.
Assessing Trend Strength and Potential Exhaustion :
Monitoring Threshold Lines : The upper (blue) and lower (white) threshold lines are crucial. When the Trend Strength histogram crosses these lines, it signals significant market conditions:
Above the Upper Threshold (Blue Line): Indicates a very strong trend but be cautious of potential trend exhaustion. A peak above this line may signal that the trend is overstretched.
Below the Lower Threshold (White Line): Suggests a weak or emerging trend, potentially signaling a trend reversal or consolidation phase.
Determining Trending or Ranging Market :
Above Lower Threshold : If the Trend Strength histogram consistently stays above the lower threshold, it suggests a trending market. Use this phase for trend-following strategies.
Below Lower Threshold : When the histogram frequently falls below this line, it may indicate a ranging or choppy market. In such conditions, consider adopting range-bound strategies or tightening stop losses.
Practical Application :
Entry Points : Trades can be initiated when there’s an alignment in Trend Wave and Pulse, coupled with supportive readings in Trend Strength. For instance, long positions during a green Trend Wave and Pulse, with the Trend Strength histogram rising above the lower threshold and vice versa for short entries.
Exit Points and Profit Taking : Consider exiting or taking profits when the Trend Strength crosses above the upper threshold, indicating potential trend exhaustion, especially if the trend strength histogram suddenly drops. Also, look for changes in the Trend Wave and Pulse for additional exit signals.
Alerts Setup : Utilize the provided alert features for key changes in the indicators, especially when the Trend Strength crosses threshold lines, to stay updated on significant market shifts.
Interpreting Indicator Interactions :
Refer to the accompanying images for visual examples of how these indicators interact and signal various market conditions. Understanding their synergy will enhance your ability to recognize key market phases and adjust your trading strategy accordingly.
The "TrendGuard Pullback Trader Indicators" script is intricately designed to be used in conjunction with the "TrendGuard Pullback Trader Signals" script, offering a cohesive and comprehensive trading strategy. Use both scripts together for a more robust trading method.
Adjustable Input Parameters
Each component in the script features customizable settings, designed to offer traders comprehensive control over the indicators. This flexibility allows for tailoring to specific trading styles, market conditions, and time frames. With options for adjusting visibility, selecting price types, modifying calculation lengths, and setting thresholds, these parameters ensure that the tool can be fine-tuned for a high degree of customization and precision, making it adaptable and effective for nearly all markets/symbols and time frames.
Important Usage Guidance: For seamless integration with its counterpart, the "TrendGuard Pullback Trader Signals" script, it's crucial to align the input parameter settings across both scripts. When adjusting values from their defaults, ensure that corresponding parameters in both scripts are identically set. This synchronization is key to achieving a cohesive and accurate representation on your charts.
Show Indicator Name (ShowName):
This parameter controls the display of the indicator's name on the chart. When enabled (`true`), it visually labels the indicator for ease of identification. Disabling (`false`) this feature offers a cleaner visual by removing the label.
Show Trend Wave Indicator (ShowTrendWave):
Activates or deactivates the Trend Wave indicator. When active (`true`), it displays a histogram based on the triple-layered exponential moving average (EMA) of the selected price type, providing a visual representation of market momentum trends. Deactivating (`false`) simplifies the chart by removing this histogram.
Trend Wave Price (TrendWavePrice):
Specifies the price data (close, open, high, low) used in calculating the Trend Wave. This choice affects how the Trend Wave responds to market movements, with each price type offering a different perspective on market momentum.
Trend Wave Length (TrendWaveLength):
Determines the overall calculation period for the triple-layered EMA in the Trend Wave, influencing its sensitivity. A higher value leads to a smoother, less volatile wave, focusing on longer-term market trends, whereas a lower value makes it more responsive to recent price actions.
Show Trend Pulse Indicator (ShowTrendPulse):
This parameter toggles the display of the Trend Pulse indicator, which analyzes the divergence between the current closing price and a double-EMA of a modified price average, providing insight into immediate market dynamics. Enabling (`true`) it adds this analysis to the chart, while disabling (`false`) removes it for focus on other trends.
Trend Pulse Length (TrendPulseLength):
Sets the length for the main double-EMA calculation in the Trend Pulse. A higher number smoothens the indicator, reducing sensitivity to minor price changes and highlighting more significant short-term trends.
Show Trend Strength Indicator (ShowTrendStrength):
Controls whether the Trend Strength indicator is displayed. This indicator uses a differential approach between fast and slow EMAs to assess the market's trend strength. Enabling it (`true`) provides a histogram view of the trend’s robustness, whereas disabling (`false`) omits this analysis.
Fast Average Length (FastAvgLen):
Specifies the period for the fast EMA in the Trend Strength indicator. Shorter periods make the EMA more sensitive to recent price changes, ideal for identifying new trend formations.
Slow Average Length (SlowAvgLen):
Determines the period for the slow EMA in the Trend Strength indicator. A longer period smoothens the EMA, useful for identifying sustained trend directions.
Threshold High (ThresholdHi):
This value sets a high threshold for the Trend Strength indicator. Values exceeding this threshold indicate a strong and established market trend, which can be critical for strategies focusing on trend continuity.
Threshold Low (ThresholdLow):
Defines a low threshold for the Trend Strength indicator. Values below this threshold suggest weak or emerging trends, signaling potential trend reversals or consolidations.
Threshold Trend (ThreshTrend):
Establishes a specific threshold within the Trend Strength indicator for identifying significant trends. Exceeding this threshold often suggests a trend with potential trading relevance.
Enable Threshold Low (ThresholdLowOnOff):
This option enables or disables the low threshold in the Trend Strength calculation. It allows traders to customize the indicator’s sensitivity to weaker trends.
Average Line (AvgLine):
Adjusts the period for an additional EMA line in the Trend Strength indicator. This line acts as a smoothing reference for the Trend Strength. This can also act as a threshold reference as when its below the ‘Threshold Low’ line this could identify sideways/choppy conditions.
Conclusion:
The "TrendGuard Pullback Trader Indicators" script provides a multidimensional analysis platform, combining in-depth momentum tracking, immediate market movement insights, and robust trend evaluation.
Remember, trading involves risk, and past performance is not indicative of future results.
You can see the “Author’s instructions" below to get immediate access to TrendGuard Pullback Trader Indicators & the rest of the “Quantigenics Premium Indicator Suite”.
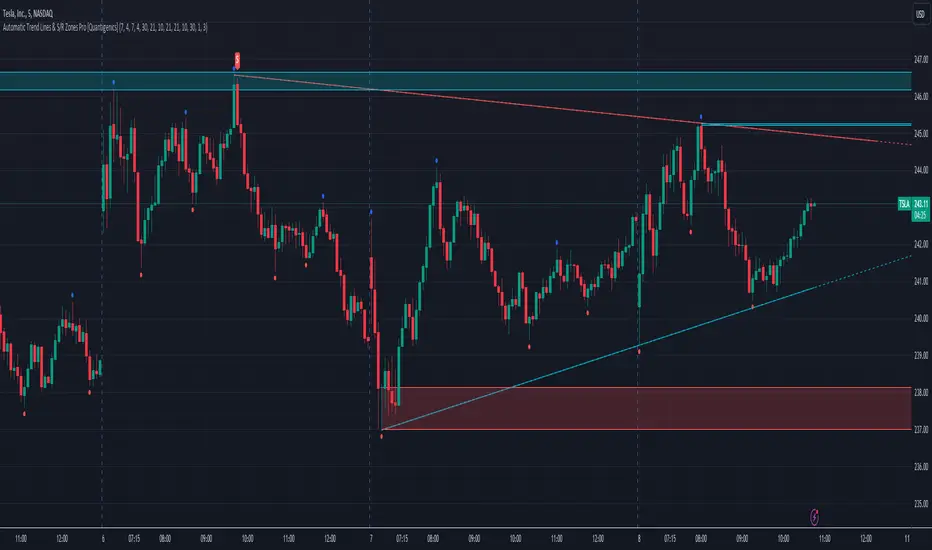
Automatic Trend Lines & S/R Zones Pro [Quantigenics]The “Automatic Trend Lines & S/R Zones Pro ” script is an innovative tool that integrates automated support and resistance zone identification with trend line generation. This script is an invaluable asset in technical analysis, adeptly identifying critical price reversal or breakout areas and drawing trend lines to gauge market direction and momentum. It generates trading signals based on support/resistance and trend line dynamics, making it a versatile standalone or complementary tool suitable for any market or time frame.
The "Automatic Trend Lines & S/R Zones Pro " script performs advanced financial chart analysis by algorithmically identifying support/resistance zones and generating trend lines It analyzes historical data, applying calculations like the highest and lowest price points over specified periods (defined by 'PeakOverBar' and 'LowOverBar' settings) to determine potential support and resistance zones. Trend lines are drawn by connecting significant price peaks and troughs, calculated based on user-defined strength parameters. The script also produces trading signals by analyzing price interactions with these zones and trend lines, using algorithms to detect breakouts or rejections, thus aiding traders in informed decision-making.
Technical Composition: a
Support and Resistance Zone Detection : Mechanism: Utilizes historical price data to identify key levels indicative of intense trading activity, revealing potential price stalling or reversals. These levels are marked based on past market actions and supply-demand dynamics.
Visualization: Zones are highlighted with colored boxes, enabling traders to easily spot shifts in market sentiment.
Automatic Trend Line Generation : Methodology: Connects significant price highs and lows over a designated period, customizable through inputs like PeakOverBar and LowOverBar.
Utility : These trend lines act as crucial indicators of uptrend support and downtrend resistance, aiding in the recognition of potential breakout or reversal zones and trend directions.
Customization and Flexibility : Adjustable Parameters: Includes customization options for peak/trough identification periods, trend line visibility, and extent of support/resistance zones.
Enhanced User Experience : Designed to be intuitive and adaptable, catering to diverse trading styles and strategies.
Usage in Trading :
Entry and Exit Points: The trade signals plotted at the support/resistance zones can be used for identifying both entry and exit points, in anticipation of price stalling and potentially reversing, and breakout signals plotted as price breaks trendlines can be used for breakout trading strategies, as well as stop loss areas.
Signal Alerts: Real-time alerts for significant interactions with trend lines or S/R zones, vital for both entry and exit strategies.
Integration with Other Systems: While effective as a standalone tool, it can also be used alongside other indicators for a more robust trading method.
Input Parameter Settings :
Intra-Bar Signal Generation (IntraBar) : Allows toggling between immediate signal generation within the current bar or after bar closure.
Peak and Low Over Bar (PeakOverBar, LowOverBar) : Sets the bar count for identifying market peaks and lows, adjustable for analyzing different market trends.
Strongest Peaks and Lows Period (StrongestFromPeaks, StrongestFromLows) : Determines the period for identifying significant market peaks and lows.
Show S/R Zones (ShowSRZones) : Enables the display of Support/Resistance zones for better market insight.
Trend Line Type (TrendLineType) : Offers options for trend line styles, like "One Line" or "Triple Lines."
Extend Trend Lines (ExtendTrendLines) : Configures the extension length of trend lines, useful for predicting future trends.
Peak and Low Trend Line Settings (ShowPeakTrendLine, ShowLowTrendLine, etc.) : Manage the display and characteristics of specific trend lines.
Signal Settings (ShowLabels, ShowBreakSignals, ShowPopUPSignals, etc.) : Customizes the appearance and frequency of signals and alerts.
Alert Settings (ShowTrendBreakSignals, ShowTrendPopSignals, etc.) : Configures alerts for significant market events like trend line breaks or rejections.
The "Automatic Trend Lines & S/R Zones Pro" script stands out as an essential tool for traders, offering comprehensive support/resistance and trend line analysis in a single package. Its automatic features, combined with customizable options, make it a key element in elevating market analysis and informed trading decision-making.
As always, remember that trading involves risks and past performance is not indicative of future results.
You can see the “Author’s instructions below to get immediate access to Automatic Trend Lines & S/R Zones Pro & the rest of the “Quantigenics Premium Indicator Suite”.
Targets For Overlay Indicators [LuxAlgo]The Targets For Overlay Indicators is a useful utility tool able to display targets during crossings made between the price and external indicators on the user chart. Users can display a series of two targets, one for crossover events and another one for crossunder event.
Alerts are included for the occurrence of a new target as well as for reached targets.
🔶 USAGE
In order for targets to be displayed users need to select an appropriate input source from the "Source" drop-down input setting. In the example above we apply the indicator to a volatility stop.
This can also easily be done by adding the "Targets For Overlay Indicators" script on the VStop indicator directly.
Targets can help users determine the price limit where the price might start deviating from an indication given by one or multiple indicators. In the context of trading, targets can help secure profits/reduce losses of a trade, as such this tool can be useful to evaluate/determine user take profits/stop losses.
Due to these essentially being horizontal levels, they can also serve as potential support/resistances, with breakouts potentially confirming new trends.
Users might be interested in obtaining new targets once one is reached, this can be done by enabling "New Target When Reached" in the target logic setting section, resulting in more frequent targets.
Lastly, users can restrict new target creation until current ones are reached. This can result in fewer and longer-term targets, with a higher reach rate.
🔹 Examples
The indicator can be applied to many overlay indicators that naturally produce crosses with the price, such as moving average, trailing stops, bands...etc.
Users can use trailing stops such as the SuperTrend or VStop to more easily create clean targets. Do note that certain SuperTrend scripts separate the upper and lower extremities of the SuperTrend into two different plot, which cannot be used with this tool, you may use the provided SuperTrend script below to have a compatible version with our tool:
//@version=5
indicator("SuperTrend", overlay = true)
factor = input.float(3, 'Factor', minval = 0)
atrLen = input.int(10, 'ATR Length', minval = 1)
= ta.supertrend(factor, atrLen)
plot(spt, 'SuperTrend', dir != dir ? na : dir < 0 ? #089981 : #f23645, 2)
plot(spt, 'Circles', dir > dir ? #f23645 : dir < dir ? #089981 : na, 3, plot.style_circles)
Using moving averages can produce more targets than other overlay indicators.
Users can apply the tool twice when using bands or any overlay indicator returning two outputs, using crossover targets for obtaining targets using the upper band as source and crossunder targets for targets using the lower band. We can also use the Trendlines with breaks indicator as example:
🔹 Dashboard
A dashboard is displayed on the top right of the chart, displaying the amount, reach rate of targets 1/2, and total amount.
This dashboard can be useful to evaluate the selected target distances relative to the selected conditions, with a higher reach rate suggesting the distance of the targets from the price allows them to be reached.
🔶 SETTINGS
Source: Indicator source used to create targets. Targets are created when the closing price crosses the specified source.
Show Target Labels: Display target labels on the chart.
Candle Coloring: Apply candle coloring based on the most recent active target.
🔹 Target
Crossover and Crossunder targets use the same settings below:
Show Target: Determines if the target is displayed or not.
Above Price Target: If selected, will create targets above the closing price.
Wait Until Reached: When enabled will not create a new target until an existing one is reached.
New Target When Reached: Will create a new target when an existing one is reached.
Evaluate Wicks: Will use high/low prices to determine if a target is reached. Unselecting this setting will use the closing price.
Target Distance From Price: Controls the distance of a target from the price. Can be determined in currencies/points, percentages, ATR multiples, or ticks.

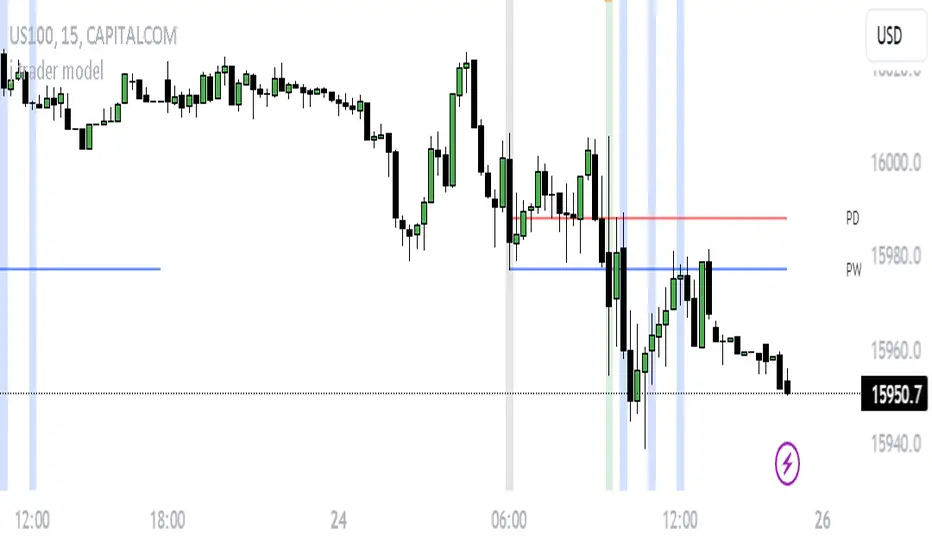
j trader ModelAn indicator designed to trade indices using the jtrader model and ICT concepts.
jtrader Model:
Below are the key points to trade this model:
Power of 3 is the key element of this model.
Accumulation during pre NY open.NY Open represents 9:30am opening of NY Stock Exchange.
Manipulation(JUDA) immediately after NY open. Juda is a manipulated move by the indices after the session open.
Distribution as a reversal with BOS ,Heatmap preferably during Macros. Distribution is market phase where it moves towards its original expansion during macros. Macros are 20 minute time windows where indices give moves with strong force. Heatmap represent kis point of interests for the trade.
Indicator Features:
Creates a complete window of trading with key elements needed to trade The jtrader Model.
Identify and marks key points of interests (POIs).
Identify and highlights key swing points of Sessions, Days, Weeks, True open etc.
Highlights the NY Open.
Highlights the Macros.
Indicator Settings:
Enable/Disable any POI marking.
Adjust session time ranges.
Adjust enabling of model poi marking time window.
Choose color of choice for highlighting the POI.
Enable/Disable Macros.
This indicator will gradually updated with new features to trade the jtrader model. Your feedback will help us improve and enhance this indicator.
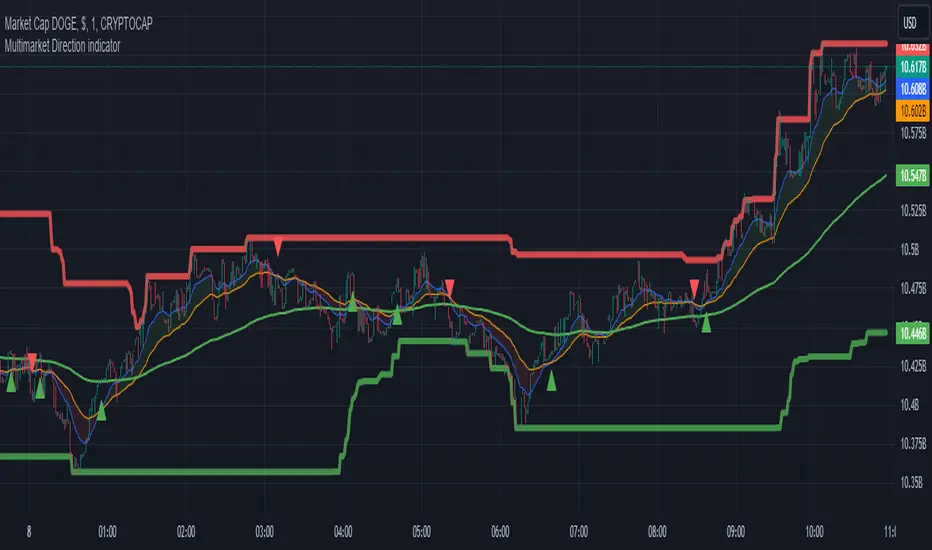
Multimarket Direction indicatorTrendline trading with resistant and support made by me.
Im bad coder and just jump into the tradingview pine script 1 days before so please don't hates me
- I don't know why my script is ded before lol
Signals to trade up
1. The big candles up cross the ema200 (last 5 candles for confirmation)
2. Wait for showing the up triangle.
3. Lookup the resistant/support line. If near the resistant please consider to wait if it break then join the trade
4. Only out trade when it has a down triagle or the candles has big down candles at the resistant/support line.
That it...
K`s Extreme DurationExtreme duration uses a special combination of the RSI and its relative position to deliver a reversal signal.
The following are the conditions to generate signals:
* Bullish signal: The current 8-period RSI is below 50 and above 35 while the previous 5 RSI's are below 35.
* Bearish signal: The current 8-period RSI is above 50 and below 65 while the previous 5 RSI's are above 65.

Breakout/Breakdown Indicator (30 Min Range) by InvestYourAsset👉The indicator provided here is a technical analysis indicator for TradingView users that identifies potential breakout and breakdown opportunities on the initial 30-minute range in every trading session.
👉The indicator high and low of the initial 30-minute period and plotting them as horizontal lines on the chart. The high is marked in green line and the low is marked in red line.
📈The indicator then generates buy and sell signals based on whether the current close price crosses above or below the previous 30-minute high and low, respectively.
📢The indicator also has two inputs:
👉 sessionStartHour : The hour at which the trading session begins. The default value is 9, However users can change the time according to their own trading style.
👉 sessionStartMinute : The minute at which the trading session begins. The default value is 0.
These inputs can be used to adjust the indicator to the specific trading session that you are interested in.
✅How to use the Indicator:
👉To use the 30 Minute Breakout/Breakdown Indicator, simply add it to your chart and configure the inputs to your liking. Once the indicator is added to the chart, it will plot the 30-minute high and low as horizontal lines, as well as generate buy and sell signals based on the current close price.
✅Here is a step-by-step guide:
📈Open TradingView and select the chart that you want to add the indicator to.
📈Click on the "Indicators" tab and search for "30 Minute Breakout/Breakdown Indicator by InvestYourAsset".
📈Click on the indicator to add it to your chart.
📈Configure the inputs to your liking. The default values are typically fine, but you can experiment with different values to see what works best for you.
📈Once you are satisfied with the settings, click on the "Apply" button.
📈The indicator will now be displayed on your chart. You will see two horizontal lines representing the previous 30-minute high and low, as well as triangles representing buy and sell signals.
✅How to interpret the signals:
📈Buy signal : A buy signal is generated when the current close price crosses above the previous 30-minute high. This suggests that the price is likely to continue moving higher in the short term.
📈Sell signal : A sell signal is generated when the current close price crosses below the previous 30-minute low. This suggests that the price is likely to continue moving lower in the short term.
👉Traders should remember that the present indicator is just one tool that can be used to identify potential trading opportunities. It is important to use other technical analysis tools and risk management techniques to confirm your trading signals before entering any trades.
✅Things to consider while using the indicator:
📈Look for buy signals in an uptrend and sell signals in a downtrend. This will increase the likelihood of your trades being successful.
📈Place your stop losses below the previous 30-minute low for buy signals and above the previous 30-minute high for sell signals. This will help to limit your losses if the trade goes against you.
📈Consider taking profits at key resistance and support levels. This will help you to lock in your profits and avoid giving them back to the market.
Follow us for timely updates regarding indicators that we may publish in future and give it a like if you appreciate the indicator.

Drawdown Dynamics IndicatorDescription :
The Drawdown Dynamics Indicator is a straightforward tool that offers insights into three critical aspects of an asset’s financial performance: Total Max Drawdown, Rolling Period Max Drawdown, and Current Max Drawdown. Inside of the indicator, you can select to view either the rolling period max drawdown or the all-time max drawdown. This is represented by the gray line. The blue line represents the asset's current drawdown.
Rolling Period Max Drawdown is more about a snapshot view, highlighting the maximum loss from a peak to a trough for an adjustable rolling time frame. This is a feature not available with other indicators that exist on TradingView.
Total Max Drawdown gives a broad view, showcasing the all-time deepest decline in an asset’s value.
Current Max Drawdown offers a live update, focusing on the asset's present phase and how it's performing in real-time.
Practical Uses :
The utility of this indicator becomes evident when you start exploring the risks and performance metrics of assets. A notable use of this indicator is in comparing the drawdowns of a trading strategy against the inherent drawdowns of an asset. It helps in painting a clearer picture of risk and performance of both the asset and the strategy.
Risk Understanding : By comparing the strategy drawdown to the asset drawdown, traders get to understand if the risk they’re taking aligns with the asset’s natural risk behavior.
Evaluating Strategy’s Strength : If a strategy can weather the storms of the asset's natural drawdown phases and come out relatively unscathed, it can speak to its strength.
Performance Comparison : It also acts as a benchmark tool. Traders can pit different strategies against each other, using the asset’s drawdown as a baseline, to see which one manages risks better.
Disclaimer : This is not financial advice. Open-source scripts I publish in the community are largely meant to spark ideas that can be used as building blocks for part of a more robust trade management strategy. If you would like to implement a version of any script, I would recommend making significant additions/modifications to the strategy & risk management functions. If you don’t know how to program in Pine, then hire a Pine-coder. We can help!

Auto Trailing stoploss By InvestYourAsset💥The Auto Trailing Stop-Loss indicator is a technical indicator that uses the ATR (Average True Range) to calculate a trailing stop-loss for both long and short positions.
💥The signals according to the indicator allows traders to exit from the position before its too late! The indicator can be used to determine when to enter and exit trades.
💥To use the indicator, you simply need to set the input parameters to suit your trading style and risk tolerance. The default values for the parameters are:
p: The ATR period (14)
q: The stop period (20)
x: The multiplier used to calculate the initial high and initial low (1.5)
Calculations:
📈Calculates the ATR using the specified period you can modify ATR period according to your trading style.
📈Calculates the initial high and low stop levels based on the highest high and lowest low over the user defined ATR period.
📈Calculates short and long stoploss levels using the initial high and low stops.
💥Once you have set the input parameters according to your trading style whether you are a day trader or a swing trader, the indicator will plot the short stoploss, long stoploss, and stoploss hit signals on your chart.
💥You can use the indicator to enter and exit trades in a various ways.
For example,
🚀 you could enter a long trade when the price crosses above both red and green lines plotted on the chart. (or when price crosses over both short stoploss and long stoploss.) You could also use the indicator to secure your profits by moving your stop-loss up as the price moves in your favor.
Here is an example of how you could use the indicator to enter and exit trades:
🚀Enter a long trade when the price crosses above the red line or short stoploss.
✅keep Moving your stop-loss upward with the long stoploss or green line.
✅Exit the trade when the price crosses below the long stoploss or green line.
💥You can also use the indicator to protect your existing trades. For example, if you are already in a long trade, you could move your stop-loss up to the short stop when the price moves up 10%. This will help you to protect your profits in case the price starts to move against you.
💥💥some additional tips for using the Auto Trailing Stop-Loss indicator:
✅Use the indicator in conjunction with other technical indicators or your own trading strategy to generate entry and exit signals.
✅Backtest your trading strategy before using it live to make sure that it is profitable.
✅Use the indicator to protect your profits by moving your stop-loss up as the price moves in your favor.
✅ Always follow risk management rules and manage your position sizing according to your risk appetite.
✅ Be aware of the overall trend direction. If the trend is up, you should be looking for bullish reversals or continuations. If the trend is down, you should be looking for bearish reversals or continuations.
This script essentially provides a visual representation of a trading strategy that automatically adjusts stop-loss levels based on market volatility (ATR). It also includes signals for entering long or short positions and visually highlights these signals on the chart.
📣📣Follow us for timely updates regarding future indicators and give it a like if you appreciate the work.📣📣

Kalman MomentumKalman Filter
The Kalman Filter is an algorithm used for recursive estimation and filtering of time-series data. It was developed by Rudolf E. Kálmán in the 1960s and has found widespread applications in various fields, including control systems, navigation, signal processing, and finance.
The primary purpose of the Kalman filter is to estimate the state of a dynamic system based on a series of noisy measurements over time. It operates recursively, meaning it processes each new measurement and updates its estimate of the system state as new data becomes available.
Kalman Momentum Indicator
This indicator implements the Kalman Filter to provide a smoothed momentum indicator using returns. The momentum in this indicator is calculated by getting the logarithmic returns and then getting the expected value.
The Kalman calculation in this indicator is used to filter and predict the next value based on the logarithmic returns expected value.
Here's a simplified explanation of the steps and how they are applied in the Script:
State Prediction: Predict the current state based on the previous state estimate.
Error Covariance Prediction: Predict the covariance of the prediction error.
Correction Step:
Kalman Gain Calculation: Calculate the Kalman gain, which determines the weight given to the measurement.
State Correction: Update the state estimate based on the measurement.
Error Covariance Correction: Update the error covariance.
In this Script, the Kalman Filter is applied to estimate the state of the system, with two state variables.
When the Kalman Momentum is above 0, there is positive momentum or positive smoothed expected value.
When the Kalman Momentum is below 0, there is negative momentum or negative smoothed expected value.
How to Use:
Trend Identification:
Positive values of the Kalman Momentum Indicator indicates positive expected value, while negative values suggest negative expected value.
You can look for changes in the sign of the indicator to identify potential shifts in market direction.
Volatility Analysis:
Observe the behavior of the indicator during periods of high and low volatility. Changes in the volatility of the Kalman Momentum Indicator may precede changes in market conditions.
Filtering Noise:
The Kalman Filter is known for its ability to filter out noise in time series data. Use the Kalman Momentum Indicator to filter out the noise in momentum to catch the trend more clearly.
Squeezes:
At time there may be squeezes, and these are zones with low volatility. What could follow after these zones are expansions and huge trending moves.
Indicator Settings:
You can change the source of the calculations.
There is also a lookback for the log returns.
Understanding Expected Value in Trading:
The Expected Value is a fundamental concept that shows the potential outcomes of a trading strategy or individual trade over a series of occurrences. It is a measure that represents the average outcome when a particular action is repeated multiple times.
Images of the indicator:

Swing based support and resistanceThis indicator provided here is for identifying swing-based support and resistance levels. It uses two swing lengths, which can be adjusted by the user, to identify swings in the price data. For each swing length, the script calculates the support level as the low of the swing if the trend is up, or the high of the swing if the trend is down. It then plots the support and resistance levels on the chart, along with buy and sell signals.
The buy and sell signals are generated by comparing the current closing price to the support and resistance levels. If the closing price is above the support level, the script plots a buy signal. If the closing price is below the level, the script plots a sell signal.
To use the script, you would first need to add it to your trading platform. Once it is added, you can configure the swing lengths and other parameters to suit your trading style. You can then apply the script to a chart and begin using the support and resistance levels and buy and sell signals to make trading decisions.
Points to be noted while using the indicator:
# The script is designed to be used on a daily chart. However, you can also use it on other timeframes, such as weekly or monthly charts.
# The swing lengths that you choose will depend on your trading style. If you are a swing trader, you may want to use longer swing lengths. If you are a day trader, you may want to use shorter swing lengths.
# Remember, the support and resistance levels generated by the script are not exact price points. They are rather zones where demand and supply can change. Therefore, you should always use other technical analysis tools and indicators to confirm your trading decisions.
# Overall, the script is a useful tool for identifying swing-based support and resistance levels. It can be used by traders of all experience levels to generate trading ideas and improve their trading performance.
To use the swing-based support and resistance indicator with respect to price, you can follow these steps:
=> Identify the support and resistance levels that have been generated by the indicator.
=> Look for price action that is taking place near these levels.
=> If the price is above the level, look for bullish reversals or continuations.
=> If the price is below the level, look for bearish reversals or continuations.
For Example,
=> Bullish reversal: The price is above the level and forms a bullish candlestick pattern, such as a bullish hammer or engulfing pattern.
=> Bullish continuation: The price is above the level and bounces off of the level.
=> Bearish reversal: The price is below the level and forms a bearish candlestick pattern, such as a bearish hammer or engulfing pattern.
=> Bearish continuation: The price is below the level and rejects the level.
$$ You can also use the indicator to identify potential trading entry and exit points. For example, you could enter a long trade when the price breaks above a resistance level and exit the trade when the price retraces to the resistance level. Or, you could enter a short trade when the price breaks below a support level and exit the trade when the price rallies to the support level.
This swing-based support and resistance indicator is just one tool that you can use to trade. You should always use other technical analysis tools and indicators, such as price action and trend analysis, to confirm your trading decisions.
Additionally:
=> Be aware of the overall trend direction. If the trend is up, you should be looking for bullish reversals or continuations. If the trend is down, you should be looking for bearish reversals or continuations.
=> Use a stop loss order to limit your risk on each trade.
=> Consider using a position sizing strategy to manage your risk.
=> Do your own research and backtest any trading strategy before using it in a live trading environment.
Follow us for timely updates regarding future indicators and give it a like if you appreciate the indicator.

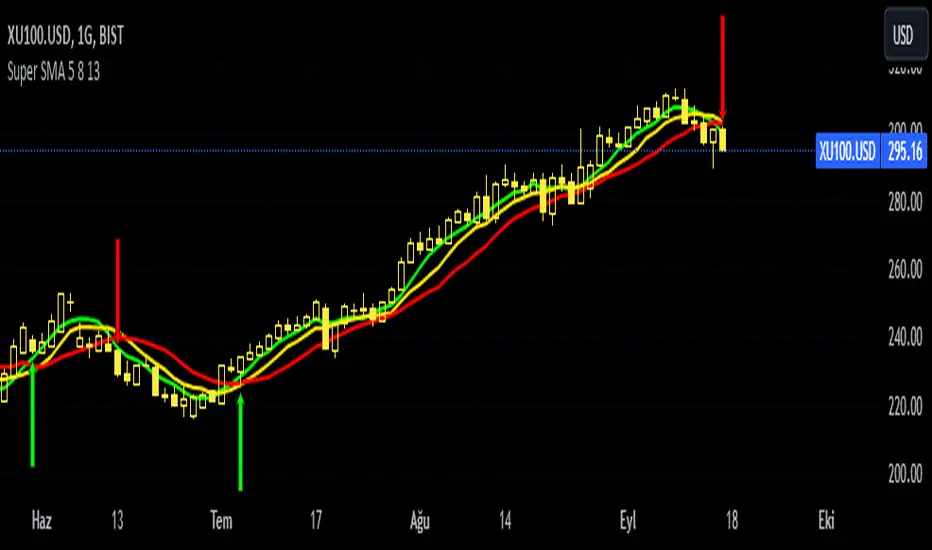
Super SMA 5 8 13This indicator is based on the 5 8 13 simple moving average strategy of strategist Selçuk Gönençler. The indicator shows buy and sell signals when favorable conditions occur.
══ H O W T O U S E ══
Above 5-8-13 - Confirmed hold/buy
5 below (8-13 above) - Be careful, lose weight but don't run away.
Below 5-8 (above 13) - Risk has begun. Don't be stubborn. 13 is your last castle.
5-8-13 below. Don't fight! Wait until it rises above 5-8 again.
SOFEX High-End Indicators + BacktestingBINANCE:BTCUSDT.P BINANCE:ETHUSDT.P
Introducing the first publicly available suite of indicators for Bitcoin and Ethereum by Sofex - the High-End Indicators & Backtesting System.
🔬 Trading Philosophy
The High-End Indicators & Backtesting system offers both trend-following and mean-reversal algorithms to provide traders with a deep insight into the highly volatile cryptocurrency markets, known for their market noise and vulnerability to manipulation.
With these factors in mind, our indicators are designed to sidestep most potentially false signals. This is facilitated further by the "middle-ground" time frame (1 Hour) we use. Our focus is on the two largest cryptocurrencies: Bitcoin and Ethereum , which provide high liquidity, necessary for reliable trading.
Therefore, we recommend using our suite on these markets.
The backtesting version of the Sofex High-End Indicators includes mainly trend-following indicators. This is because our trading vision is that volatility in cryptocurrency markets is a tool that should be used carefully, and many times avoided. Furthermore, mean-reversal trading can lead to short-term profits, but we have found it less than ideal for long-term trading.
The script does not aim to make a lot of trades, or to always remain in a position and switch from long to short. Many times there is no direction and the market is in "random walk mode", and chasing trades is futile.
Based on our experience, it is preferable if traders remain neutral the majority of the time and only enter trades that can be exited in the foreseeable future. Trading just for the sake of it ultimately leads to loss in the long-run.
Expectations of performance should be realistic.
We also focus on a balanced take-profit to stop-loss ratio. In the default set-up of the script, that is a 2% : 2% (1:1) ratio. A relatively low stop loss and take profit build onto our idea that positions should be exited promptly. There are many options to edit these values, including enabling trailing take profit and stop loss. Traders can also completely turn off TP and SL levels, and rely on opposing signals to exit and enter new trades.
Extreme scenarios can happen on the cryptocurrency markets, and disabling stop-loss levels completely is not recommended. The position size should be monitored since all of it is at risk with no stop-loss.
We take pride in presenting this comprehensive suite of trading indicators, designed for both manual and automated use. Although automated use leads to increased efficiency, traders are free to incorporate any of our indicators into their own manual trading strategy.
⚙️ Indicators
By default, all indicators are enabled for both Long and Short trades.
Extreme Trend Breakouts
The Extreme Trend Breakouts indicator seeks to follow breakouts of support and resistance levels, while also accounting for the unfortunate fact that false signals can be generated on these levels. The indicator combines trend-breakout strategies with various other volatility and direction measurements. It works best in the beginning of trends.
Underpinning this indicator are renowned Perry Kaufman's Adaptive Moving Averages (PKAMA) alongside our proprietary adaptive moving averages. These dynamic indicators adjust their parameters based on recent price movements, attempting to catch trends while maintaining consistent performance in the long run.
In addition, our modification of the TTM Squeeze indicator further enhances the Extreme Trend Breakouts indicator, making it more responsive, especially during the initial stages of trends and filtering of "flat" markets.
High-Volatility Trend Follower
The High-Volatility Trend Follower indicator is based around the logic of evading market conditions where volatility is low (choppy markets) and aggressively following confirmed trends. The indicator works best during strong trends, however, it has the downside of entering trades at trend tops or bottoms.
This indicator also leverages our proprietary adaptive moving averages to identify and follow high-volatility trends effectively. Furthermore, it uses the Average Directional Index, Aroon Oscillator, ATR and a modified version of VWAP, to categorize trends into weak or strong ones. The VWAP indicator is used to identify the monetary (volume) inflow into a given trend, further helping to avoid short-term manipulations.
Low-Volatility Reversal
The Low-Volatility Reversal aims at plugging the holes that trend-following indicators ignore. It specifically looks for choppy markets. Using proven concepts such as Relative Strength Index and volume measurements, among others, this indicator finds local tops and bottoms with good accuracy. It works best in choppy markets with low to medium volatility. It has a downside that all reversals have, losing trades at the end of choppy markets and in the beginning of big trends.
This indicator, like the others, employs PKAMA in conjunction with our proprietary adaptive moving averages, and an Average PSAR indicator to seek out "sideways" markets. Furthermore, Bollinger Bands with an adaptive basis line is used, with the idea of trading against the short-term trends by looking at big deviations in price movement. The above mentioned indicators attempt to catch local tops and bottoms in markets.
Adaptive Trend Convergence
The Adaptive Trend Convergence aims at following trends while avoiding entering positions at local bottoms and tops. It does so by comparing a number of adaptive moving averages and looking for convergence among them. Adaptive filtering techniques for avoiding choppy markets are also used.
This indicator utilizes our proprietary adaptive moving averages, and an Average Price Range indicator to identify trend convergence and divergence effectively, preventing false signals during volatile market phases. It also makes use of Bollinger Bands with an adaptive moving average basis line and price-action adjusted deviation. Contrasting to the Low-Volatility Reversal condition described above, the Bollinger Bands used here attempt to follow breakouts outside of the lower and upper bands.
Double-Filtered Channel Breakouts
The Double-Filtered Channel Breakouts indicator is made out of adaptive channel-identifying indicators. The indicator then follows trends that significantly diverge from the established channels. This aims at following extreme trends, where rapid, continuous movements in either direction occur. This indicator works best in very strong trends and follows them relentlessly. However, these strong trends can end in strong reversals, and the indicator can be stopped out on the last trade.
Our Double-Filtered Channel Breakouts indicator is built on a foundation of adaptive channel indicators. We've harnessed the power of Keltner Channels and Bollinger Band Channels, with a similar approach used in the Adaptive Trend Convergence indicator. The basis and upper/lower bands of the channels do not rely on fixed deviation parameters, rather on adaptive ones, based on price action and volatility. This combination seeks to identify and follows extreme trends.
Direction Tracker
The Direction Tracker indicator is made out of a central slower, adaptive moving average that clearly recognizes global, long-term trends. Combined with direction and range indicators, among others, this indicator excels at finding the long-term trend and ignoring temporary pullbacks in the opposite direction. It works best at the beginning and middle of long and strong trends. It can fail at the end of trends and on very strong historical resistance lines (where sharp reversals are common).
Our Direction Tracker indicator integrates an adaptive SuperTrend indicator into its core, alongside our proprietary adaptive moving averages, to accurately identify and track long-term trends while mitigating temporary pullbacks. Furthermore, it uses Average True Range, ADX and other volatility indicators to attempt to catch unusual moves on the market early-on.
📟 Parameters Menu
To offer traders flexibility, our system comes with a comprehensive parameter menu:
Preset Selection : Choose between Bitcoin or Ethereum presets to tailor the indicators to your preferred cryptocurrency market.
Global Signal Direction: Set the global signal direction as Long, Short, or Both, depending on your trading strategy.
Global Sensitivity Parameter : Adjust the system's sensitivity to adapt to different trend-following conditions, particularly beneficial during higher-strength trends.
Source of Signals : Toggle individual indicators on or off according to your preference. By default, all indicators are enabled. Customize the indicators to trade Long, Short, or Both, aligning them with your desired market exposure.
Confirmation of Signals : Set the minimum number of confirmed signals on the same bar, ensuring signals are generated only when specific confirmation criteria are met. The default value is one, and it can be adjusted for both Long and Short signals.
Exit of Signals : You have options regarding Take-Profit (TP) and Stop-Loss (SL) levels. Enable TP/SL levels to exit trades at predetermined levels, or disable them to rely on direction changes for exits. Be aware that removing stop losses can introduce additional risk, and position sizing should be carefully monitored.
By enabling Trailing TP/SL, the system switches to a trailing approach, allowing you to:
- Place an initial customizable SL.
- Specify a level (%) for the Trailing SL to become active.
- When the activation level is reached, the system moves the trailing stop by a given Offset (%).
Additionally, you can enable exit at break-even, where the system places an exit order when the trail activation level is reached, accounting for fees and slippage.
Alert Messages : Define the fields for alert messages based on specific conditions. You can set up alerts to receive email, SMS, and in-app notifications. If you use webhooks for alerts, exercise caution, as these alerts can potentially execute trades without human supervision.
Backtesting : Default backtesting parameters are set to provide realistic backtesting performance:
- 0.04% Commission per trade (for both entries and exits)
- 3 ticks Slippage (highly dependent on exchange)
- Initial capital of $1000
- Order size of $1000
While the order size is equal to the initial capital, the script employs a 2% stop-loss order to limit losses and attempts to prevent risky trades from creating big losses. The order size is a set dollar value, so that the backtesting performance is linear, instead of using % of capital which may result in unrealistic backtesting performance.
Risk Disclaimer
Please be aware that backtesting results, while valuable for statistical overview, do not guarantee future performance in any way. Cryptocurrency markets are inherently volatile and risky. Always trade responsibly and do not risk more than you can afford to lose.

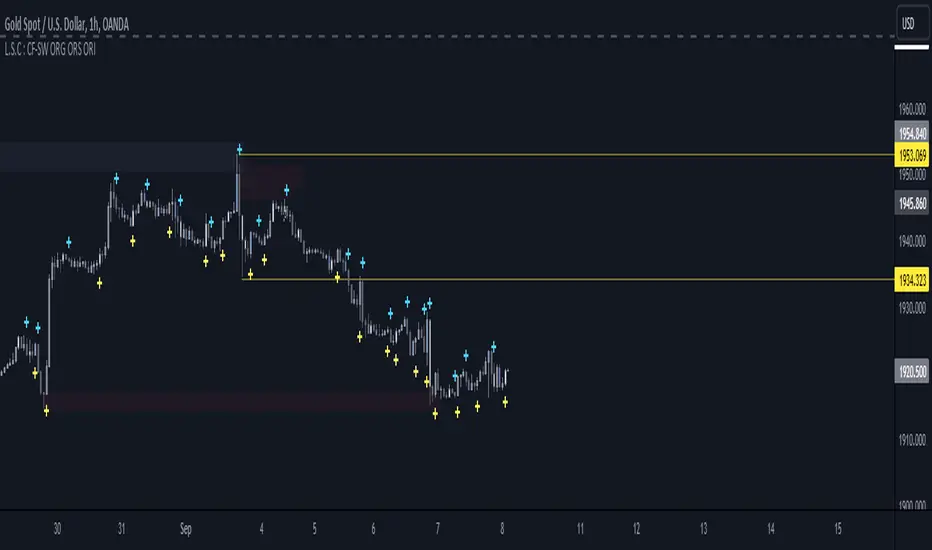
L.S.C : CF-SW ORG ORS ORIfor L.S.C Strategy
Green Curry with Chicken Ingredients:
Green curry paste: 70 grams
Chicken thigh meat: 300 grams
Coconut milk (thick): 250 milliliters
Coconut milk (thin): 400 milliliters
Sliced eggplant: 100 grams
Thai pea eggplant: 50 grams
Kaffir lime leaves: 3 leaves
Red bird's eye chili (sliced): 2 seeds
Holy basil leaves: 15 grams
Fish sauce: 1 tablespoon
Palm sugar: 1 tablespoon
Currency Pair Strategy [ICEALGO]Indicator for trading with currency pairs
Get Access to ICEALGO indicators: icealgo.com
All scripts & content provided by ICEALGO are for informational & educational purposes only. Past performance does not guarantee future results.

Advanced Optimized VSA - 15 MinThis script is written in Pine Script and is designed to be run on the TradingView trading platform. It is an advanced technical analysis indicator that utilizes various methods and indicators to generate trading signals based on a Volume Spread Analysis (VSA) approach.
Here's a detailed breakdown of its functionalities:
### Customizable Parameters:
1. `scoreLabel` and `TDLabel`: Customizable labels for score and trend direction.
2. `labelColorScore` and `labelColorTD`: Colors for the score and trend direction labels.
### Base Indicators and Variables:
1. `spread`: Calculates the difference between the high and low of a candle.
2. `emaVolume`: Exponential moving average of volume over a 21-period range.
3. `rsi14`: Relative Strength Index (RSI) over a 14-period range.
4. `sma200` and `ema50`: Simple moving average over a 200-period range and exponential moving average over a 50-period range, respectively.
5. `volatility`: Calculates the 14-period Average True Range (ATR) to determine volatility.
6. `trendDirection`: Establishes the trend direction based on the SMA200.
### Risk Management:
1. `atrValue`: Calculates the value of the ATR.
2. `stopLoss` and `takeProfit`: Calculates the stop-loss and take-profit levels based on the ATR.
### MACD:
Computes the MACD line, signal line, and histogram.
### Volume Analysis:
1. `weightedVol`: Weighted volume.
2. `forceFactor`: Measures the strength of price movement in relation to volume.
### Support and Resistance:
1. `support` and `resistance`: Calculates support and resistance levels based on the most recent 50 periods.
### Liquidity Check:
1. `isLiquid`: Checks if an asset is sufficiently liquid.
### Score Calculation:
Evaluates various factors such as price position relative to support/resistance levels, RSI, MACD, strength of movement, and volatility to generate a score.
### Criteria for Final Signals:
1. `isBullSpread` and `isBearSpread`: Generates a bullish or bearish signal based on various factors, including the score, trend direction, and liquidity.
### Notifications:
Generates alert conditions for bullish and bearish signals.
### Graphical Elements:
Displays various indicators and signals on the chart, including stop-loss, take-profit, SMA200, EMA50, and support and resistance lines.
### Debugging Labels:
Shows labels on the chart for score and trend direction.
The goal is to provide a comprehensive picture of the current asset, taking into consideration various factors and generating potentially profitable trading signals.
################################################################### ITALIANO ########################################################################################
##############################################################################################################################################################################################
Questo script è scritto in Pine Script e progettato per essere eseguito sulla piattaforma di trading TradingView. È un indicatore di analisi tecnica avanzata che utilizza diversi metodi e indicatori per generare segnali di trading basati su un approccio Volume Spread Analysis (VSA).
Ecco un riepilogo dettagliato delle funzionalità:
### Parametri personalizzabili:
1. `scoreLabel` e `TDLabel`: Etichette personalizzabili per i punteggi e la direzione del trend.
2. `labelColorScore` e `labelColorTD`: Colori delle etichette per punteggio e direzione del trend.
### Indicatori e variabili base:
1. `spread`: Calcola la differenza tra il massimo e il minimo di una candela.
2. `emaVolume`: Media mobile esponenziale del volume con un periodo di 21.
3. `rsi14`: RSI (Relative Strength Index) con un periodo di 14.
4. `sma200` e `ema50`: Media mobile semplice con un periodo di 200 e media mobile esponenziale con un periodo di 50, rispettivamente.
5. `volatility`: Calcola l'Average True Range (ATR) con un periodo di 14 per determinare la volatilità.
6. `trendDirection`: Stabilisce la direzione del trend basata sulla SMA200.
### Gestione del rischio:
1. `atrValue`: Calcola il valore dell'ATR.
2. `stopLoss` e `takeProfit`: Calcola i livelli di stop-loss e take-profit basati sull'ATR.
### MACD:
Calcola le linee MACD, segnale e l'istogramma.
### Analisi del volume:
1. `weightedVol`: Volume ponderato.
2. `forceFactor`: Misura la forza del movimento del prezzo in relazione al volume.
### Supporto e resistenza:
1. `support` e `resistance`: Calcola i livelli di supporto e resistenza basati sui 50 periodi più recenti.
### Verifica della liquidità:
1. `isLiquid`: Verifica se un asset è sufficientemente liquido.
### Calcolo del punteggio:
Valuta diversi fattori come la posizione del prezzo rispetto ai livelli di supporto/resistenza, RSI, MACD, forza del movimento e volatilità per generare un punteggio.
### Criteri per i segnali finali:
1. `isBullSpread` e `isBearSpread`: Genera un segnale rialzista o ribassista basato su vari fattori, incluso il punteggio, la direzione del trend e la liquidità.
### Notifiche:
Genera condizioni di allarme per segnali rialzisti e ribassisti.
### Elementi grafici:
Visualizza diversi indicatori e segnali sul grafico, inclusi stop-loss, take-profit, SMA200, EMA50, e linee di supporto e resistenza.
### Etichette di debug:
Mostra etichette sul grafico per il punteggio e la direzione del trend.
L'obiettivo è fornire un quadro completo dell'asset corrente, prendendo in considerazione diversi fattori e generando segnali di trading potenzialmente profittevoli.

SmartVPSGTitle: Identifying Volume Spikes, Price Movements and Gap Ups: A TradingView Script
Introduction:
In the world of trading, identifying volume spikes and price movements can provide valuable insights into market trends and potential trading opportunities. In this article, we'll explore a TradingView script that helps traders visualize volume spikes, price up moves with volume spikes, and gap-up days on their charts.
Detecting Price Up Moves:
The script starts by calculating price up moves. It compares the current day's closing price with the previous day's closing price and checks if it has increased by 3% or more. This helps traders spot significant upward price movements.
Detecting Volume Spurts:
Next, the script focuses on detecting volume spikes, which are often associated with increased market activity and potential trading opportunities. It compares the current day's volume with the highest volume of the previous nine sessions. If the current volume exceeds all the volumes of the previous nine sessions, it is considered a volume spurt.
Example:
Let's consider a hypothetical scenario where we have the following volume data for a stock:
Day 1: 100,000
Day 2: 80,000
Day 3: 120,000
Day 4: 150,000
Day 5: 200,000
Day 6: 90,000
Day 7: 110,000
Day 8: 130,000
Day 9: 140,000
Day 10: 250,000 (current day)
To determine if there is a volume spurt on Day 10, the script compares the current day's volume (250,000) with the highest volume of the previous nine sessions. In this case, the highest volume among the previous nine sessions is 200,000 (on Day 5). Since the current day's volume (250,000) exceeds the highest volume of the previous nine sessions (200,000), it is considered a volume spurt.
Identifying Gap-Up Days:
Gap-up days occur when the market opens significantly higher than the previous day's close. To identify these days, the script compares the current day's low price with the previous day's high price. If the low price is greater than the previous day's high, it is marked as a gap-up day.
Visualizing the Findings:
To provide a clear visual representation of the identified patterns, the script uses different shapes and colors. First, it plots small red dots above the candles whenever a volume spurt is detected. These dots help traders quickly identify periods of increased volume activity.
For price up moves with volume spikes, the script utilizes blue triangular shapes below the candles. This allows traders to pinpoint instances where both price and volume are showing positive signs, indicating potential bullish movements.
Additionally, the script incorporates green candles to represent gap-up days. These candles help traders recognize days when the market opens with a significant upward gap, suggesting a potential shift in market sentiment.
Conclusion:
The TradingView script discussed in this article provides traders with a visual representation of volume spikes , price up moves with volume spikes , and gap-up days . By incorporating these visual cues into their analysis, traders can gain valuable insights into market trends and potential trading opportunities.
Remember, this script should be used for educational and informational purposes only and does not serve as financial advice or recommendations. Traders are encouraged to customize and modify the script according to their specific trading strategies and risk tolerance.
Share this script with other traders on TradingView to enhance their chart analysis and trading decisions.
PS: This TradingView script is designed to work specifically on the daily timeframe (daily candles). It calculates and identifies volume spurts based on the volume data of the daily timeframe. Since it is designed for the daily timeframe, it may not produce accurate results or work as intended on other timeframes.

VOLD Ratio (Volume Difference Ratio) by TenozenAnother helpful indicator is here! VOLD Ratio is calculated by the net volume of a buying candle, divided by the net volume of a sell candle.
Formula:
buying net volume/selling net volume
It's a simple indicator, but don't underestimate this simplicity. It's a powerful indicator that would help you to decide whether the volume is getting interested in the direction that the market would take. So assume when the market is above the Bollinger Bands, it means that the volume is at a buying extreme, by that, we could expect the market to get back towards the mean, as there is a lot of buying demand that entered the market. How about below the Bollinger Bands? it means that the volume is at a selling extreme, we could expect that there is a lot of volume getting in toward the sellers, so we could take advantage of the opportunity to go for a long. Lastly, the Bollinger Bands would help you guys to determine the liquidity of the market, if the Bollinger Bands get smaller over time, it means there is no interest for the market to enter yet, and if the Bollinger Bands get bigger over time, it means there is interest for the market to enter in the session.
Tips & Reminder:
- We shouldn't use this indicator by itself, make sure to use an Indicator that would help you guys to determine the momentum and the liquidity of the market.
- The higher the timeframe, the slower this indicator would signal an entry, by that use a smaller timeframe... I suggest using a 15M chart for the execution.
- Always trade in the medium-longterm direction if you want to have a high probability trade.
- Be patient in your execution, it's more likely the market would go higher or lower after going in the extreme of the Bollinger Bands.
Well, that's it! Hope you guys enjoy using this indicator, let me know if there is any question or suggestion. Ciao...

RSI MTF [Market Yogi]The Multi-Time Frame RSI with Money Flow Index and Average is a powerful trading indicator designed to help traders identify overbought and oversold conditions across multiple time frames. It combines the Relative Strength Index (RSI) with the Money Flow Index (MFI) and provides an average value for better accuracy.
The Relative Strength Index (RSI) is a popular momentum oscillator that measures the speed and change of price movements. It oscillates between 0 and 100 and is used to identify overbought and oversold conditions in an asset. By incorporating the RSI across multiple time frames, this indicator offers a broader perspective on market sentiment.
In addition to the RSI, this indicator also includes the Money Flow Index (MFI). The MFI is a volume-based oscillator that measures the inflow and outflow of money into an asset. It takes into account both price and volume, providing insights into the strength and direction of buying and selling pressure.
By combining the RSI and MFI across multiple time frames, traders gain a comprehensive understanding of market dynamics. The indicator allows for comparing the RSI and MFI values across different time frames, enabling traders to identify divergences and potential trend reversals.
Furthermore, this indicator provides an average value of the multi-time frame RSI, offering a consolidated signal that helps filter out noise and enhance the accuracy of trading decisions.
Key Features:
1. Multi-Time Frame RSI: Combines the RSI across different time frames to provide a comprehensive view of market sentiment.
2. Money Flow Index (MFI): Incorporates the MFI to gauge buying and selling pressure based on both price and volume.
3. Average Calculation: Computes the average value of the multi-time frame RSI to generate a consolidated trading signal.
4. Divergence Detection: Enables traders to spot divergences between the RSI and MFI values, indicating potential trend reversals.
5. Overbought and Oversold Levels: Highlights overbought and oversold levels on the RSI, aiding in timing entry and exit points.
The Multi-Time Frame RSI with Money Flow Index and Average is a versatile tool that can be applied to various trading strategies, including trend following, swing trading, and mean reversion. Traders can adjust the time frame settings to suit their preferences and trading style.
Note: It's important to use this indicator in conjunction with other technical analysis tools and indicators to validate signals and make informed trading decisions.

BBO-ALPHA-PHANTOMHello friends, this is the second time I am publishing this script, hopefully the description will be sufficient and you can use it reliably.
Script Description:
The script consists of several indicators and generates buy and sell signals based on their calculations. Here's a breakdown of the functions and indicators used in the script:
Moving Average Convergence Divergence (MACD):
Fast Length: The number of periods used for calculating the fast moving average.
Slow Length: The number of periods used for calculating the slow moving average.
Source: The price source used for calculations (default is the closing price).
Signal Smoothing: The number of periods used for smoothing the signal line.
Oscillator MA Type: The type of moving average used for the oscillator line (default is Exponential Moving Average).
Signal Line MA Type: The type of moving average used for the signal line (default is Exponential Moving Average).
Benefit: MACD is a trend-following momentum indicator that helps identify potential trend reversals, bullish or bearish market conditions, and generate buy and sell signals based on the crossovers of the oscillator and signal lines.
Relative Strength Index (RSI):
RSI Length: The number of periods used for calculating RSI.
RSI Source: The price source used for RSI calculations (default is (high + low + close) / 3).
MA Type: The type of moving average used for smoothing RSI values (default is Simple Moving Average).
MA Length: The number of periods used for smoothing RSI values.
Benefit: RSI is a momentum oscillator that measures the speed and change of price movements. It helps identify overbought and oversold conditions, potential trend reversals, and generate buy and sell signals based on the crossovers of RSI and its moving average.
Money Flow Index (MFI):
MFI Length: The number of periods used for calculating MFI.
Source: The price source used for MFI calculations (default is (high + low + close) / 3).
Benefit: MFI is a momentum indicator that uses both price and volume data to measure buying and selling pressure. It helps identify overbought and oversold conditions and potential trend reversals.
Directional Movement Index (DMI):
Signal Length: The number of periods used for smoothing the ADX line.
Length: The number of periods used for calculating DMI.
Benefit: DMI consists of three lines: ADX, +DI (Plus Directional Indicator), and -DI (Minus Directional Indicator). ADX measures the strength of a trend, while +DI and -DI indicate the direction of the trend. DMI helps identify trend strength, trend direction, and potential trend reversals.
Stochastic Oscillator:
SmoothK: The number of periods used for smoothing %K line.
SmoothD: The number of periods used for smoothing %D line.
Length RSI: The number of periods used for calculating RSI within Stochastic.
Length Stoch: The number of periods used for calculating Stochastic.
Benefit: Stochastic Oscillator is a momentum indicator that compares the closing price of an asset to its price range over a specific period. It helps identify overbought and oversold conditions and potential trend reversals.
Moving Averages (MA):
MA50: Simple Moving Average with a length of 50 periods.
MA200: Simple Moving Average with a length of 200 periods.
Benefit: Moving averages are commonly used to
Advantages of the script compared to common indicators:
Comprehensive analysis: The script combines several indicators such as MACD, RSI, MFI, DMI, Stochastic Oscillator and Moving Averages. It thus provides a broader and more comprehensive view of the market and its development.
Synergy of indicators: Using multiple indicators increases the reliability and confirmation of signals. Combining different indicators can provide potentially stronger and more accurate signals of a trend change.
Identifying Oversold and Overbought Levels: RSI, MFI and Stochastic Oscillator are used to identify oversold and overbought levels in the market. This can help uncover opportunities to buy or sell in line with these levels.
Identifying trends and their strength: DMI and Moving Averages help identify trends in the market and provide information about their strength. This can help traders in deciding the appropriate time to enter and exit the market.
Early signal generation: The script generates signals based on a combination of various indicators, which can help traders identify potential trading opportunities at an early stage.
The main thing for me is that it helps me from overtrading, I only trade when I get an alert or see it on the chart. I recommend
I find it best to trade in the 1h and 2h time frame. The shorter ones like 15min and 30min are perfect for me to get out of the position.
It is important to note that no indicator guarantees 100% accuracy in generating signals and trading on financial

Ratio To Average - The Quant ScienceRatio To Average - The Quant Science is a quantitative indicator that calculates the percentage ratio of the market price in relation to a reference average. The indicator allows the calculation of the ratio using four different types of averages: SMA, EMA, WMA, and HMA. The ratio is represented by a series of histograms that highlight periods when the ratio is positive (in green) and periods when the ratio is negative (in red).
What is the Ratio to Average?
The Ratio to Average is a measure that tracks the price movements with one of its averages, calculating how much the price is above or below its own average, in percentage terms.
USER INTERFACE
Lenght: it adjusts the number of bars to include in the calculation of the average.
Moving Average: it allows you to choose the type of average to use.
Color Up/Color Down : it allows you to choose the color of the indicator for positive and negative ratios.
