Crypto Liquidation Heatmap [LuxAlgo]The Crypto Liquidation Heatmap tool offers real-time insights into the liquidations of the top cryptocurrencies by market capitalization, presenting the current state of the market in a visually accessible format. Assets are sorted in descending order, with those experiencing the highest liquidation values placed at the top of the heatmap.
Additional details, such as the breakdown of long and short liquidation values and the current price of each asset, can be accessed by hovering over individual boxes.
🔶 USAGE
The crypto liquidation heatmap tool provides real-time insights into liquidations across all timeframes for the top 29 cryptocurrencies by market capitalization. The assets are visually represented in descending order, prioritizing assets with the highest liquidation values at the top of the heatmap.
Different colors are used to indicate whether long or short liquidations are dominant for each asset. Green boxes indicate that long liquidations surpass short liquidations, while red boxes indicate the opposite, with short liquidations exceeding long liquidations.
Hovering over each box provides additional details, such as the current price of the asset, the breakdown of long and short liquidation values, and the duration for the calculated liquidation values.
🔶 DETAILS
🔹Crypto Liquidation
Crypto liquidation refers to the process of forcibly closing a trader's positions in the cryptocurrency market. It occurs when a trader's margin account can no longer support their open positions due to significant losses or a lack of sufficient margin to meet the maintenance requirements. Liquidations can be categorized as either a long liquidation or a short liquidation.
A long liquidation occurs when long positions are being liquidated, typically due to a sudden drop in the price of the asset being traded. Traders who were bullish on the asset and had opened long positions will face losses as the market moves against them.
On the other hand, a short liquidation occurs when short positions are being liquidated, often triggered by a sudden spike in the price of the asset. Traders who were bearish on the asset and had opened short positions will face losses as the market moves against them.
🔹Liquidation Data
It's worth noting that liquidation data is not readily available on TradingView. However, we recognize the close correlation between liquidation data, trading volumes, and asset price movements. Therefore, this script analyzes accessible data sources, extracts necessary information, and offers an educated estimation of liquidation data. It's important to emphasize that the presented data doesn't reflect precise quantitative values of liquidations. Traders and analysts should instead focus on observing changes over time and identifying correlations between liquidation data and price movements.
🔶 SETTINGS
🔹Cryptocurrency Asset List
It is highly recommended to select instruments from the same exchange with the same currency to maintain proportional integrity among the chosen assets, as different exchanges may have varying trading volumes.
Supported currencies include USD, USDT, USDC, USDP, and USDD. Remember to use the same currency when selecting assets.
List of Crypto Assets: The default options feature the top 29 cryptocurrencies by market capitalization, currently listed on the Binance Exchange. Please note that only crypto assets are supported; any other asset type will not be processed or displayed. To maximize the utility of this tool, it is crucial to heed the warning message displayed above.
🔹Liquidation Heatmap Settings
Position: Specifies the placement of the liquidation heatmap on the chart.
Size: Determines the size of the liquidation heatmap displayed on the chart.
🔶 RELATED SCRIPTS
Liquidations-Meter
Liquidation-Estimates
Liquidation-Levels
Liquidity

NZTVolumeDESCRIPTION IN ENGLISH
🔶 INTRODUCTION
NZTVolume is an advanced indicator for TradingView , inspired by the mentor Almaz . It is intended to facilitate the analytical work of traders who actively use data on real trading volumes in their analysis. The indicator also has many features that simplify operation and provide great opportunities for analysis , including the key function - identification of effective and ineffective movements, which are described below.
🔶 CONTENT
This tool provides detailed visualization of real volume . Other features such as candlestick color change depending on volume, histogram display percentage change in volume , and display candles that have gained liquidity, but the most unique function is the determination of effective and ineffective movements, alerts for them are built into the indicator, and traders will have a unique opportunity by setting alerts to wait for the first effective movement (its meaning and description below) , all this is implemented through advanced computational algorithms applied in the code.
Key features include Real Volume Histogram, Dynamic Candle Color Change, Average Volume Table, Volume Percent Change, Liquidity taken Candle, Volume Moving Averages, Effective and ineffective movements with their lines, 3 types of customizable Volume Alerts.
🔶 LOGIC
🔹 Dynamic Candle Color Change (Изменять цвет свечей)
Candles change to a contrasting color if their volume exceeds that of the previous candle , differentiated into bullish and bearish , including settings for transparency and colors . Can be configured, enabled of or disabled.
🔹 Real Volume Histogram (Показывать гистограмму объемов)
Automatically retrieves data on volumes and shows it on a chart. Can be configured, enabled of or disabled.
🔹 Liquidity Taken Candle (Показывать свечу собравшую ликвидность)
A candle that has taken/captured liquidity , which is determined in the code by the high and low prices of the candle and the volume it has , is displayed on the histogram . Can be configured, enabled or disabled.
🔹 Percent Change Volume (Показывать гистограмму процентного изменения объема)
Calculates and displays volume percent changes on a histogram. Can be configured, enabled or disabled.
🔹 Effective and Ineffective movement/column (Показывать эффективные и неэффективные движения)
By calculating the average volatility of the last bars, as well as calculating the average volume of the last bars, comparing and contrasting them, we obtain the principle of effective and ineffective movement/column. The code includes alerts that allow you to notify the user when the first effective movement/candle appears, which can significantly improve trading and maintain concentration. Basically it's a specific column on histogram, but is called movement so that's it's easier to understand its logic.
🔹 Line of efficiency and inefficiency (Показывать линии эффективности и неэффективности)
These lines connect all effective and ineffective movements' highs on the histogram, allowing traders to practice, as well as build their trading strategy for the trading day.
🔹 Average Volume Table (Показывать таблицу со средним объемом)
Displays the average volume per bar for selected time intervals with the ability to customize the period . Can be configured, enabled or disabled.
🔹 Volume Moving Averages (Показывать среднюю скользящую объема)
Three lines corresponding to users' set time intervals show the change in volume with color and thickness settings. Can be configured, enabled or disabled.
🔹 Alerts (Во сколько раз объем свечи должен превышать предыдущую для алерта)
Alerts can be triggered by 3 conditions
1. if on the selected timeframe the volume of the current candle exceeds the volume of the previous candle by a user-specified number of times , an alert will be triggered.
2. if a liquidity candle appears on the selected timeframe , an alert is triggered.
3. if an effective column/movement appears on the selected timeframe, an alert is triggered.
It can be configured, enabled or disabled.
🔶 TECHNICAL SPECIFICATION AND UNIQUENESS
At the core of NZTVolume is a series of advanced algorithms that analyze volume data in real-time.
Some of them are:
Calculate average volumes by given time period (in hours).
Candles, that took liquidity - considers high volume and wicks' size.
Percent volume change histogram - calculate percent change of volume for every bar and shows it on graph.
Effective and ineffective movement - calculates by algorithm that considers average volume and average volatility, assuming that big market players will contribute the volume.
🔶 DEMONSTRATION OF HOW THE INDICATOR WORKS ON DIFFERENT ASSETS
NZTLevel + NZTVolume Together
🔶 SETTINGS
🔹 Candles (Свечи)
Enable/disable color changes of candles based on volume . Customize colors of contrasting and standard candles, adjust transparency.
🔹 Histogram Settings (Настройки Гистограммы)
Show volume histogram , show liquidity taken candle, show volume percent change histogram, show effective, ineffective movements, show efficiency/inefficiency line.
🔹 Display settings on the Histogram (Настройки отображения на Гистограмме)
Customizable colors for bullish, bearish, liquidity taken columns as well as for effective and ineffective movement/columns and for lines that connect them.
🔹 Table (Таблица)
Toggle the display of the average volume table, customize the background, and set time ranges (3 parameters, multi-timeframe support). Tables shows "average volume over 24/48/72 hours" in translation
🔹 Lines (Линии)
Option to display/hide average volume lines , select colors and thickness for each of the three lines.
🔹 Alerts (Алерты)
As was said before, there are 3 types of alerts , that can be turned off , there is a parameter can be chosen - How many times volume of the current candle should exceeds the volume of the previous candle to trigger alert
🔶 RECOMMENDATIONS FOR USE
It is recommended to set and save the indicator settings that best match your trading preferences to ensure efficiency and ease of use.
NZTVolume stands out among other indicators for its universal functions, versatility, simplicity of installation and setup, high performance, and extensive customization capabilities, making it an indispensable tool for traders of all levels.
The indicator was developed by Temirlan Tolegenov for NZT Trader Community, April 2024, Prague, Czech Republic
ОПИСАНИЕ НА РУССКОМ ЯЗЫКЕ
🔶 ВСТУПЛЕНИЕ
NZTVolume — это продвинутый индикатор для TradingView , вдохновленный ментором Алмазом . Он предназначен для облегчения аналитической работы трейдеров, которые активно используют данные о реальных объёмах торгов в своем анализе. Индикатор также имеет множество функций, которые упрощают работу и предоставляют большие возможности для анализа , включая ключевую функцию - выявление эффективных и неэффективных движений, которые описаны ниже.
🔶 СОДЕРЖАНИЕ
Индикатор обеспечивает детальную визуализацию реального объема . Другие функции, такие как изменение цвета свечей в зависимости от объема, отображение гистограммы процентное изменение объема и отображение свечи, собравшей ликвидность, но самой уникальной функцией является определение эффективных и неэффективных движений, оповещения по ним встроены в индикатор, и у трейдеров появится уникальная возможность установить оповещения на ожидание первого эффективного движения (его смысл и описание ниже). ) , всё это реализовано посредством продвинутых вычислительных алгоритмов, примененных в коде.
Ключевые функции включают в себя гистограмму реального объема, динамическое изменение цвета свечи, таблицу среднего объема, процентное изменение объема, свечу, взявшую ликвидности, скользящие средние объема, эффективные и неэффективные движения с их линиями, 3 типа настраиваемых параметров. Оповещения об объеме.
🔶 ЛОГИКА
🔹 Динамическое изменение цвета свечей (Изменить цвет свечей)
Свечи меняют цвет на контрастный , если их объем превышает объем предыдущей свечи , дифференцируются на бычьи и медвежьи , включая настройки прозрачности и цвета . Можно настроить, включить или отключить.
🔹 Гистограмма реального объёма (Показывать гистограмму объёмов)
Автоматически извлекает данные по объемам и отображает их на графике. Можно настроить, включить или отключить.
🔹 Свеча, собравшая ликвидность (Показывать свечу собравшую ликвидность)
Свеча, собравшая ликвидность , которая определена в коде максимальной и минимальной ценой свечи и объемом, который она имеет , отображается на гистограмма . Можно настроить, включить или отключить.
🔹 Процентное изменение объема (Показывать гистограмму процентного изменения объема)
Вычисляет и отображает процентные изменения объема на гистограмме. Можно настроить, включить или отключить.
🔹 Эффективные и неэффективные движения(Показать Эффективныеи неэффективные движения)
Рассчитав среднюю волатильность последних баров, а также вычислив средний объем последних баров, сравнивая и противопоставляя их, мы получаем принцип эффективного и неэффективного движения/столбца. В код включены оповещения, которые позволяют оповещать пользователя при появлении первого эффективного движения/свечи, что позволяет существенно улучшить торговлю и сохранить концентрацию. По сути, это отдельный столбец на гистограмме, но он называется движением, потому что так, его логику будет легче понять.
🔹 Линия эффективности и неэффективности (Показывать линии эффективности и неэффективности)
Эти линии соединяют хаи всех эффективных и неэффективных движений на гистограмме, позволяя трейдерам практиковаться, а также строить свою торговую стратегию на торговый день.
🔹 Таблица среднего объема (Показать таблицу со значением определения)
Отображает средний объем на бар для выбранных временных интервалов с возможностью настройки периода . Можно настроить, включить или отключить.
🔹 Скользящие средние объёма (Показать среднюю скользящую объём)
Три линии, соответствующие установленным пользователем временным интервалам , показывают изменение объема с настройками цвета и толщины. Можно настроить, включить или отключить.
🔹 Оповещения (Во сколько раз объем свечи должен превышать предыдущую для оповещения)
Оповещения могут быть вызваны тремя условиями
1. Если на выбранном таймфрейме объем текущей свечи превысит объем предыдущей свечи в заданное пользователем количество раз , сработает оповещение
2. Если на выбранном таймфрейме появляется свеча ликвидности , срабатывает оповещение
3. Если на выбранном таймфрейме появляется эффективный столбец/движение , срабатывает оповещение.
Это можно настроить, включить или отключить.
🔶 ТЕХНИЧЕСКИЕ ХАРАКТЕРИСТИКИ И УНИКАЛЬНОСТЬ
В основе NZTVolume лежит серия продвинутых алгоритмов, которые анализируют данные об объемах в режиме реального времени.
Некоторые из них:
Рассчёт средние объёмы за заданный период времени (в часах).
Свечи, снявшие ликвидность - учитывает большой объем и размер шпилей.
Процентное изменение объема на гистограмме — рассчитывает процентное изменение объема для каждого бара и отображает его на графике.
Эффективное и неэффективное движение - рассчитывается по алгоритму, учитывающему средний объем и среднюю волатильность, предполагая, что объем крупных игроков будет сигнализировать о намерении рынка и силе движения.
🔶 НАСТРОЙКИ
🔹 Свечи
Включить/отключить изменение цвета свечей в зависимости от объема . Настройте цвета контрастных и стандартных свечей, настройте прозрачность.
🔹 Настройки гистограммы
Показать гистограмму объема , показать свечу взятой ликвидности, показать гистограмму процентного изменения объема, показать эффективные и неэффективные движения, показать линию эффективности/неэффективности.
🔹 Настройки отображения на гистограмме
Настраиваемые цвета для бычьих, медвежьих, свечей, собравших ликвидность столбцов, а также для эффективных и неэффективных движений/столбцов и линий, которые их соединяют.
🔹 Таблица
Переключайте отображение таблицы среднего объема, настраивайте фон и устанавливайте временные диапазоны (3 параметра, мультитаймфрейм).
🔹 Линии
Возможность отобразить/скрыть линии среднего объема , выбрать цвет и толщину для каждой из трех линий.
🔹 Алерты
Как было сказано ранее, есть 3 типа оповещений , которые можно отключить , можно выбрать параметр — во сколько раз объем текущей свечи должен превышать объем предыдущей свечи, чтобы сработало оповещение.
🔶 РЕКОМЕНДАЦИИ К ИСПОЛЬЗОВАНИЮ
Рекомендуется установить и сохранить настройки индикатора, которые лучше всего соответствуют вашим торговым предпочтениям, чтобы обеспечить эффективность и простоту использования.
NZTVolume выделяется среди других индикаторов своими универсальными функциями, универсальностью, простотой установки и настройки, высокой производительностью и широкими возможностями настройки, что делает его незаменимым инструментом для трейдеров всех уровней.
Индикатор разработан Темирланом Толегеновым для международного сообщества NZT Trader , Апрель 2024, Прага, Чешская Республика.
The indicator is published in accordance and respect to all House Rules of the TradingView platform.
Индикатор опубликован в соответствии и уважением ко всем внутренним правилами платформы TradingView.

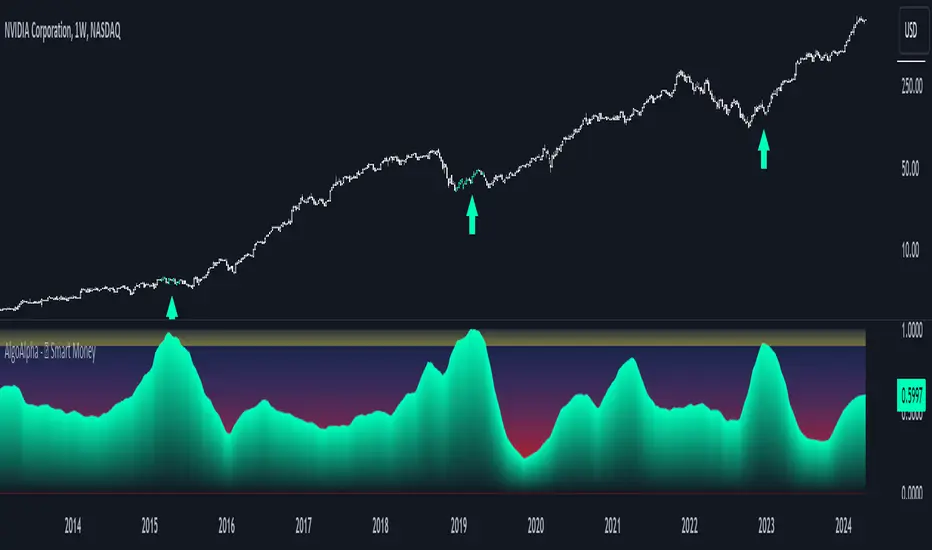
Smart Money Interest Index [AlgoAlpha]🌟 Smart Money Interest Index by AlgoAlpha 🌟
Welcome to the innovative Smart Money Interest Index indicator, designed meticulously by AlgoAlpha to revolutionize the way you trade! 📈🧠 This indicator is engineered to decipher the activities of smart money investors relative to the less informed (dumb money) and dynamically display their dominance in the trading landscape through a sophisticated visual index. 🚀💹
🔑 Key Features:
- Smart vs. Dumb Money Analysis: Tracks and compares the movements of smart money (informed investors) and dumb money (general public) within the market to identify potential investment signals.
- Relative Strength Index (RSI) Based Ratios: Utilizes RSI for both smart and dumb money to create a ratio that indicates buying or selling pressures.
- Dynamic Normalization: Employs a long-term peak normalization over a customizable period to ensure the index remains relevant regardless of market conditions.
- Visual Thresholds and Signals: Highlights significant shifts in market dynamics with color-coded thresholds, making it easier to spot changes at a glance.
🛠 How to Use the Smart Money Interest Index:
🔹 🚀 Step 1: Adding the Indicator
- Add the indicator to your favourites.
- Customize the settings according to your analysis needs:
- `Index Period`, `Volume Flow Period`, `Normalization Period`, `High Interest Threshold`
🔹 📊 Step 2: Interpretation of the Index
- Monitor the index plot; a rising index suggests increasing smart money interest, potentially indicating a buying opportunity.
- A value above the high interest threshold (in yellow) highlights significant interest by smart money, suggesting a good time to buy.
🔹 🔔 Step 3: Setting Alerts
- Configure alerts to notify you when the index crosses above the set threshold, enabling you to capitalize on trading opportunities timely and efficiently.
📐 Basic Logic Overview:
The Smart Money Interest Index by AlgoAlpha provides a unique metric that contrasts the investment behaviors of informed (smart money) and general (dumb money) investors. Utilizing the Relative Strength Index (RSI), this indicator evaluates the trading pressure exerted by both groups over specified periods, then forms a ratio of these activities to identify dominance in buying or selling trends. For example, when we see dumb money selling and smart buying, this suggests that the conditions for buying the asset is optimal as smart money is willing to buy the dip. The outputs are normalized against the highest values observed in a user-defined term to maintain consistency through varying market conditions. When the index exceeds a certain threshold, it suggests that smart money presence is particularly strong, possibly indicating that smart money is looking to enter positions on the asset. This tool serves as a sophisticated visual guide to understanding market dynamics and making well-informed trading decisions based on the activities of market-savvy investors. Smart money activity is identified during areas of low volume and the opposite for dumb money, the indicator uses the NVI and PVI metrics as its foundation for smart and dumb money analysis.
📊 Enhance Your Trading Strategy:
Leverage the Smart Money Interest Index to gain deeper insights into market dynamics and enhance your decision-making process with a powerful, data-driven approach. Whether you're looking to identify entry points or set strategic exits, this tool is designed to provide you with the competitive edge you need in the fast-paced world of trading. 🌐✨
Transform your trading with the power of smart money analysis—start using the Smart Money Interest Index today! 🚀🔔
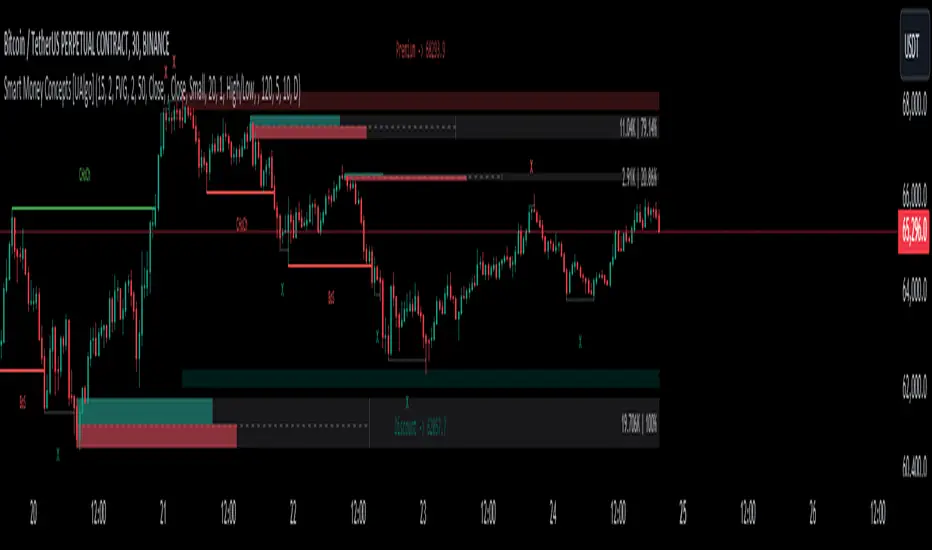
Volume Delta Candles [LuxAlgo]Volume Delta Candles provides insights about Intrabar trading activity in an easy-to-interpret manner. Lower timeframe or real-time data is used for displaying Volume Delta percentage against the total volume as a coloured bar part.
The script also highlights the intrabar price with the maximum trading activity, as well as complementary information.
🔶 USAGE
The tool focuses on intrabar volume to provide more information about the trading activity associated with a candle, without having to use an external volume indicator.
Each indicator components is further explained below:
🔹 Volume Delta
The volume delta is obtained by the difference between buy volume and sell volume, where buy volume is the volume associated with a bullish intrabar candle, and sell volume with a bearish intrabar candle.
Positive volume delta is displayed with a green candle area, while negative delta is displayed with a red candle area.
🔹 Bar Coloring
The script displays VD as a percentage of the whole, or from the candle half, depending on the setting ' Display '.
Bars can be coloured as follows:
Full (100%) when Display is set at ' Full Bar '
Half (50% or 100% of half a bar) when Display is set at ' Half Bar '
A negative VD (more bearish than bullish volume) will fill the bar from the top (or centre) of the bar towards the bottom, and a positive VD will fill a bar from the bottom (or centre) of the bar towards the top.
A negative VD on a green candle will show a red-coloured VD against a green-bordered candle. On the other hand, a positive VD on a red candle will show a green-coloured VD against a red-bordered candle.
Colours for VD sentiment opposite to the candle sentiment can be set differently if desired.
🔹 Highest Volume Price Level
The script displays a white (black on light mode) line highlighting the intrabar price level with the highest volume.
When ' Show Previous Max Volume Price ' is checked, a white (black on light mode) dot is displayed 1 bar to the right.
🔶 DETAILS
🔹 Tick/LTF data
The above example used Lower TimeFrame (LTF) data.
The following example uses real-time tick data ( Settings -> Data From )
Both options, LTF or tick data, will show a vertical dotted line where the data starts.
🔹 LTF settings
When ' Data from ' LTF is chosen and ' Auto ' enabled, the LTF will be the nearest possible x times smaller TF than the current TF. When 'Premium' is disabled, the minimum TF will always be 1 minute to ensure TradingView plans lower than Premium don't get an error.
Examples with current Daily TF (when Premium is enabled):
500 : 3 minute LTF
1500 (default): 1 minute LTF
5000: 30 seconds LTF (1 minute if Premium is disabled)
🔹 Notes
Different LTFs give different data, which means different results; this doesn't mean it isn't correct; they are just different data sets.
(LTF is displayed at the top right corner)
To ensure maximum visibility of values, we recommend using Bars from the Bar's style menu.
🔶 SETTINGS
Data from: Lower TimeFrame or real-time Tick data
Resolution: LTF setting
Auto + multiple: Adjusts the initial set resolution
Premium: Enable when your TradingView plan is Premium or higher
🔹 Intrabar Data
Colours
Display: Full/Half bar
Show previous max volume price: White/black dot, showing previous highest volume price level
🔹 Table
Show TF: Show LTF at the top right corner
Colour + table text size
🔹 Details
Show details: label with 'Volume', 'Delta' (VD) and '%'
See USAGE for more information

Market Structure Volume Distribution [LuxAlgo]The Market Structure Volume Distribution tool allows traders to identify the strength behind breaks of market structure at defined price ranges to measure de correlation of forces between bulls and bears visually and easily.
🔶 USAGE
This tool has three main features: market structure highlighting, grid levels, and volume profile. Each feature is covered more in depth below:
🔹 Market Structure
The basic unit of market structure is a swing point, the period of the swing point is user-defined, so traders can identify longer-term market structures. Price breaking a prior swing point will confirm the occurrence of a market structure.
The tool will plot a line after a market structure is confirmed, by default the lines on bullish MS will be green (indicative of an uptrend), and red in case of bearish MS (indicative of a downtrend).
🔹 Grid Levels
The Grid visually divides the price range contained inside the tool execution window, into equal size rows, the number of rows is user-defined so users can divide the full price range up to 100 rows.
The main objective of this feature is to help identify the execution window and the limits of each row in the volume profile so traders can know in a simple look what BoMS belongs to each row.
There is however another use for the grid, by dividing the range into equal-sized parts, this feature provides automatic support and resistance levels as good as any other.
Grid provides a visual help to know what our execution window is and to associate MS with their rows in the profile. It can provide S/R levels too.
🔹 Volume Profile
The volume profile feature shows in a visually easy way the volume behind each MS aggregated by rows and divided into buy and sell volume to spot the differences in a simple look.
This tool allows users to spot the liquidity associated with the event of a market structure in a specific price range, allowing users to know which price areas where associated with the most trading activity during the occurrence of a market structutre.
🔶 SETTINGS
🔹 Data Gathering
Execute on all visible range: Activate this to use all visible bars on the calculations. This disables the use of the next parameter "Execute on the last N bars". Default false.
Execute on the last N bars: Use last N bars on the calculations. To use this parameter "Execute on all visible range" must be disabled. Values from 20 to 5000, default 500.
Pivot Length: How many bars will be used to confirm a pivot. The bigger this parameter is the fewer breaks of structure will detect. Values from 1, default 2
🔹 Profile
Profile Rows: Number of rows in the volume profile. Values from 2 to 100, default 10.
Profile Width: Maximum width of the volume profile. Values from 25 to 500, default 200.
Profile Mode: How the volume will be displayed on each row. "TOTAL VOLUME" will aggregate buy & sell volume per row, "BUY&SELL VOLUME" will separate the buy volume from the sell volume on each row. Default BUY&SELL VOLUME.
🔹 Style
Buy Color: This is the color for the buy volume on the profile when the "BUY&SELL VOLUME" mode is activated. Default green.
Sell Color: This is the color for the sell volume on the profile when the "BUY&SELL VOLUME" mode is activated. Default red.
Show dotted grid levels: Show dotted inner grid levels. Default true.

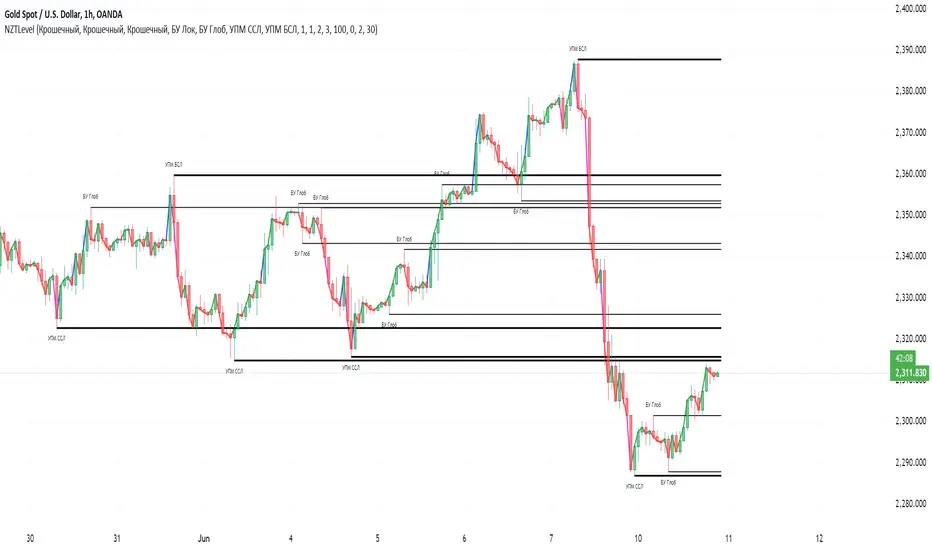
NZTLevelDESCRIPTION IN ENGLISH
🔶 INTRODUCTION
NZTLevel is an advanced indicator for TradingView, inspired by mentor Almaz , and designed to provide traders with in-depth analysis of market liquidity and the movements of key players.
🔶 CONTENT
Based on an analysis based on liquidity and tracking a key player , the indicator identifies Breaker levels and UPM (MarketMaker Position Level in RU), which help determine potential pivot points and market direction (trend) , and also shows a direction line , giving information about the state in which each candle is located on the chart (effort, consolidation or normal trend movement without effort), as well as the transparency of the candles , made specifically so that the direction line is clearly and clearly visible.
🔶 LOGIC
🔹Breaker Levels (Local and Global)
Breaker levels , divided into local and global , are identified through a detailed algorithm that takes into account the penetration of levels with high liquidity and the expected subsequent reaction of the market. These levels are visualized on the chart as lines, the color and thickness of which are customizable by the user, providing a clear understanding of the current market situation. Breaker levels allow us to determine the direction of the market , these are the levels from which we can expect a reaction, and after breaking through this level we receive valuable information
🔹UPM (Sell Stop and Buy Stop)
UPM monitors the activity of market makers and helps predict significant market movements . For example, if the last UPM indicates a buy stop, this signals the possibility of long positions, which is extremely valuable for traders looking to optimize their entries and manage risk.
🔹Directional line (Линия направленности)
The Indicator also includes a directional line that changes color depending on the strength and direction of the current movement , providing a visual representation of market trends and consolidation.
🔶 SETTINGS
🔹Text (Текст)
Allows you to configure or turn off/on the display of level text, specifying their type with text at the beginning of the level drawing (labels), as well as its size, the color of the level text at the top or bottom separately.
🔹Levels (Уровни)
Allows you to configure or turn off/on the display of the levels themselves, their color, thickness. As well as the number of penetrations of the level to remove it, as well as the number of candles for consideration and analysis by the indicator on the chart.
🔹Directional Line (Линия направленности)
Allows you to adjust the thickness of this line; you can disable it in the style tab.
🔹Graph and Candle Settings (Настройки графика и свечей)
Allows you to configure how many candles to extend the level to the right, the transparency of candles (can be disabled in styles), default colors of candles (for setting transparency)
🔶 RECOMMENDATIONS FOR USE
Customize the visual display of the indicator through the built-in settings, including the colors of the liquidity lines and their thickness.
NZTLevel surpasses basic indicators such as moving averages, Bollinger Bands, RSI, and others with a unique approach to analyzing liquidity and positioning of major players, providing traders with a comprehensive tool for making informed decisions in the market.
The indicator was developed by Temirlan Tolegenov for NZT Trader Community , March 2024, Prague, Czech Republic
ОПИСАНИЕ НА РУССКОМ ЯЗЫКЕ
🔶 ВСТУПЛЕНИЕ
NZTLevel — это продвинутый индикатор для TradingView, вдохновленный ментором Алмазом , и разработанный с целью предоставить трейдерам глубокий анализ рыночной ликвидности и движения крупных игроков.
🔶 СОДЕРЖАНИЕ
На основе анализа, основанном на ликвидности и отслеживании крупного игрока , индикатор выявляет Брейкер уровни и УПМ (Уровень Позиции МаркетМейкера) , которые помогают определить потенциальные точки разворота и направленность рынка , а так же показывает линию направленности , дающую информацию о состоянии в которой находится каждая свеча на графике (усилие, консолидация или обычное трендовое движения без усилия), а так же прозрачность свечей , сделанная специально для того, чтобы линия направленности была ясно и четко видима.
🔶 ЛОГИКА
🔹Брейкер Уровни (Локальные, Глобальные)
Брейкер уровни , подразделяются на локальные и глобальные , идентифицируются через детализированный алгоритм, учитывающий пробитие уровней с высокой ликвидностью и ожидаемую последующую реакцию рынка. Эти уровни визуализируются на графике в виде линий, цвет и толщина которых настраиваются пользователем, предоставляя четкое понимание текущей рыночной ситуации . Брейкер уровни позволяют нам определить настроение и направлениедвижения рынка , это уровни, от которых мы можем ожидать реакции, и после пробития которых мы получаем ценную информацию .
🔹УПМ (Бай стоп, Селл стоп)
УПМ отслеживает активность МаркетМейкеров и помогает проанализировать значительные рыночные движения . К примеру если последний УПМ указывает на бай стоп, это сигнализирует о возможности длинных позиций, что чрезвычайно ценно для трейдеров, стремящихся к оптимизации своих входов и управлению рисками.
🔹Линия направленности
Так же Индикатор включает линию направленности , которая изменяет цвет в зависимости от силы и направления текущего движения , предоставляя наглядное представление о трендах и консолидации рынка.
🔶 НАСТРОЙКИ
🔹Текст
Позволяет настроить или выключить/включить отображение текста уровней, уточняющий их тип текстом у начала отрисовки уровня (labels), так же его размер, цвет текста уровня сверху, или снизу отдельно.
🔹Уровни
Позволяет настроить или выключить/включить отображение самих уровней, их цвет, толщину. А так же количество пробитий уровня для его удаления, как и количество свеч для рассмотрения и анализа индикатором на графике.
🔹Линия направленности
Позволяет настроить толщину этой линии, отключить ее можно во вкладке style (стиль)
🔹Настройки графика и свечей
Позволяют настроить то, на сколько свеч протягивать уровень направо, прозрачность свечей (можно отключить в стилях (style)), цвета свечей по умолчанию (для настройки прозрачности)
🔶 РЕКОМЕНДАЦИИ К ИСПОЛЬЗОВАНИЮ
Настроить визуальное отображение индикатора через встроенные настройки, включая цвета линий ликвидности и их толщину.
NZTLevel превосходит базовые индикаторы, такие как скользящие средние, Bollinger Bands, RSI, и другие, благодаря уникальному подходу к анализу ликвидности и позиционирования крупных игроков, предоставляя трейдерам комплексный инструмент для принятия обоснованных решений на рынке.
Индикатор разработан Темирланом Толегеновым для международного сообщества NZT Trader , Март 2024, Прага, Чешская Республика
The indicator is published in accordance and respect to all House Rules of the TradingView platform.
Индикатор опубликован в соответствии и уважением ко всем внутренним правилами платформы TradingView.
Money Flow Profile [LuxAlgo]The Money Flow Profile is a charting tool that measures the traded volume or the money flow at all price levels on the market over a specified time period and highlights the relationship between the price of a given asset and the willingness of traders to either buy or sell it, allowing traders to reveal dominant and/or significant price levels and to analyze the trading activity of a particular user-selected range.
This tool combines a volume/money flow profile, a sentiment profile, and price levels, where the right side of the profile highlights the distribution of the traded activity/money flow at different price levels, the left side of the profile highlights the market sentiment at those price levels, and in the middle the price levels.
🔶 USAGE
A volume/money flow profile is an advanced charting tool that displays the traded volume/money flow at different price levels over a specific period. It helps traders visualize where the majority of trading activity/money flow has occurred.
A sentiment profile is a difference between buy and sell volume/money flow aiming to highlight the sentiment/dominance at specific price levels.
Each row of the profile presents figures on volume and money flow specific to price levels.
High volume/money flow nodes indicate areas of high activity and are likely to act as support or resistance in the future. They attract price and try to hold it there. Conversely, low-volume nodes are areas with low trading activity, that are less subject to get revisited by the price. The market often bounces right over these levels, not staying for long. The "Profile Heatmap" option of the script helps to better emphasize the trading activity within each areas.
By measuring the traded activity at each price level the script presents an ability to highlight the consolidation zones, in other words, highlights accumulation and distribution zones. When the price moves toward one end of the consolidation and volume pick up, it can foreshadow a potential breakout.
Level of Significance, Point of Control, Highest Sentiment Zone, and Profile Price levels are some of the other profile-related options available with the script.
🔶 SETTINGS
The script takes into account user-defined parameters and plots the profiles, where detailed usage for each user-defined input parameter in indicator settings is provided with the related input's tooltip.
🔹 Profile Generic Settings
Lookback Length / Fixed Range: Sets the lookback length.
Profile Source: Sets the profile source, Volume, or Money Flow.
🔹 Profile Presentation Settings
Volume/Money Flow Profile: Toggles the visibility of the Volume/Money Flow Profile.
High Traded Nodes: Threshold and Color option for high traded nodes.
Average Traded Nodes: Color option for average traded nodes.
Low Traded Nodes: Threshold and Color option for low traded nodes.
🔹 Sentiment Profile Settings
Sentiment Profile: Toggles the visibility of the Sentiment Profile.
Sentiment Polarity Method: Sets the method used to calculate the up/down volume/money flow.
Bullish Nodes: Color option for Bullish Nodes.
Bearish Nodes: Color option for Bearish Nodes.
🔹 Profile Heatmap Settings
Profile Heatmap: Toggles the visibility of the profile heatmap.
Heatmap Source: Sets the source of the profile heatmap, Volume/Money Flow Profile, or Sentiment Profile.
Heatmap Transparency: Control the transparency of the profile heatmap.
🔹 Other Presentation Settings
Level of Significance: Toggles the visibility of the level of significance line/zone.
Consolidation Zones: Toggles the visibility of the consolidation zones.
Consolidation Threshold, Color: Sets the threshold value and zone color.
Highest Sentiment Zone: Toggles the visibility of the highest bullish or bearish sentiment zone.
Profile Price Levels, Color, Size: Toggles the visibility of the profile price levels, and sets the color and the size of the level labels.
Profile Range Background Fill: Toggles the visibility of the profiles range.
🔹 Other Settings
Number of Rows: Specify how many rows each profile histogram will have.
Profile Width %: Alters the width of the rows in the histogram, relative to the profile length
Profile Text Size: Alters the size of the text. Setting to Auto will keep the text within the box limits.
Profile Horizontal Offset: Enables to move profile in the horizontal axis.
🔶 RELATED SCRIPTS
Liquidity-Sentiment-Profile
Swing-Volume-Profiles
For more and other conceptual scripts you are kindly invited to visit LuxAlgo-Scripts .

STIC bullish and bearish hunter with FVGSmart Trading and Investment Companion (STIC) is a sophisticated tool designed to identify and visualize inducement, market structure, market trends, track liquidity, and project and forecast price action for all applicable assets. it has been tested to work on all timeframes and has been traded on stock, forex, and crypto assets.
This script is an upgraded version of previous STIC indicator, which you can use in addition to it or separately as you deem fit
Traders/ investor that are familiar with market structure, inducement, candlestick psychology, trend-following indicatorsand Fair Value Gap FVG will find it easy to adopt this trading and investment companion. As stated below, this is how it works.
Features and how to use
1st of all, after adding the indicator to yoursuperchart, you want to endusre to set your to so as to enable you see the text labeling clearly. to do that, after adding the indicator to your chart, right click it on the list, you will se the Visual order option.
Special Extreme Alert!
By analyzing the trends and dimensions, we are able to predict market extremes conditions, especially in pump and dump scenarios. (the bullish or bearish P/D extreme alerts).
Market flip arrow
The arrows trigger to indicate when the market flips to bullish (green) or bearish (red) conditions. note that this arrow is just a market flip confirmation and it it triggered by market trends, it does not come one time and sometimes later after market trigger conditions had been met.
circled in white.
Buy or sell potential {The tiny yelow(sell) and blue(buy) triangle}
By analyzing market extreme conditions, market sentiment, and liquidity, the buy/sell potential alert trigger is able to determine the state of the market, This can and should be used in combination with the market flip line (MFL) [the yellow line from , market flip trigger (MFT) (purple line), and market support/resistance line (MSR)(blue line) .
Market flip Line (Blue line) (MFL): the MFL is useful to also understand the market phase; a candle close above the MFL is bullish, while a candle close Below, the MFL is bearish. You are, however, expected to experience market retests and rejections coupled with support and resistance to follow through with the predicted direction. Patience is a valuable virtue in trading.
Extended sell or buy hunt (Red and Green Triangle)
this is real-time triangles indicator just like every other indicator on theis chart that indicates the market direction labeled with buy and sell. Note that the market-extended extreme can occur multiple times in the same direction. Hence, we'll advise having multiple trade entries.
The flip support line
Market Flip Trigger Line (MFTL) (Magenta): When the market crosses and closes below or above the Market Flip Trigger Line, you should wait for a confirmation. a confirmation is usually a retest or rejection of the line. A candle close and reject indicates the market as flip direction and it is going for a correction or major reversal. it is applicable on all timeframe.
As mentioned earlier, if you understand market structure and sentiment, using the uFVG, iFVG, upLQTY, downLQTY and BOS will be easy. however, this is how it works, you may need tohave and expanded readbout market structure for additional knowledge.
upLQTY (Bullish liquidity inducement)
The indicator appear at the close and confirmation on the 3rd candle and it is extended to only appear on 200 bars applicable on all timeframes.
This is a bullish sentiment and liquidty inducement order block that occurs, leading to the break of trend structure and change of character. Meaning the market sentiment as change which is backed up by liquidity in that region, which mostly gets filled, especially on lower timeframes before the price action continues. If price revese breaks and hold above this region, it invalidates the order block. This will always appear when there is a confirmed change of character CHoCH to the bullish side.
downLQTY (Bearish liquidity inducement) The indicator appear at the close and confirmation on the 3rd candle and it is extended to only appear on 200 bars applicable on all timeframes. It is and inverse of the upLQTY.
like order block, these are supply and demand zones that has the potential to change the direction of a trade. This is a bearish order block that occurs, leading to the break of structure and change of character. Meaning there is bearish liquidity yet to be accounted for in the region, which mostly gets filled, especially on lower timeframes before the price action continues. If broken, it invalidates the order block. This will always appear when there is a confirmed change of character from CHoCH to the bearish side.
Fair Value Gap
From general knowledge, FVG also know as Fair value gaps are inbalnace created by a 3 candlestick pattern where the top of the bottom candles doesn't cross the bottom of the top candle. like order block, these are supply and demand zones that has the potential to change the direction of a trade. This mostly indicate the presense of big plays in the market. for STIC indicator, FVG are labeled as listed below;
UFVG, also FVGup, {Colour green box} = bullish imbalance fair value gap
IFVG, aka FVGdown, {Red box} = bearish imbalance fair value gap
OIFVG, {Yellow box, no label} = other imbalances fair value gab
You should not that FG has upper, lower and middle band, any of the this area can be induced and filled by price.
Alert Conditions!
Buy alert conditions
- Any bullish buy alert
- Bullish hunt
- Re-entry Buy
- Sharp Market Sell rejection
- Buy potential
- upLQTY
Long position Exit conditions
- ExtremeB
- Profit
- Sell hunt
The Entry, exit and trail profit alert trigger should be used as position exit conditions either for a Long (Buy) or Short (Sell) situation and should be set as OPB (Once Per Bar). Using it as entry for exit or vice versa as shown not to be very profitable. hence the need to combine with other order entry alerts like the Any bullish or Bearish alerts
Sell alert conditions ( NOTE: All Sell alert are not yet included in this current version as this is targeted towards bullrun.)
- Sell potential
- Sell triangle (Sell hunt)
- downLQTY
and any trail profit alert, this alert put into consideration all the conditions required to trail profit.
Risk management advice
Patience and a good risk management strategy are required to be profitable trader using this tool. You need to ensure not to overleverage, and you should have multiple entries in case the buy coditions/alert shows again below the previous buy alert before a sell condition/alert occurs.

Periodic Activity Tracker [LuxAlgo]The Periodic Activity Tracker tool periodically tracks the cumulative buy and sell volume in a user-defined period and draws the corresponding matching bars and volume delta for each period.
Users can select a predefined aggregation period from the following options: Hourly, Daily, Weekly, and Monthly.
🔶 USAGE
This tool provides a simple and clear way of analyzing volumes for each aggregated period and is made up of the following elements:
Buy and sell volumes by period as red and green lines with color gradient area
Delta (difference) between buy & sell volume for each period
Buy & sell volume bars for each period
Separator between lines and bars, and period tags below each pair of bars for ease of reading
On the chart above we can see all the elements displayed, the volume level on the lines perfectly matches the volume level on the bars for each period.
In this case, the tool has the default settings so the anchor period is set to Daily and we can see how the period tag (each day of the week) is displayed below each pair of bars.
Users can disable the delta display and adjust the bar size.
🔹 Reading The Tool
In trading, assessing the strength of the bulls (buyers) and bears (sellers) is key to understanding the current trading environment. Which side, if any, has the upper hand? To answer this question, some traders look at volume in relation to price.
This tool provides you with a view of buy volume versus sell volume, allowing you to compare both sides of the market.
As with any volume tool, the key is to understand when the forces of the two groups are balanced or unbalanced.
As we can observe on the chart:
NOV '23: Buy volume greater than sell volume, both moving up close together, flat delta. We can see that the price is in range.
DEC '23: Buy volume bigger than Sell volume, both moving up but with a bigger difference, bigger delta than last month but still flat. We can see the price in the range above last month's range.
JAN '24: Buy and sell volume tied together, no delta whatsoever. We can see the price in range but testing above and below last month's range.
FEB '24: Buy volume explodes higher and sell volume cannot keep up, big growing delta. Price explodes higher above last month's range.
Traders need to understand that there is always an equal number of buyers and sellers in a liquid market, the quality here is how aggressive or passive they are. Who is 'attacking' and who is 'defending', who is using market orders to move prices, and who is using limit orders waiting to be filled?
This tool gives you the following information:
Lines: if the top line is green, the buyers are attacking, if it is red, the sellers are attacking.
Delta: represents the difference in their strength, if it is above 0 the buyers are stronger, if it is below 0 the sellers are stronger.
Bars: help you to see the difference in strength between buyers and sellers for each period at a glance.
🔹 Anchor Period
By default, the tool is set to Hourly. However, users can select from a number of predefined time periods.
Depending on the user's selection, the bars are displayed as follows:
Hourly : hours of the current day
Daily : days of the current week
Weekly : weeks of the current month
Monthly : months of the current year
On the chart above we can see the four periods displayed, starting at the top left and moving clockwise we have hourly, daily, weekly, and monthly.
🔶 DETAILS
🔹 Chart TimeFrame
The chart timeframe has a direct impact on the visualization of the tool, and the user should select a chart timeframe that is compatible with the Anchor period in the tool's settings panel.
For the chart timeframe to be compatible it must be less than the Anchor period parameter. If the user selects an incompatible chart timeframe, a warning message will be displayed.
As a rule of thumb, the smaller the chart timeframe, the more data the tool will collect, returning indications for longer-term price variations.
These are the recommended chart timeframes for each period:
Hourly : 5m charts or lower
Daily : 1H charts or lower
Weekly : 4H charts or lower
Monthly : 1D charts or lower
🔹 Warnings
This chart shows both types of warnings the user may receive
At the top, we can see the warning that is given when the 'Bar Width' parameter exceeds the allowed value.
At the bottom is the incompatible chart timeframe warning, which prompts the user to select a smaller chart timeframe or a larger "Anchor Period" parameter.
🔶 SETTINGS
🔹 Data Gathering
Anchor period: Time period representing each bar: hours of the day, days of the week, weeks of the month, and months of the year. The timeframe of the chart must be less than this parameter, otherwise a warning will be displayed.
🔹 Style
Bars width: Size of each bar, there is a maximum limit so a warning will be displayed if it is reached.
Volume color
Delta: Enable/Disable Delta Area Display

Smart Money Concepts [UAlgo]🔶 Description:
Smart Money Concepts (SMC) refer to a trading strategy that revolves around understanding and following the actions of institutional investors, such as banks and hedge funds, who are considered the “smart money” in the market. The concept is based on the idea that these institutions have more information and resources, and thus their market activities can indicate future market movements.
This script designed to be a tool that will automatically provide many features related to SMC concept for investors, offering a market structure analysis that includes the identification of order blocks, breaker blocks, and liquidity points. It also delineates premium and discount zones, highlights Fair Value Gaps (FVG), Volume Imbalance (VI) and Order Gap (OG) areas, providing users with a multifaceted view of market dynamics.
🔶 Key Features:
Market Structure Analysis : Simplifies the overview of market behavior, identifies market breakouts or trend continuation.
It detects the market structure as shown in the image below :
Order Blocks : Detects Order Blocks based on market structure analysis and volume characteristics. It draws these blocks and provides information such as volume.
Order Block Identification:
Breaker Blocks : Detects Breaker Blocks based on market structure analysis.
Breaker Block Identification:
When Order Block above is broken,
As you can see, it has now turned into a Bearish Breaker Block,
And it seems that the price is getting a reaction from this breaker block above.
Liquidity Sweeps : Tracks liquidity sweeps on both the buy and sell sides, offering traders a perspective on market momentum and potential shifts.
Multi-Timeframe Fair Value Gap (FVG), Volume Imbalance (VI), Order Gaps (OG) Detection : Detects Fair Value Gap (FVG), Volume Imbalance (VI) and Order Gaps (OG) based on different criteria such as price movements and volume characteristics. It marks these gaps/voids and provides visual cues for analysis.
Examle for FVG:
Premium & Discount Zone Analysis : Analyzes premium and discount zones, showing prices within these zones and highlighting equilibrium (0.5) levels.
Customizable Options : Provides various input parameters for customization, such as market structure length, sensitivity settings, display preferences, and mitigation methods.
Previous Key Levels : Identifies previous key levels include previous highs, lows, equilibrium points, and open prices across different timeframes such as daily, weekly, and monthly.
🔶 Disclaimer:
Use with Caution: This indicator is provided for educational and informational purposes only and should not be considered as financial advice. Users should exercise caution and perform their own analysis before making trading decisions based on the indicator's signals.
Not Financial Advice: The information provided by this indicator does not constitute financial advice, and the creator (UAlgo) shall not be held responsible for any trading losses incurred as a result of using this indicator.
Backtesting Recommended: Traders are encouraged to backtest the indicator thoroughly on historical data before using it in live trading to assess its performance and suitability for their trading strategies.
Risk Management: Trading involves inherent risks, and users should implement proper risk management strategies, including but not limited to stop-loss orders and position sizing, to mitigate potential losses.
No Guarantees: The accuracy and reliability of the indicator's signals cannot be guaranteed, as they are based on historical price data and past performance may not be indicative of future results.
Market Structure (Range) & Internal Liquidity
This indicator will simplify the price-action reading of any trader/investor by decluttering his/her charts from un-important & confusing candles to highlight the true momentum candles which are usually formed by institutional buying/selling .
The indicator will be a good tool in the arsenal of the following styles of Trading/Investing
Smart Money / Liquidity Concepts
Price Action Concepts
Demand & Supply Concepts
Support & Resistance Concepts
UNIQUE FEATURES:
1. Market Structure - Range & Internal Liquidity:
Unlike other liquidity indicators, this indicator only highlights liquidity levels of significant importance. Not every intermediate high & low in a chart are worthy of noticing, hence by enabling the 'Swings' & 'Range (BoS)' feature in the indicator settings, the structure highs and lows (external liquidity) in a chart can be identified.
Any other liquidity levels within a market range (Range between structural High & Low) is known as internal liquidity which price targets to collect enough orders before heading towards the external liquidity levels.
2. Gaps (Fair Value Gaps / Imbalance):
Not every imbalance / gap between candles are important & trade-worthy. This feature of the indicator is different from the other widely available imbalance indicators & only highlights gaps formed by true momentum candles. Gaps between unimportant inside bars are not highlighted, as these bars occur in the absence of momentum.
3. True Price Action:
Looking at the two charts below, we can clearly observe the difference between price action of a confusing normal chart & the simplified price action highlighted by the indicator. This feature declutters the charts by only highlighting the candles a trader / investor should notice in a chart.
This feature when used in confluence with the liquidity levels feature & gap feature of the indicator, helps identify the true demand & supply zones (order blocks) in a chart.
Before
After
4. Zig Zag Lines:
This unique feature which is useful to Identify & Backtest different entry types taught by Smart Money Traders . This feature helps the trader understand the True Fractal Nature of price. This can also be seen as an alternate to the default line chart feature.
Examples of Entry Types taken by Smart Money Traders
ADDITIONAL FEATURES:
(These features are essential addons to trade liquidity. However, these are derived from publicly available indicators from the Tradingview library, but with a different interpretation for a better visualization of charts & or to time better trade entries without cluttering the charts)
a. Inside Bar & Outside Bars:
Identify not just a single Inside Bar as highlighted by other indicators, but to highlight a series of candles which are within a master candle range and are exhibiting unimportant sideways price action.
Outside Bars only relevant to momentum candles are highlighted, ignoring candles that occur within a master candle range. Highs & Lows of such Outside Bars are used by aggressive traders to identify liquidity levels in the charts.
b. Highs & Lows of previous Monthly / Weekly / Daily & Hourly Candles:
This feature draws Highs & Lows of previous Monthly / Weekly / Daily & Hourly Candles on the extreme right hand side of the chart to keep the charts clean.
Additionally for Hourly time frame, the indicator includes a setting to select the hourly candle time frame (60 min / 75 min / 240 min), which are personal and different for each trader.
UNDERLYING CONCEPT:
In the image below we see how a large majority of Traders / Investors incorrectly mark Structure markings, mistaking a raid of internal liquidity as a Break of Structure, thereby taking trades opposite to the broader trend of the markets
However, this indicator has a higher accuracy of identifying the correct price structure by only marking a structure high or low, when a subsequently opposite side liquidity is taken/raided. Further the broader trend of the markets can be easily identified by looking as to which side the Break of Structure has happened. (This is visible in the indicator in the form of 'Range' feature, so if a Range High is broken then it is understood to be in an uptrend & vice versa)
The underlying core functionality of the indicator is best displayed by the image below
USECASE OF THE INDICATOR:
Before taking any Buying/Selling position in the markets, a Trader / Investor must analyze the price action on the following parameters
HTF & LTF Trend Identification (To judge if trade is Pro-Trend or Counter-Trend)
Is Price at a High Probability Area of Interest?
Is Price satisfying the trade entry conditions?
Let us see how this indicator can be used as a complete trading system in itself and addresses each of the above parameters
Disclaimer: Illustrations shown below are just for understanding the features of the indicator & does not guarantee profitability. Every trader must back test their setups to arrive at a setup with an edge (positive expectancy) before they start actively trading the setup.
1. HTF & LTF Trend Identification (Pro-Trend / Counter-Trend) using 'Range (BoS)' feature of the indicator
Let's assume a Day Trader, uses hourly chart (75 min) to frame his Higher Time Frame (HTF) ideas & 15min charts (LTF) for trade entries
Looking at the chart below the Trader concludes that the HTF has most recently broken the structure to the downside and is considered Bearish till price action is below the range high of 48600 levels. It can also be concluded that the price is currently in a Bullish retracement.
The Trader can choose to take both Pro-Trend or Counter-Trend Trades, timing the trade entries using the LTF charts.
Looking at the LTF chart below, it is evident that price on LTF has also broken structure to the downside and is now aligned with the HTF Bearish Trend. The Trader will now look to get into short trades, to take trades both in line with HTF & LTF trend.
2. Let's identify if Price is at a High Probability Area of Interest, using either single or combination of the 'Swings' / 'Gaps' / 'Outside Bars' / 'HL of previous M,W,D, H candles' features of the indicator
Definition of High Probability Level / Area differs from each Traders perspective depending upon which of the Trading Styles (mentioned in the beginning) does one use.
Smart Money Traders
SMC Traders are known to get into trades early and their high R:R trades are taken mostly at a High Probability Area of Interest which are identified by them on HTF, by looking for candles with imbalance (gaps) & or candles which have taken out a previous liquidity and then having creating imbalance (gaps).
Also Turtle Soups is one of the favorite setups for SMC traders, where a trader enters a trade on LTF (typically 1 min/3min & 5min) after grabbing HTF liquidity lying at H/L of outside bar / previous monthly, weekly, daily or hourly candles.
Demand & Supply Traders
Some of the Best Demand & Supply Traders have the patience to wait for trades and take trades at the extreme Demand & Supply Zones within a market Range.
As illustrated below, the extreme hourly supply zone just below the structure high, which has the confluence of imbalance and Bearish HTF confirmation resulted in a good R:R trade.
Price Action Traders & Support & Resistance Traders
From the illustration below we can see how the 15 min Range breakdown confirms the breakdown of the Inverted Cup Pattern for Price Action Traders & Support & Resistance Traders using the same area of breakdown as the new Resistance to enter Short trades
3. Let's identify if Price is satisfying the Trade Entry Conditions using the 'Zig-Zag Lines' feature
Statistics say that majority (> 80%) of Traders blow up their accounts multiple times or completely give up and never achieve profitability.
One of the primary reasons for this is Traders punching trades randomly and without having proper Setup or rules for entering Trades.
Also in order to arrive at rules or execute the different entry models (couple of examples highlighted earlier) taught by different Trainers, a Trader needs to learn to visualize charts in a similar format to what the trainers are teaching.
The Zig-Zag lines feature is a form of line chart that joins the swing high points to the swing low points on the chart to represent the True Price action & a proper fractal nature of the markets, unlike the line chart which is formed by only by joining the closing value of each candle.
From the image below we can see that the Zig-Zag lines feature eliminates the randomness visible in the line chart and is a more smoother chart. Using this feature one can back test the various entry models widely available on the internet or arrive at a user specific model which he/she is comfortable with.
CONCLUSION:
Trading with a deeper understanding of Price Action allows a Trader/Investor to enter or exit trades with ease. Price Action trading allows individuals to keep their charts clean and stay away from the other lagging technical indicators and enter trades much earlier than other technical indicators.
This indicator attempts in simplifying the understanding of price action for every one and identify potential high probability areas / levels where one should enter / exit trades.
This indicator will be an important tool in the arsenal of any Trader / Investor to take better informed trades, however it does not guarantee profitability of a Trader, due to the randomness of the markets & external factors that influence each trader.
GET ACCESS:
Refer Author's instructions below to get access to the indicator

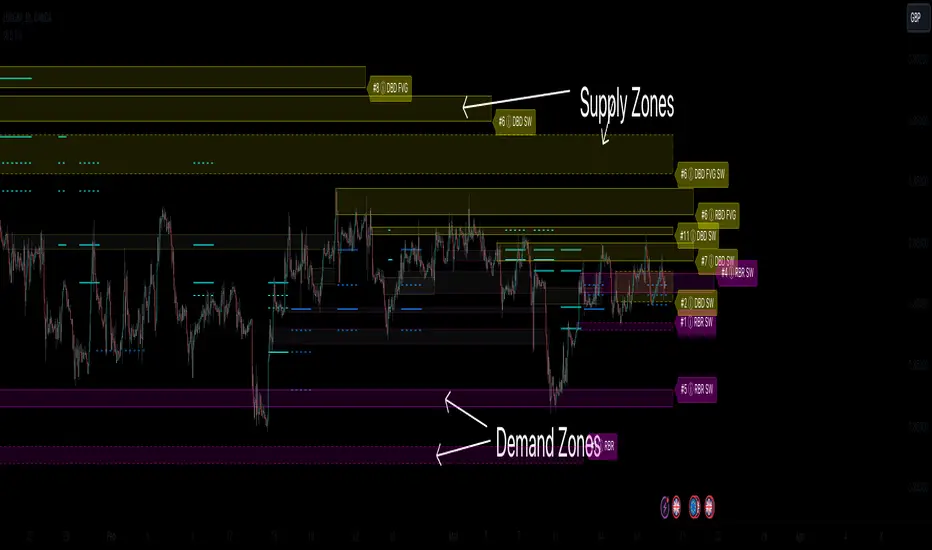
Supply & Demand Zones (Order Block) Pro [BacktestBot]Supply & Demand Zones (Order Block) Pro with DBD/RBR/RBD/DBR/FVG
This indicator helps to identify large price moves driven by banks and institutions. It can be used for any asset type (FOREX, crypto, commodities, indices) and any timeframe.
How to use this indicator
Message me to gain access. I try to reply within 24 hours.
Consider this as more of a visual aid to add to your confluences.
Use a side by side chart layout with different timeframes to see more zones.
(See example of use at the bottom)
Pullback trades are popular with zones.
⭑⭑⭑ Zones ⭑⭑⭑
How are zones created?
Supply zones are created when the price drops quickly, so are found above the price action.
Demand zones are created when the price rallies quickly, so are found below the price action.
The script uses a combination of quick price movements and user defined minimum price % changes. All user defined settings have default settings which vary depending on asset type and timeframe.
What is a strong zone?
The zones boxes have either a dashed border or a solid border. A solid border represents a strong zone which is when
the price has moved very quickly from it, or
the price has bounced off the zone multiple times.
What is a deactivated zone?
When the price has gone through the zone by a certain %, the zone is deactivated and displayed in a more transparant colour.
How are deactivated zones used for switch zones?
When a new zone is created, it is checked to see if it overlaps a recently deactivated zone.
e.g. If a new demand zone overlaps a recently deactivated supply zone, then the zone has switched from supply to demand. This might mean the new zone could be a strong one and the number of hits on the previous zone (also a potential indicator of strength) is displayed in the zone label tooltip.
Zone information
Basic zone information can be found in the zone label.
Users can choose what information is displayed in the label including the number of hits and prices.
More detailed information can be found in the zone label tooltip.
Hovering over the label will display more information including the zone start time and height %.
DBD/RBR/RBD/DBR/FVG
Zones are defined as drop base drop, rally base rally, rally base drop, drop base rally, and fair value gap.
Zone height
Users have the option of choosing
Wick to wick, or
Wick to body
The indicator does its best to meet the user preference but sometimes it is not possible. The information in the label tooltip will show if the preference was matched.
Minimum and maximum height default settings help to prevent zone boxes which might fill the whole chart.
⭑⭑⭑ Lines of Interest ⭑⭑⭑
Lines of interest are displayed as an added bonus.
Long wick
Long wicks might show areas of support or resistance. Very long and long wicks are defined by the % change in the wicks.
Very long wick lines are always displayed, and long wicks are displayed if they are not near a zone.
Possible Support / Resistance
After a big rally or drop, lines are displayed to show where the price might pullback to. These lines can act as possible support or resistance, and
are taken from recently deactivated zones. A solid line respresents a strong deactivated zone.
⭑⭑⭑ Alerts ⭑⭑⭑
Limit the number of alerts to the recommended ones. Consider this as more of a visual aid to add to your confluences.
Alert types
Early alerts happen immediately.
Bar end alerts happen when the bar closes.
Alert display
Alerts can be displayed on the chart with symbols. The most recent symbols have a tooltip which allow alert information to be displayed when hovering over them.
It is recommended to turn the alert display off, as it can clutter up the chart. The alerts will continue to work with the display off.
⭑⭑⭑ Example of use ⭑⭑⭑
Side by side chart with different timeframes
⭑⭑⭑ Disclaimer ⭑⭑⭑
Trading is very high risk. All content, tools and scripts provided by BacktestBot are for informational & educational purposes only. Past performance does not guarantee future results.
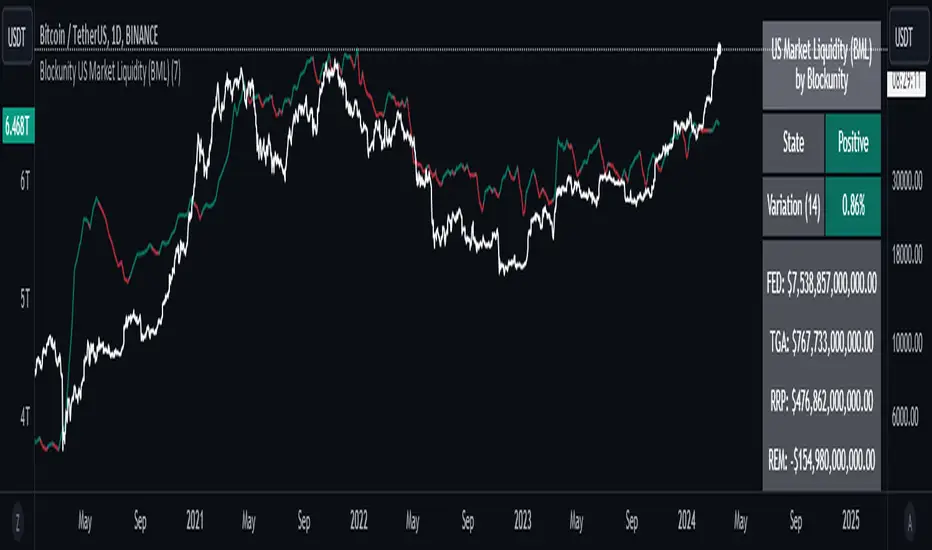
Blockunity US Market Liquidity (BML)Get a clear view of US market liquidity and monitor its status at a glance to anticipate movements on risky assets.
The Idea
The BML aggregates and analyzes total USD market liquidity in trillions of dollars. It is used to monitor the liquidity of the USD market. When liquidity is good, all is well. If liquidity is low, the US will maneuver and sell treasury bills (debt) to replenish its treasury, which can lead to bearish pressure on markets, particularly those considered risky, such as Bitcoin.
How to Use
The indicator is very easy to use, there's nothing special about it. This tool is mainly intended to be used as fundamental information, and not for active trading.
Elements
The US Market Liquidity has several distinct components:
FED Balance Sheet
The Fed credits member banks’ Fed accounts with money, and in return, banks sell the Fed US Treasuries and/or US Mortgage-Backed Securities. This is how the Fed “prints” money to juice the financial system.
US Treasury General Account
The US Treasury General Account (TGA) balances with the NY Fed. When it decreases, it means the US Treasury is injecting money into the economy directly and creating activity. When it increases, it means the US Treasury is saving money and not stimulating economic activity. The TGA also increases when the Treasury sells bonds. This action removes liquidity from the market as buyers must pay for their bonds with dollars.
Overnight Reverse Repurchase Agreements
A reverse repurchase agreement (known as Reverse Repo or RRP) is a transaction in which the New York Fed under the authorization and direction of the Federal Open Market Committee sells a security to an eligible counterparty with an agreement to repurchase that same security at a specified price at a specific time in the future.
Earnings Remittances Due to the Treasury
The Federal Reserve Banks remit residual net earnings to the US Treasury after providing for the costs of operations, payment of dividends, and the amount necessary to maintain each Federal Reserve Bank’s allotted surplus cap. Positive amounts represent the estimated weekly remittances due to the US Treasury. Negative amounts represent the cumulative deferred asset position, which is incurred during a period when earnings are not sufficient to provide for the cost of operations, payment of dividends, and maintaining surplus.
Settings
Several parameters can be defined in the indicator configuration. You can:
Choose the smoothing and timeframe to be used in the plot.
Set the EMA lookback period and display it or not. This affects the color of the main plot.
Set the period to be taken into account when calculating the variation rate in the table.
Select the data to be taken into account in the calculation.
Activate or not the barcolor.
Lastly, you can modify all table parameters.
Liquidity Trendline With Signals [BigBeluga]The Liquidity Trendline is an indicator designed to identify potential breakouts by utilizing pivot points. These pivotal moments can trigger significant market reactions, either by breaking out or by serving as breakout and retest signals.
🔶 FEATURES
The indicator contains the following features:
Period of the calculation
Padding (spacing between the 2 lines)
Signal for breakouts
🔶 USAGE
As shown in the example, breakouts can be powerful points to see reversions in the market and can lead to a lot of volatility in the market.
When a trendline is broken, a signal will be plotted; the user can disable/enable those signals.
A trendline is formed when 2 consecutive pivot points are found, each of them lower or higher than the previous one. this is the anchor point for our trend line that we will use to spot rejection or breakouts
The delay in the creation of those trend lines will be the period input used to find the pivot point on the chart.
Another good example is using these trendlines as simple retests.
Prices bouncing on top of them will suggest a possible continuation of the current trend.
We can filter out stronger breakouts by looking at how many times the price has rejected the trendline, more rejections will result in more liquidity once the price breaks it.
Signals are plotted on the chart for every breakout that happens.
Another good utility is simply using them as retest once the price breaks those levels and holding above/below them, indicating a possible support or resistance area used for confluence
Here is another good example of how we can correctly spot price deviating from our trendline and spotting powerful continuation in price.
As said before we can filter out bad and good breakouts simply by looking at how many times rejected from those levels.
More rejection will result in a stronger reaction
🔶 CONCLUSION
This script is as simple as that and can be used in a few ways to spot reversals, price continuation, or even sentiment in price (bullish or bearish).

Liquidity Grab Screener | Flux Charts💎 GENERAL OVERVIEW
Introducing our new Liquidity Grab Screener! This screener can provide information about the latest liquidity grabs in up to 5 tickers. You can also customize the algorithm that finds the liquidity grabs and the styling of the screener.
Features of the new Liquidity Grab Screener :
Find Latest Liquidity Grabs Accross 5 Tickers
Price, Size, Status Information
Customizable Algoritm / Styling
📌 HOW DOES IT WORK ?
Liquidity grabs occur when one of the latest pivots has a false breakout. Then, if the wick to body ratio of the bar is higher than 0.5 (can be changed from the settings) a bubble is plotted.
The bubble size is determined by the wick to body ratio of the candle.
This screener then finds liquidity grabs accross 5 different tickers, and shows the latest information about them.
Price -> The price when the liquidity grab happened.
Size -> Size of the liquidity grab, determined by the wick-body ratio.
Status -> Shows the elapsed time of the liquidity grab.
🚩UNIQUENESS
Liquidity grabs can be useful when determining candles that have executed a lot of market orders, and planning your trades accordingly. This screener will find liquidity grabs from up to 5 tickers and give information about their price, size and status. The screener also lets you customize the pivot length and the wick-body ratio for liquidity grabs.
⚙️SETTINGS
1. Tickers
You can set up to 5 tickers for the screener to scan order blocks here. You can also enable / disable them and set their individual timeframes.
2. General Configuration
Pivot Length -> This setting determines the range of the pivots. This means a candle has to have the highest / lowest wick of the previous X bars and the next X bars to become a high / low pivot.
Wick-Body Ratio -> After a pivot has a false breakout, the wick-body ratio of the latest candle is tested. The resulting ratio must be higher than this setting for it to be considered as a liquidity grab.

Liquidity Finder🔵 Introduction
The concept of "liquidity pool" or simply "liquidity" in technical analysis price action refers to areas on the price chart where stop losses accumulate, and the market, by reaching those areas and collecting liquidity (Stop Hunt), provides the necessary energy to move the price. This concept is prominent in the "ICT" and "Smart Money" styles. Imagine, as depicted below, the price is at a support level. The general trader mentality is that there is "demand" for the asset at this price level, and this demand will outweigh "supply" as before. So, it is likely that the price will increase. As a result, they start buying and place their stop loss below the support area.
Stop Hunt areas are essentially traders' "stop loss" levels. These are the liquidity that institutional and large traders need to fill their orders. Consequently, they penetrate the price below support areas or above resistance areas to touch their stop loss and fill their orders, and then the price trend reverses.
Cash zones are generally located under "Swings Low" and above "Swings High." More specifically, they can be categorized as support levels or resistance levels, above Double Top and Triple Top patterns, below Double Bottom and Triple Bottom patterns, above Bearish Trend lines, and below Bullish Trend lines.
Double Top and Triple Top :
Double Bottom and Triple Bottom :
Bullish Trend line and Bearish Trend line :
🔵 How to Use
To optimally use this indicator, you can adjust the settings according to the symbol, time frame, and your needs. These settings include the "sensitivity" of the "liquidity finder" function and the swing periods related to static and dynamic liquidity lines.
"Statics Liquidity Line Sensitivity" is a number between 0 and 0.4. Increasing this number decreases the sensitivity of the "Statics Liquidity Line Detection" function and increases the number of lines identified. The default value is 0.3.
"Dynamics Liquidity Line Sensitivity" is a number between 0.4 and 1.95. Increasing this number increases the sensitivity of the "Dynamics Liquidity Line Detection" function and decreases the number of lines identified. The default value is 1.
"Statics Period Pivot" is set to 8 by default. By changing this number, you can specify the period for the static liquidity line pivots.
"Dynamics Period Pivot" is set to 3 by default. By changing this number, you can specify the period for the dynamic liquidity line pivots.
🔵 Settings
Access to adjust the inputs of Static Dynamic Liquidity Line Sensitivity, Dynamics Liquidity Line Sensitivity, Statics Period Pivot, and Dynamics Period Pivot is possible from this section.
Additionally, you can enable or disable liquidity lines as needed using the buttons for "Show Statics High Liquidity Line," "Show Statics Low Liquidity Line," "Show Dynamics High Liquidity Line," and "Show Dynamics Low Liquidity Line."

AlgoRhythmica - Liquidity StatsThe AlgoRhythmica - Liquidity Stats is a comprehensive trading indicator designed to analyze and plot liquidity data across various time periods. It uses estimated liquidity data and allows traders to select between 6 different scopes to analyze and view that data.
What is liquidity?
Liquidity refers to how quickly and easily an asset can be bought or sold in the market without affecting its price. High liquidity means that there are many buyers and sellers, and transactions can happen rapidly and smoothly.
Liquidity analysis involves examining where and how liquidity is distributed across different price levels.
Price often moves from liquidity zone to liquidity zone, and therefore, having an idea of whether there's more liquidity above or below price give traders an idea of where price might go next.
How does it work?
Internally, the indicator is simulating a complete liquidity map of the chart and cleverly estimates where traders might face losses (liquidations). It does this by looking at the volume of trading in each candle and projecting where, given certain common trading practices like using 10x or 20x leverage, traders are likely to get squeezed out of their positions. These projected squeeze-out points helps in visualizing potential future price movements, as prices often move towards these areas to balance out. But instead of rendering the liquidity on the main chart, which can get cluttered, this data is viewed in a separate panel through a selection of different scopes.
Keep in mind though, this liquidity data here is just an estimation based on general assumptions, it doesn't have access to actual liquidity data.
However, some risk and leverage amounts are more common than others. People like using those even numbers like 10x, 20x leverage or 1% stop loss etc. And that's why the liquidity estimations in this and other liquidity indicators can still be quite accurate.
Special Feature:
A special feature to this indicator is it's unique eye for 'vector candles'—those high-impact candles signaling significant market moves. It tracks these candles over time to see if the market revisits them, a behavior that can indicate major market maker activities and potential price reversal points.
The 6 different plotting scopes:
Liquidity Dominance:
The Liquidity Dominance is the long liquidity minus the short liquidity. When there's more liquidity above price, price tends to go up. There's also a 50 EMA running through it, indicating whether the liquidity dominance is particularly extended.
There is also a setting for normalizing the dominance to an adjustable EMA. Normalizing means that the value of the EMA will then become the zero-value of the dominance. This can be particularly effective in trending markets because it allows traders to see more clearly how the liquidity deviates from it's EMA.
Split Dominance:
This is simply the long and short liquidity plotted separately with a 200 SMA running through. This gives traders a slight more in-depth look at the liquidity. Looking at the difference between long and short liquidity and using the SMA as a reference, traders can more easily spot a trend shift and whether the liquidity types are about to cross each other.
Stochastic LQ:
Instead of using price data, the Stochastic LQ applies the stochastic oscillator formula to liquidity data. It measures the position of the current liquidity level relative to its high-low range over a specified period. By doing so, it aims to provide a clear picture of whether buyers or sellers are dominating the liquidity landscape within the chosen lookback period.
Liquidations:
This will display the amount of volume that was consumed when price wicked or crossed into a liquidity level on that particular bar. There's also a setting to cumulate the liquidations over the selected period. This will show you whether longs or shorts are suffering the most.
Vector Count:
This tool counts the number of unrecovered vector candles. If there are more to the upside, price is likely to go up. The vector count also has a setting for normalizing the count to an EMA. Some older vectors never get recovered and therefore normalizing the count to an EMA can be a more useful way of focusing on more recent vectors.
Total LQ:
By focusing on the total liquidity without differentiating between long and short positions, this tool simplifies the liquidity landscape. High total liquidity can support the sustainability of current trends, as it shows that there is enough market participation to support the price direction.
Additional Features:
Vector Recovery Dots:
A feature to visually identify recovered vector candles, indicating potential market reaction points for strategic entry or exit decisions.
This is used in combination with any of the tools. It will plot dots whenever a vector candle has been recovered. A recovered vector candle while liquidity is extended, could indicate a top or a bottom.
Dynamic Period Selection:
Choose between aggregating the liquidity over a fixed period (Daily, Weekly, Monthly, Yearly etc.) which then stays the same when the user switches timeframe, or choose a dynamic period with a fixed amount of candles which then dynamically shifts when changing time frame. This offers flexibility to look at liquidity over different time frames. Liquidity that falls outside of the selected period is considered gone, as traders eventually close their positions.
Lookback and Sensitivity Adjustment:
Customize the lookback period for volume averages and adjust sensitivity to refine the indicator's responsiveness to volume changes and liquidity calculations.
Leverage Settings:
Input specific leverage amounts to calculate liquidity on. These should be adjusted depending on the chart and timeframe the user is looking at. Decide on up to three different leverage amounts that traders would typically use on the chart and timeframe you're on. The liquidity will then be calculated using that leverage.
Tooltips:
The indicator comes with extensive tooltips for every function, making sure the user understand every part of it.
And as usual, use it together with other market analysis and perhaps a liquidity map of your choice.
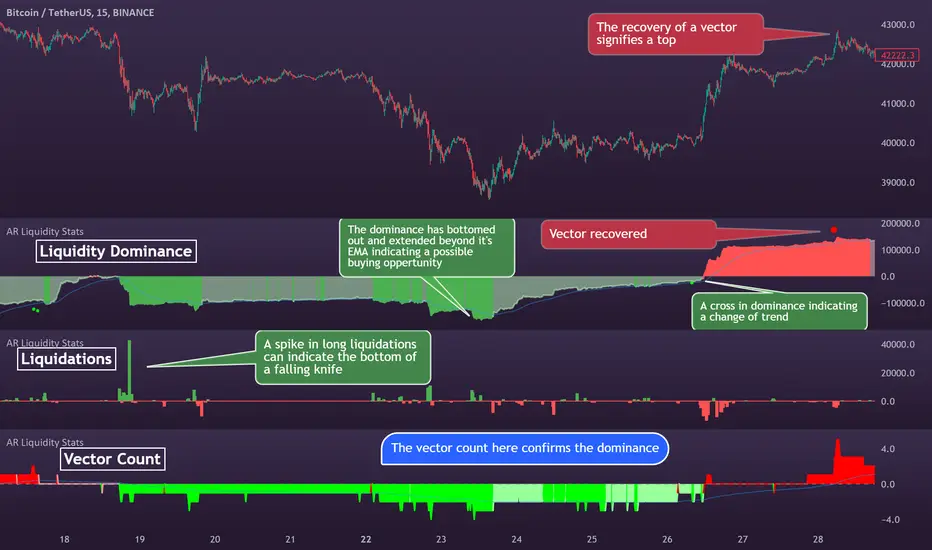
Liquidation Levels with Liquidity Sweeps/Breakouts [AlgoAlpha]🌊📈 Dive into the depths of market liquidity with "Liquidation Levels with Liquidity Sweeps/Breakouts" - your ultimate tool for navigating the turbulent waters of trading! 🧹💹 Crafted by the wizards at AlgoAlpha, this Pine Script™ masterpiece illuminates the unseen liquidity levels and sweeps, guiding you through the financial seas with insight. 🚀🔍
Key Features:
🕒 Timeframe Flexibility: Customize your analysis with a TimeFrame Multiplier, allowing the indicator to operate on higher timeframes for broader market insight.
💥 Dynamic Volume Threshold: Set your sensitivity to breakouts with the High Volume Threshold, ensuring you catch significant market movements while avoiding fakeouts.
👀 Visibility Controls: Toggle the display of swept liquidity and highlight liquidity breakouts with customizable background colors for clear, actionable insights.
🎨 Custom Appearance: Personalize your chart with bullish, bearish, and breakout colors to match your trading style.
How to Use the Liquidity Levels with Liquidation Sweeps Indicator:
Maximize your trading efficiency with the Liquidity Levels with Liquidation Sweeps Indicator by following these simple steps! 🚀🌟
⚙️ Customize Settings: Access the indicator settings to personalize the TimeFrame Multiplier, High Volume Threshold, and Relative Volume Period. Tailor these settings to match your trading strategy and chart preferences.
👁️ Analyze Liquidity Levels: Monitor the chart for liquidity levels and sweeps. Bullish sweeps are marked with green labels, bearish sweeps with red, and breakouts highlighted by the chart background.
🔔 Set Alerts: Enable alert conditions for liquidity breakouts and sweeps within the indicator's settings. This feature allows you to receive real-time notifications, helping you to act promptly on trading opportunities.
How It Works:
The heart of this indicator lies in its ability to track and highlight liquidity levels derived from swing pivots, and sweeps across multiple timeframes. By calculating relative volume against a user-defined threshold, it identifies strong volume movements indicative of liquidity breakouts, this helps filter out fake-outs. When a liquidity level is breached but not completely mitigated, it's either marked as a bullish or bearish sweep, which come with the option to show an estimate of the number of liquidations during the sweep.
if peakform and peakprinted != 1
aR.push(line.new(bar_index-mult, h.get(1), bar_index+1, h.get(1), color = red))
aRv.push(h.get(1))
peakprinted := 1
if valleyform and valleyprinted != 1
aS.push(line.new(bar_index-mult, l.get(1), bar_index+1, l.get(1), color = green))
aSv.push(l.get(1))
valleyprinted := 1

Market Structure with Inducements & Sweeps [LuxAlgo]The Market Structure with Inducements & Sweeps indicator is a unique take on Smart Money Concepts related market structure labels that aims to give traders a more precise interpretation considering various factors.
Compared to traditional market structure scripts that include Change of Character (CHoCH) & Break of Structures (BOS) -- this script also includes the detection of Inducements (IDM) & Sweeps which are major components of determining other structures labeled on the chart.
SMC & price action traders have historically considered this a more accurate representation of market structure by including these components.
🔶 USAGE
Below we can see a diagram for how market structure is displayed within the Market Structure with Inducements & Liquidity indicator.
Change of Characters (CHoCH) are based on swing points detection, while Break of Structures (BOS) are based on trailing maximum & minimums from the detected Change of Characters. We do this for a more dynamic & timely display of market structure.
🔹 Inducements (IDM)
Traders that consider inducements as a part of their analysis of Change of Characters & Break of Structures can more easily avoid fakeouts within trends as shown below.
In this script IDM's are always required between each market structures.
🔹 Sweeps of Liquidity (x)
SMC traders looking to properly analyze market structure need to look for sweeps of liquidity to ensure levels that are wicked are noted as sweeps, while levels that are fully closed above / below are labeled as confirmed market structures.
In the chart below we can see a Sweep of Liquidity which typically can occur on the longer term price action and indicate a potential reversal.
Notably, since labels such as CHoCH or BOS's can occur at the same level as a Sweep of liquidity, we have allowed the indicator to display the market structure label at the current bar in the event this happens.
The Sweeps of Liquidity are also based on trailing maximum / minimum, which allows for a continuous evaluation of areas for liquidity sweeps to occur.
This can be helpful for traders looking for longer term & shorter term sweeps.
🔶 SETTINGS
CHoCH Detection Period: Detection period for CHoCH's, higher values will return longer term CHoCH's.
IDM Detection Period: Detection period for IDM's, higher values will return longer term IDM's.
Thank you all for 500k followers on TradingView! Enjoy!

BigBeluga - Smart Money ConceptsSmart Money Concepts (SMC) is a comprehensive toolkit built around the around the principles of "smart money" behavior, which refers to the actions and strategies of institutional investors.
SMC transcends traditional technical analysis by delving deeper into this framework. This approach allows users to decipher the actions of these influential players, anticipate their potential impact on market dynamics, and gain insights beyond just price movements.
This all-in-one toolkit provide the user with a unique experience by automating most of the basic and advanced concepts on the chart, saving them time and improving their trading ideas.
🔹Real-time market structure analysis simplifies complex trends by pinpointing key support, resistance, and breakout levels.
🔹Advanced order block analysis leverages detailed volume data to pinpoint high-demand zones, revealing internal market sentiment and predicting potential reversals. This analysis utilizes bid/ask zones to provide supply/demand insights, empowering informed trading decisions.
🔹Imbalance Concepts (FVG and Breakers) allows traders to identify potential market weaknesses and areas where price might be attracted to fill the gap, creating opportunities for entry and exit
🔹Swing failure patterns help traders identify potential entry points and rejection zones based on price swings
🔹Liquidity Concepts, our advanced liquidity algorithm, pinpoints high-impact events, allowing you to predict market shifts, strong price reactions, and potential stop-loss hunting zones. This gives traders an edger to make informed trading decisions based on multi-timeframe liquidity dynamics
🔶 FEATURES
The indicator has quite a lot of features that are provided below:
Swing market structure
Internal market structure
Mapping structure
Discount/Premium zone
Adjustable market structure
Strong/Weak H&L
Sweep
Volumetric Order block / Breakers
Fair Value Gaps / Breakers (multi-timeframe)
Swing Failure Patterns (multi-timeframe)
Deviation area
Equal H&L
Liquidity Prints
Buyside & Sellside
Sweep Area
Highs and Lows (multi-timeframe)
🔶 BASIC DEMONSTRATION
The preceding image illustrates the market structure functionality within the Smart Money Concepts indicator.
Solid lines: These represent the core indicator's internal structure, forming the foundation for most other components. They visually depict the overall market direction and identify major reversal points marked by significant price movements (denoted as 'x').
Dotted lines: These represent an alternative internal structure with the potential to drive more rapid market shifts. This is particularly relevant when a significant gap exists in the established swing structure, specifically between the Break of Structure (BOS) and the most recent Change of High/Low (CHoCH). Identifying these formations can offer opportunities for quicker entries and potential short-term reversals.
Sweeps (x): These signify potential turning points in the market where liquidity is removed from the structure. This suggests a possible trend reversal and presents crucial entry opportunities. Sweeps are identified within both swing and internal structures, providing valuable insights for informed trading decisions.
🔶 USAGE & EXAMPLES
The image above showcases a detailed example of several features from our toolkit that can be used in conjunction for a comprehensive analysis.
Price rejecting from the bullish order block (POC), while printing inside a bullish SFP and internal structure turning bullish (Internal CHoCH).
The image further demonstrates how two bearish order blocks could potentially act as resistance zones when prices approach those levels. These areas might also offer attractive locations to place take-profit orders.
The price has reached our first take-profit level, but is exhibiting some signs of weakness, suggesting a potential pullback which could put the trade at higher risk.
On the other hand, the price action currently exhibits strong bullish sentiment, suggesting favorable entry points and a potential upward trend.
The price has now fully reached our take-profit zone and is also exhibiting bearish confluence, indicating a potential price reversal or trend shift.
🔶 USING CONFLUENCE
The core principle behind the success of this toolkit lies in identifying "confluence." This refers to the convergence of multiple trading indicators all signaling the same information at a specific point or area. By seeking such alignment, traders can significantly enhance the likelihood of successful trades.
In the image above we can see a few examples of the indicator used in confluence with other metrics included in the toolkit.
Liquidity Prints within order blocks
SFP close to the POC
Sweep in liquidity close to a fair value gaps
These are just a few examples of what applying confluence can look like.
🔶 SETTINGS
Window: limit calculation period
Swing: limit drawing function
Internal: a period of the beginning of the internal structure
Mapping structure: show structural points
Algorithmic Logic: (Extreme-Adjusted) Use max high/low or pivot point calculation
Algorithmic loopback: pivot point look back
Premium / Discount: Lookback period of the pivot point calculation
Show Last: Amount of Order block to display
Hide Overlap: hide overlapping order blocks
Construction: Size of the order blocks
Fair value gaps: Choose between normal FVG or Breaker FVG
Mitigation: (close - wick- avg) point to mitigate the order block/imbalance
SFP lookback: find a higher / lower point to improve accuracy
Threshold: remove less relevant SFP
Equal h&L: (short-mid-long term) display longer term
Any Alert(): Trigger alerts based on the selected inputs
付費腳本

Emibap's HEX Uniswap v3 Liquidity PoolThis script will display a histogram of the Uniswap V3 HEX liquidity pool, versus as many tokens as possible.
Current supported pairs:
HEX/USDC
HEX/WETH
HEX/WETH.USD (Ethereum expressed in USD)
HEX/USDT (Just showing the USDC liquidity)
Similar to what you can see in the liquidity section of the Uniswap pool page but conveniently rendered alongside your chart.
It's meant to be used on a HEX / WETH chart only. The price should be expressed in WETH for it to work.
One of the main motivations for using this in your chart is to get an idea of the current sentiment: If most of the volume is above the price it might be an indication of an upcoming move up, for instance.
I'll try to update the liquidity regularly.
Using the 4h, daily, or weekly time frames is highly recommended.
The options are straightforward:
Histogram bars color. Default is blue
Histogram background color. Default is black at 20% opacity
Upper price limit of the diagram: Visible upper bound price limit for the histogram, based on the current price. I.E: 200%: If the price is 1, the histogram will show 3 as the upper bound
Lower price limit of the diagram. Visible lower bound price limit for the histogram, based on the current price. I.E: 99%: If the price is 1, the histogram will show 0. 01 as the upper bound
Width of the widest bar: Width (in bars) for the widest bar of the histogram. The more the higher resolution you'll get
Locked volume marker line thickness
Locked volume marker color

Open Liquidity Heatmap [BigBeluga]Open Liquidity Heatmap is an indicator designed to display accumulated resting liquidity on the chart.
Unlike any other liquidity heatmap, this aims to accumulate liquidity at specific levels that build up over time, showing larger areas of liquidity.
🔶 FEATURES
The indicator includes the following settings:
Lookback : Used to determine the range calculation of the heatmap.
Leverage : Leverage of the liquidation (Counted as % in price, Example: 4.5 will return a distance from price of 4.5%, indicating any possible resting liquidity in this range).
Levels : Amount of levels to display (Each level is counted as liquidity resting on the chart; fewer levels will return a bigger area of liquidity sitting on the chart).
Mode : Apply a color gradient from the minimum liquidation to the maximum liquidity level. Set the maximum color gradient value (Counted as volume).
Offset : Automatically determine the offset range of the Volume Profiles. Manual offset of the Volume Profiles.
🔶 CALCULATION
for i = 0 to step - 1
float plotter = na
switch i
0 =>
plotter := hs
=>
plotter := hs - diff * ( i )
cls.hm.gnL(plotter)
cls.vp.put(plotter, 0)
We calculate levels like a normal volume profile with steps, from the highest point within the lookback to the lowest one. Each level will contain the corresponding amount of volume that the candle has closed in that range.
As we can see in the image above, we add liquidity each time the distance in % from price is between two levels.
Unlike many liquidity indicators that provide a single candle liquidity heatmap, this aims to add up liquidity (volume) in already present levels.
This can be extremely useful to see which levels are likely to be more liquid and tend to get a bigger reaction to the price.
Imagine it like a range of levels that each time price revisits that area, a new position area is added; we add volume in that area each time price visits that zone. Liquidity builds up in those zones, causing a bigger reaction to the price once the price visits it.
This indicator is not the same as a single candle heatmap like many others. What is a single candle heatmap?
A single candle heatmap is when a level is created on every new candle, coloring the level based on the total volume of it.
This indicator, on the contrary, aims to provide a more specific use by adding up liquidity each time price visits it.
🔶 BASIC DEMOSTRATION
This is a basic demonstration of how we can spot high liquidity points overall using confluence:
We see the POC of the liquidation in a low volume area of the normal volume profile adding up as confluence.
Resistance from the POC Volume Profile suggesting price will go lower.
Major long open liquidity down.
As we can see, price takes out all the long liquidity and right after pumping, indicating that all the major liquidity got taken out.
Some key note to take is that a POC in the liquidation heatmap in a low volume area of the normal Volume Profile add confluence of a possible big reaction in that zone.
In the forex market, we suggest to use a low distance from price (Leverage) while in a crypto market you can use the one that fit the best the current timeframe.
🔶 CONCLUSION
This indicator aims to show open resting liquidity that had built up over time, showing the most amount of liquidation in specific areas in an aggregated way unlike many liquidation heatmap indicators that show single-level liquidation.
🔶 RELATED SCRIPT

Williams %R Liquidity Sweeps [UAlgo]🔶Description:
The "Williams %R Liquidity Sweeps " designed to identify potential liquidity sweeps based on the Williams %R oscillator. The indicator helps traders spot areas where liquidity may be accumulating or dispersing rapidly, which can signal potential buying or selling opportunities or confluence/confirmation your decisions.
🔶Key Features:
Williams %R Oscillator: The indicator utilizes the Williams %R oscillator, a momentum indicator that measures overbought and oversold levels.
Liquidity Sweep Detection: It identifies liquidity sweeps by detecting pivot highs and lows within the Williams %R oscillator ( Sweeps only occur in Overbought/Oversold zones ).
Customizable Parameters: Traders can adjust various parameters such as oscillator length, overbought/oversold levels, pivot length, and maximum lines to suit their trading preferences.
Visual Representation: Liquidity sweeps are visually represented on the chart with labels and points that waiting for sweep (green and red lines default) are can be used as support and resistance zones. The indicator dynamically manages the display of support and resistance lines. Removing outdated lines to maintain relevance.
Example for Oscillator Liquidity Sweep:
Disclaimer:
This indicator is provided for informational and educational purposes only and should not be considered financial advice. Trading involves risks, and past performance is not indicative of future results. Users are encouraged to conduct their own research and consult with a qualified financial advisor before making any investment decisions based on this indicator.
The effectiveness of the indicator may vary depending on market conditions, trading strategies, and other factors. Traders should exercise caution and practice proper risk management techniques when using this or any other trading tool.
