Master LTCBTC Network Value ModelThe Master LTCBTC Network Value Model takes the following 6 network values for Litecoin. It compares them to Bitcoin's network values to determine a "fair" value based on Litecoin's network usage compared to Bitcoin's.
Please apply on an LTCBTC chart. Use Black Background to view.
This also includes an average of the 6 network metrics and is colored white with a slightly large line width.
New Addresses
Total Addresses
Active Addresses
Total Volume USD
Transaction Count
# of Retail
萊特幣(加密貨幣)

SOPR Candles OscillatorThe Spent Output Profit Ratio (SOPR) is computed by dividing the realized value (in USD) divided by the value at creation (USD) of a spent output. Or simply: price sold / price paid. This metric was created by Renato Shirakashi.
The indicator provides insight into macro market sentiment, profitability and losses taken over a particular time-frame. It reflects the degree of realized profit for all coins moved on-chain.
SOPR is measured by taking the ratio between the fiat value at the time of UTXO creation, and the fiat value when the UTXO is spent.
In this indicator, I have essentially created an index that measures SOPR value on any given day. This is visually displayed as an oscillator.
SOPR values greater than 0 implies that the coins moved that day are, on average, selling at a profit (price sold is greater than the price paid).
SOPR value less than 0 implies that the coins moved that day are, on average, selling at a loss (price sold is less than the price paid).
You have the ability to see the SOPR of BTC , ETH and LTC. You can also smooth the SOPR using an EMA or SMA of your choice. I have added colored bars to the chart to make it easier to visualize SOPR and it's relation to price action.
Thank you to both TradingView and Glassnode for adding all the on-chain data.


EMASAR Investor ModePLEASE READ THE FULL DESCRIPTION BEFORE BUYING OR USING THIS INDICATOR
THIS IS THE INVESTOR MODE ONLY VERSION OF THE EMASAR INDICATOR. IT INCLUDES THE ORIGINAL SIGNALS TELLING YOU WHEN TO BUY OR SELL. IT ONLY INCLUDES THE OCEAN TO INDICATE PULLBACKS AND NOT OTHER TRADING REGIONS ARE INCLUDED. IT SHOWS THE BUY/SELL SIGNALS AS WAS PUBLISHED IN THE ORIGINAL VERSION OF EMASAR
EMASAR (pronounced Emma-sar) is a strategy based on Exponential Moving Averages and the Parabolic SAR. This is a position trading approach that is derived from Tyler Jenks’ Consensio.
This strategy was developed with four objectives in mind: (1) managing risk (2) protecting from missing out on major moves (3) maximizing risk:reward (4) staying in a trending market and taking profit before it fully reverses.
EMASAR does a great job at accomplishing all of the above through the buy and sell signals that are generated. The data provided below is from the signals that occurred on Bitcoin ( Bitstamp ) from January 1, 2015 to present (November 11, 2019).
(1) Risk is tightly managed, relative to the winners, and losing positions will be exited before the market moves too far against.
The biggest losing trade on Bitcoin , for the time period outlined above, is -18.47%.
(2) Following the EMASAR buy and sell signals guarantees that one will not miss out on a major trend. As a result of the indicators used for this system it is mathematically impossible for a major trend to occur without providing a buy or sell signal. This system isn't meant to catch exact tops or bottoms but it will do a great job of capturing ~85% of a trend.
(3) On average the winning trades will be 5.55 times the losing trades. There will be stretches where the losers are bigger than the winners and this could last for many months, maybe even a year. However, over the long run the average reward is expected to be 5.55 times the average risk*.
*Past performance does not guarantee future results!
(4) This indicator was designed to capitalize on parabolic markets, specifically Bitcoin and alt coins. Crypto markets have a tendency to get moving so fast that many indicators become all but useless.
Entries can get signaled too late and exits will get signaled way too early. This is specifically true when using oscillators that are designed to identify overbought or oversold environments. EMASAR does a great job of keeping us in a position for the duration of a trend and this includes the major parabolic runs that Bitcoin has a tendency to go on.
When Bitcoin , or other alts, really get moving it can be very difficult to distinguish between a correction and a full reversal. We do not want to be exiting during a minor correction, instead this is a time when we want to be holding on or looking to buy the dip.
This is a very fragile balance. The market has a very strong tendency to make corrections looks like reversals and to make reversals look like corrections. Therefore it is very important to have a tool(s) that you trust to distinguish in between the two.
I believe that EMASAR is the best way to find that balance - if I knew of a better way then I would be using it instead!
Following these signals will help us to hold onto positions while the market is still trending in our favor when most think that it has moved too far / too fast, and it will also get us out before a market fully reverses.
Keep in mind that there will be times when we exit a market that is in danger of reversing, only to buy back higher later on. That is okay because it enables us to properly manage risk during times of uncertainty and buying back in at a higher price is more than worth the opportunity cost.
Risks
The biggest risks with trading EMASAR revolve around disobeying the signals. Risk management is built into this system with the exit signals that will occur, however it is up to the individual to execute those signals. Passing on an exit signal could lead to a big loss which would have a dramatic impact on the ROI . Most trading systems will have small and medium losses with small, medium and large wins. That is exactly how this works. The small - medium losses and wins will mostly be a wash and will account for roughly 80% of the trades. The large wins will happen about 20% of the time and will make up 80% - 90% of the profits.
Therefore the two biggest risks are passing on signals entirely, or exiting preemptively. Getting chopped in and out of a market can be quite frustrating. If you become overwhelmed with negative emotions then it could cause you to pass up on the next signal. That signal will often be the one that more than makes up for the small - medium losses that preceded.
On average EMASAR will provide one signal every 6 weeks when using the default settings on the 4h chart. Therefore missing one entry could turn an otherwise profitable year into a loser. If electing to trade a system, whether it is EMASAR or another, it is crucial to commit to taking every signal regardless of outside variables (namely your personal bias about market direction or frustration that follows a losing stretch).
Another major risk with this system is taking too much profit too soon. When getting into a trade that has the potential to be a big winner it can be challenging to continue holding through the swings. Anyone that has watched paper profits vanish will be inclined to start exiting after the market makes a big move in his or her favor. While this is better than watching profits completely evaporate, this mistake can be enough to turn a profitable system into one that loses to the market. If 80% - 90% of our profits come from 10% - 20% of our trades then it is vital we do not cut those positions off at the knees.
If taking too much profit too soon then you will consistently turn potential large winners into medium winners. This may lead to making money over the long run which will make it very difficult to realize that anything is wrong. However making money and beating the market are two very different things. Exiting early and making money is nearly as big of a risk as missing entries entirely.
If you have the discipline to execute signals in a timely manner after they are triggered and the emotional control to let the winners run despite the appearance of a vastly overbought / oversold market, then you should have what it takes to beat the market with EMASAR.
If you are not an experienced trader then it is very important to start out small. The only way to learn is to trade in a live environment and the only way to succeed is to risk much less than you can afford to lose. If you have $2,000 to trade with then start with a maximum position size of $20 - $50 and don’t be shy about scaling that down even further. Focus on ROI instead of actual dollars made. If you can return 100% on a $20 roll then you should be able to do the same with a $2,000 roll.
Important Notes
Make sure that you read / understand the risks outlined above. If you jump into this without understanding the unique risks that this system entails then you are going to have a bad time.
This indicator was developed around the 4h and that is where it works best. For crypto adjusting to higher TF’s will cause for bad results as the entries / exits will be late to the party. For traditional markets the Daily - Weekly time frames are preferred. It was not originally intended for smaller TF's but we have seen some good results on the 15m and 1h. The RSI can be a great compliment when using on smaller TF's. Adding a rule for not entering when RSI > 75 or < 25 and instead entering when RSI retests 50 will help to avoid some bad signals.
Alerts can be set for this indicator. Simply make sure that it is visible on the chart, then click the alert icon on the top panel. In the first dropdown set 'Condition' to 'EMASAR' and the second 'Condition' for the upcoming signal. For example if just entered long then set the second condition to 'Close Long' and you will be notified as soon as that signal occurs. If waiting for the next long entry then set the second condition to 'Open Long' so on and so forth . There is an 'All in One' alert that is also available. If you select that then you will be alerted any time that a signal occurs. The message will tell you to check the chart to see which signal caused the alert.
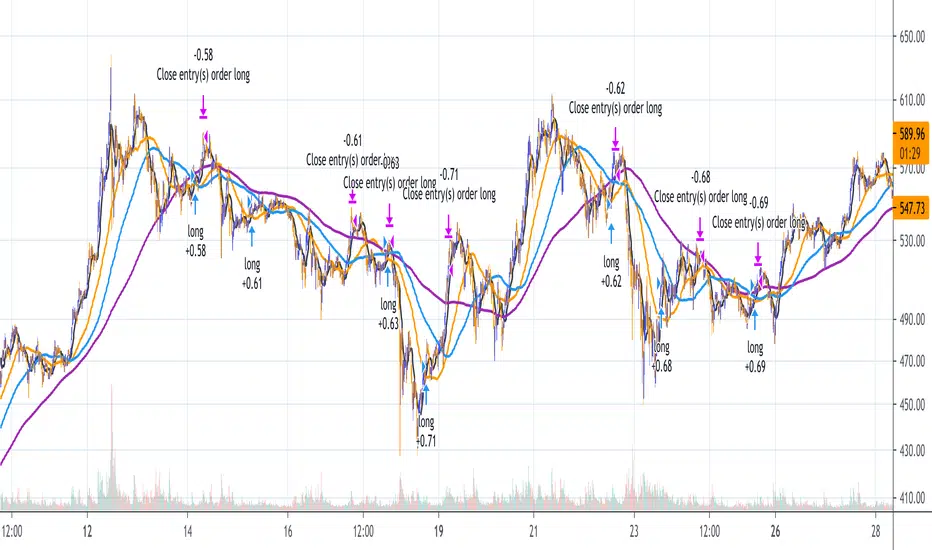
Moving Average ScalperThe main goal of a scalping strategy is to open and close trades frequently, profiting from small gains and limiting the downside risk.
This strategy, on average, manages to close trades within one day, meaning that you are not exposed to the risk of holding that coin for long. In this way, market conditions affect much less the overall performance of the trading system.
The setup of this strategy uses four moving averages combined with an unconventional approach. On one side, the strategy aims to catch assets trading in a downtrend but on the verge of a possible reversal. Then, the goal of the trading strategy is not to ride the eventual uptrend but to close the trade with minimal profit so that it can scan the market for a new opportunity again.
ENTRY
The buy order is placed on assets that most likely are about to have at least a short-term "relief rally." To capture this setup, the strategy buys when
the MA9 crosses above the MA50
the MA50 is lower than the MA100
the MA100 is lower than the MA200
EXIT
The trading system closes the trade when the MA9 crosses above the MA200, which could be the first major resistance the asset faces before developing a more sustained uptrend.
As a reminder, the goal of the strategy is not to catch the whole upside of the asset but has a more conservative approach. This allows keeping the risk of the strategy low.
Pro tip: The 15-min time frame has proven to return the best results on average. The strategy can work well also in the 5-min time frame.
The strategy assumes each order to trade 30% of the available capital and opens a trade at a time. A trading fee of 0.1% is taken into account.
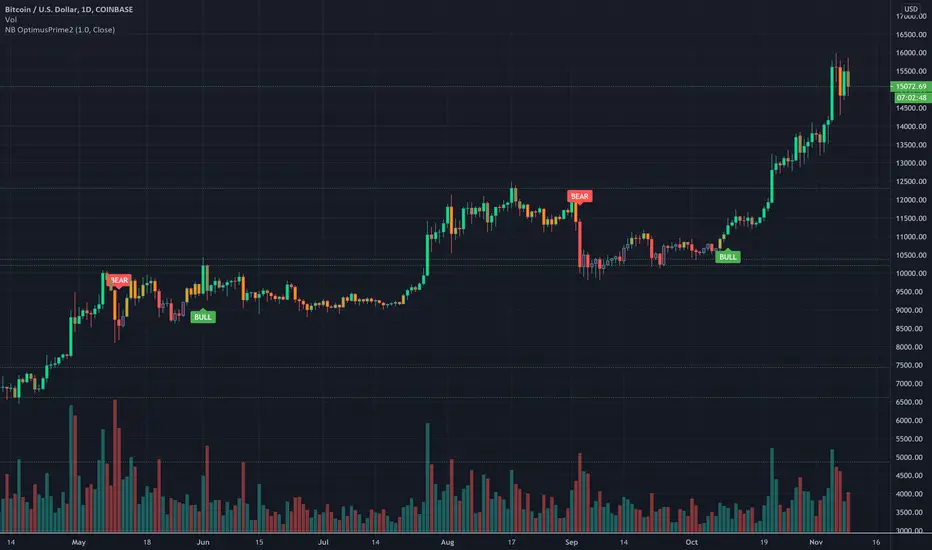
NB OptimusPrime2Hello Everyone,
Welcome to NB Optimus Prime 2.
This is an educational indicator that makes two colorful calls in your chart thus :
Red = Bear
Green = Bull
The calls are meant to indicate potential downtrends and uptrends respectively.
The signals are made based on aggregated Index prices and moving averages which are then smoothened out. Volume is used to gage momentum of the trend which is then shown by colors on the candle stick. This indicator is best used in combination with other traditional indicators i.e MACD , RSI and other tools that are available on TradingView.
Even though this indicator was designed with Cryptocurrency in mind, it can also be used for Stocks and Forex. I created this for my crypto community as a way to introduce them to trading with indicators.
It should be noted that this indicator should not be considered financial advice in any way or form. This is just an indicator. Please use it responsibly.
PM me to obtain access to this indicator and I will be happy to help you.

Crypto Tipster Pro+ (Optimized for LTCUSD)===========
Crypto Tipster Pro+ Optimized for LTCUSD
===========
This script is a carbon-copy of our Crypto Tipster Pro Strategy , but also includes our Custom & Fully Optimized Settings for turbo-charging your Litecoin (LTCUSD) trading.
-----------
We keep all our Crypto Tipster Pro+ (Optimized) strategies regularly updated and maintained. The purpose of these Add-On's to our Crypto Tipster Pro Strategy is to keep each trading plan relevant, up-to-date and most of all profitable within ever-changing markets.
We will always keep our main Crypto Tipster Strategy active, as we find the default settings are the best "all-rounder" set-up and work with many crypto pairs over many different time frames, try it for yourself! This Set-Up for Litecoin enables you to hone in on one certain trading pair on the 'D' chart and maximize your overall trading experience.
-----------
Visit the link below for Full & Immediate Access!
Good Luck and Happy Trading!

USDT SupplyThis script shows the USDT (Tether) supply, total USDT market capitalization and USDT supply on various Cryptocurrency exchanges.
It is based on this script:
Changes:
- added HiTBTC and Huobi exchange
- updated to Pine Script v4
- improved default style and line width to highlight global USDT plots against exchange-specific plot lines

Super Algorithm Strategy (Joy Bangla)This is the strategy tester for the
Below are the performance results
Starting with $10,000
Net Profit: 88%
66% profitable trades
34% losing trades. Do look at the losing trades. If one did careful moment management, some of those may end up profitable as well.
4.158 Profit factor.
16.1% drawdown. I would go a bit more and say if I am using this, my risk management should ensure for a stop loss of 20%.
66 bars on average (aka it holds for a long time. So, one needs to look into the funding factor in money management)
Sharpe Ratio: 0.291
Only 7 trades done (with 6 closed) in 2 and a half years. So this absolutely reduces noise as much as possible.
In short, if I had $10000 of BTC beginning of 2018, I would be having $18,878 worth of btc right now.
With 4x leverage, this could be a huge potential.
For info on gaining access see the ⬇ link below ⬇ in our signature field & direct message me. I have a busy schedule at my own workplace. Trading is my hobby. Hence, please be kind to me if I am late in replying.

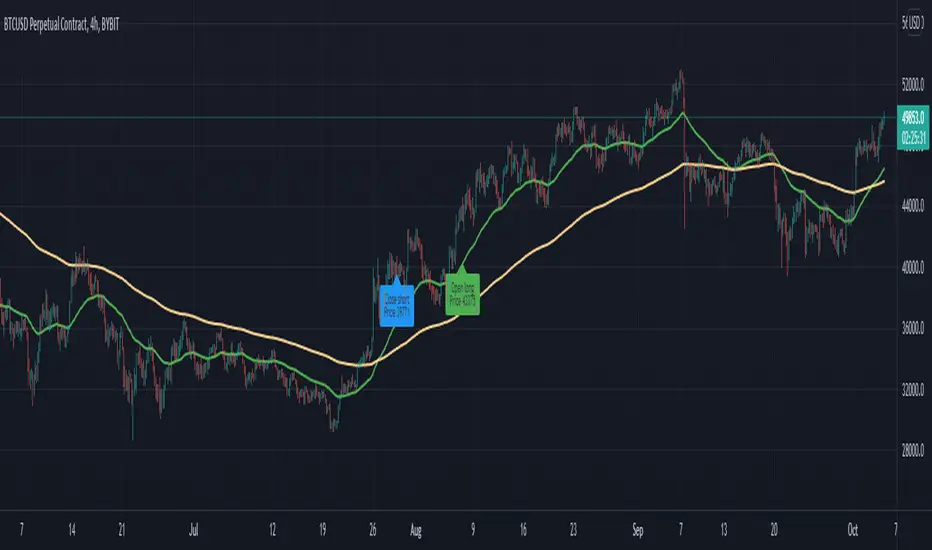
EMASARPLEASE READ THE FULL DESCRIPTION BEFORE BUYING OR USING THIS INDICATOR
EMASAR (pronounced Emma-sar) is a strategy based on Exponential Moving Averages and the Parabolic SAR . This is a position trading approach that is derived from Tyler Jenks’ Consensio.
This strategy was developed with four objectives in mind: (1) managing risk (2) protecting from missing out on major moves (3) maximizing risk:reward (4) staying in a trending market and taking profit before it fully reverses.
EMASAR does a great job at accomplishing all of the above through the buy and sell signals that are generated. The data provided below is from the signals that occurred on Bitcoin (Bitstamp) from January 1, 2015 to present (November 11, 2019).
(1) Risk is tightly managed, relative to the winners, and losing positions will be exited before the market moves too far against.
The biggest losing trade on Bitcoin, for the time period outlined above, is -18.47%.
(2) Following the EMASAR buy and sell signals guarantees that one will not miss out on a major trend. As a result of the indicators used for this system it is mathematically impossible for a major trend to occur without providing a buy or sell signal. This system isn't meant to catch exact tops or bottoms but it will do a great job of capturing ~85% of a trend.
(3) On average the winning trades will be 5.55 times the losing trades. There will be stretches where the losers are bigger than the winners and this could last for many months, maybe even a year. However, over the long run the average reward is expected to be 5.55 times the average risk*.
*Past performance does not guarantee future results!
(4) This indicator was designed to capitalize on parabolic markets, specifically Bitcoin and alt coins. Crypto markets have a tendency to get moving so fast that many indicators become all but useless.
Entries can get signaled too late and exits will get signaled way too early. This is specifically true when using oscillators that are designed to identify overbought or oversold environments. EMASAR does a great job of keeping us in a position for the duration of a trend and this includes the major parabolic runs that Bitcoin has a tendency to go on.
Take a look at the two charts below which illustrates the buy and sell signals that occurred at the beginning and end of the 2017 and 2019 parabolic moves. Green = Buy | Blue = Exit | Red = Short
Long signaled at $4,190.27 on September 29th, 2017
Exit signaled at $13,647 on January 14th, 2018
Short signaled at $12,050 on January 16th, 2018
Close Short signaled at $3,684 on February 18th, 2019
Long signaled at $3,684 on February 18th, 2019
Exit signaled at $9,614 on July 16th, 2019
Short signaled at $10,328 on July 22nd, 2019
When Bitcoin, or other alts, really get moving it can be very difficult to distinguish between a correction and a full reversal. We do not want to be exiting during a minor correction, instead this is a time when we want to be holding on or looking to buy the dip.
This is a very fragile balance. The market has a very strong tendency to make corrections looks like reversals and to make reversals look like corrections. Therefore it is very important to have a tool(s) that you trust to distinguish in between the two.
I believe that EMASAR is the best way to find that balance - if I knew of a better way then I would be using it instead!
Following these signals will help us to hold onto positions while the market is still trending in our favor when most think that it has moved too far / too fast, and it will also get us out before a market fully reverses.
Keep in mind that there will be times when we exit a market that is in danger of reversing, only to buy back higher later on. That is okay because it enables us to properly manage risk during times of uncertainty and buying back in at a higher price is more than worth the opportunity cost.
Lets look at the signals above in chronological order:
1) Close Long: $2,274
2) Open Short: $2,347
3) Exit Short: $2,934
4) Open Long: $2,766
5) Close Long: $3,124
6) Enter Long: $4,190
A long was closed at $2,274 after Signal #1 and was re-entered after Signal #4 at $2,766. Additionally a long was closed at $3,124 after Signal #5 and was re-entered on the following signal at $4,190. These are examples of some of the bad signals that will occur. Something to pay attention to is the ratio of the risk to the reward. When the market turns against us EMASAR will quickly signal an exit or a re entry.
EMASAR also works great in traditional markets. The S&P 500 has been on a tear lately after creating new all time highs in October of 2019. It has resumed it's strong bull trend and therefore it is a great market to have long exposure to. That being said we are well overdue for a correction and most people, including myself, expect the next bear market to be much more severe than the last two. Therefore I would not want to have long exposure unless equipped with a very reliable method for taking profit before it fully reverses.
Let's take a look at the S&P 500 weekly EMASAR signals using the preferred settings outlined below:
In August of 1990 EMASAR signaled a 'Close Long' at $308. At that time the market was in danger of fully reversing. When that didn't happen EMASAR gave a signal to re enter at $369 which resulted in losing 19.8% in opportunity cost. That is quite okay because it would have allowed us to properly protect ourselves in the event that the market proceeded to crash. Instead we entered a massive bull market that culminated in the dot com bubble. Notice how EMASAR kept us in for the entire duration of that bull run and then signaled an exit very close to the top at $1,294. It got us back in by the end of 2004 after the market had bottomed. Yet again it kept us in for the following multi year bull market before signaling an exit very close to the top at $1,270.
The action that followed in 2016 looks very similar to what happened in 1990 - 1991. An exit was signaled when the market was in danger of fully reversing. When that didn't happen a re entry was signaled 14% higher. Now the market appears to be taking off in another parabolic advance. There is no way to know how far this next run will go or how long it will last. Nevertheless I feel highly confident that I will be able to hold on for the majority of the trend and then get fully out before it reverses thanks to the signals provided by EMASAR.
When looking at the signals on Gold we will notice striking similarities to the signals in the S&P 500 as well as Bitcoin.
Notice how an entry was signaled very close to the bottom at $323 in June of 2002. An exit was also signaled very close to the top at $1,441 in April of 2013. Throughout that runup there was one bad signal that cost some opportunity. It's very important to understand that missing out on opportunity is well worth the price because it allows us to effectively manage risk. EMASAR also recently provided a long signal at $1,401 which preceded this recent runup.
Settings
Default settings work best for crypto, however the time multiplier should be adjusted for markets that are not open 24/7. For commodities and FOREX my default is 40 and for stocks I use 24. The Moving Averages can be adjusted as well. The period can be changed and you can also select SMA or EMA. I always use the EMA's and strongly prefer the 50 and 200. We have noticed good results with the 9 and 54 EMA's as well. The shorter the period that the Moving Average is set to the more frequent the signals will be. This will generally improve risk:reward while decreasing strike rate. For crypto the best time frames are the 4h and 6h. For traditional markets the best time frames are the Daily, 3D and Weekly. EMASAR can be used on smaller time frames as well, specifically in crypto. The 15m and 1h have shown good results.
Risks
The biggest risks with trading EMASAR revolve around disobeying the signals. Risk management is built into this system with the exit signals that will occur, however it is up to the individual to execute those signals. Passing on an exit signal could lead to a big loss which would have a dramatic impact on the ROI. Most trading systems will have small and medium losses with small, medium and large wins. That is exactly how this works. The small - medium losses and wins will mostly be a wash and will account for roughly 80% of the trades. The large wins will happen about 20% of the time and will make up 80% - 90% of the profits.
Therefore the two biggest risks are passing on signals entirely, or exiting preemptively. Getting chopped in and out of a market can be quite frustrating. If you become overwhelmed with negative emotions then it could cause you to pass up on the next signal. That signal will often be the one that more than makes up for the small - medium losses that preceded.
On average EMASAR will provide one signal every 6 weeks when using the default settings on the 4h chart. Therefore missing one entry could turn an otherwise profitable year into a loser. If electing to trade a system, whether it is EMASAR or another, it is crucial to commit to taking every signal regardless of outside variables (namely your personal bias about market direction or frustration that follows a losing stretch).
Another major risk with this system is taking too much profit too soon. When getting into a trade that has the potential to be a big winner it can be challenging to continue holding through the swings. Anyone that has watched paper profits vanish will be inclined to start exiting after the market makes a big move in his or her favor. While this is better than watching profits completely evaporate, this mistake can be enough to turn a profitable system into one that loses to the market. If 80% - 90% of our profits come from 10% - 20% of our trades then it is vital we do not cut those positions off at the knees.
If taking too much profit too soon then you will consistently turn potential large winners into medium winners. This may lead to making money over the long run which will make it very difficult to realize that anything is wrong. However making money and beating the market are two very different things. Exiting early and making money is nearly as big of a risk as missing entries entirely.
If you have the discipline to execute signals in a timely manner after they are triggered and the emotional control to let the winners run despite the appearance of a vastly overbought / oversold market, then you should have what it takes to beat the market with EMASAR.
If you are not an experienced trader then it is very important to start out small. The only way to learn is to trade in a live environment and the only way to succeed is to risk much less than you can afford to lose. If you have $2,000 to trade with then start with a maximum position size of $20 - $50 and don’t be shy about scaling that down even further. Focus on ROI instead of actual dollars made. If you can return 100% on a $20 roll then you should be able to do the same with a $2,000 roll.
Important Notes
Make sure that you read / understand the risks outlined above. If you jump into this without understanding the unique risks that this system entails then you are going to have a bad time.
This indicator was developed around the 4h and that is where it works best. For crypto adjusting to higher TF’s will cause for bad results as the entries / exits will be late to the party. For traditional markets the Daily - Weekly time frames are preferred. It was not originally intended for smaller TF's but we have seen some good results on the 15m and 1h. The RSI can be a great compliment when using on smaller TF's. Adding a rule for not entering when RSI > 75 or < 25 and instead entering when RSI retests 50 will help to avoid some bad signals.
Alerts can be set for this indicator. Simply make sure that it is visible on the chart, then click the alert icon on the top panel. In the first dropdown set 'Condition' to 'EMASAR' and the second 'Condition' for the upcoming signal. For example if just entered long then set the second condition to 'Close Long' and you will be notified as soon as that signal occurs. If waiting for the next long entry then set the second condition to 'Open Long' so on and so forth. There is an 'All in One' alert that is also available. If you select that then you will be alerted any time that a signal occurs. The message will tell you to check the chart to see which signal caused the alert.
How to Buy
The EMASAR Indicator is available for purchase on my website. The link can be found in my signature or in the tagline of my Trading View profile.
The price is $500 per year which is only payable in Bitcoin. That also includes access to a private Telegram group.

Borsaca Demo Limited Time OnlyThis indicator does NOT REPAINT. If the signal occurs it will be forever. Easy and profitable strategy optimized for Crypto, Foreks and Stock Markets...
This indicator gives you Long and Exit signals all timeframes...
BORSACA TRADER is optimized to catch trend movements as soon as possible and maximize profitability.
Strategy tester results. 96% Profitable on BTCUSD Daily scale. Test other markets you want.
WE RELY ON OUR INDICATOR TO THE END. AND WE ASSURE YOU THERE IS NOTHING BETTER THAN THE BORSACA TRADER INDICATOR.
Best regards and happy trading.
Herif's winning strategy option. Check the strategy tester results success than %96
Safe Mode as optional parameter. You can enable this to prevent some riskier trades to happen at the cost of some profitability. Use it if you are more conservative in trading.
Normal Mode signals for Buy and Sell. Trade Mode signals for buy and sell use with support and resistance levels.
Auto Support And Resistance ..
Auto Fibonacci Levels...
BORSACA TRADER indicator is the best option for everybody in financial markets. Check my Profile Page for more information and follow me, like and favorite my indicator and support your positive response and take a message for 10 days trial.
Happy trading. Good luck :)

BORSACA TRADER LIMITED TIME USE ONLYThis indicator does NOT REPAINT. If the signal occurs it will be forever. Easy and profitable strategy optimized for Crypto, Foreks and Stock Markets...
This indicator gives you Long and Exit signals all timeframes...
BORSACA TRADER is optimized to catch trend movements as soon as possible and maximize profitability.
Strategy tester results. 96% Profitable on BTCUSD Daily scale. Test other markets you want.
WE RELY ON OUR INDICATOR TO THE END. AND WE ASSURE YOU THERE IS NOTHING BETTER THAN THE BORSACA TRADER INDICATOR.
Best regards and happy trading.
Herif's winning strategy option. Check the strategy tester results success than %96
Safe Mode as optional parameter. You can enable this to prevent some riskier trades to happen at the cost of some profitability. Use it if you are more conservative in trading.
Normal Mode signals for Buy and Sell.
Trade Mode signals for buy and sell use with support and resistance levels.
Auto Support And Resistance..
Auto Fibonacci Levels...
BORSACA TRADER indicator is the best option for everybody in financial markets. Check my Profile Page for more information and follow me, like and favorite my indicator and support your positive response and take a message for 10 days trial.
Happy trading. Good luck :)
Crypto InfoPanel (MD)Credits to Daveatt for helping me fix the momentum =)
This panel shows the following:
-BTC LTC ETH prices on different exchanges listed on the panel.
-EMA above/below price 10/20/30/40/50/60/100/200/400 in form of symbols ( based on the "Momentum lines" script)
-MTF Momentum direction in form of symbols 1/3/5/15/30/45/1h/2h/4h/8h/12h/1D/1W/1M (based on the Momentum Divergence script waves)
This script allows you to see every momentum direction of every time frame, put all together into one panel. Making your life easier when scalping with "Momentum divergence" script.
Notes:
If you want me to plot more data into the panel, post a comment what else to add or how to improve the panel.

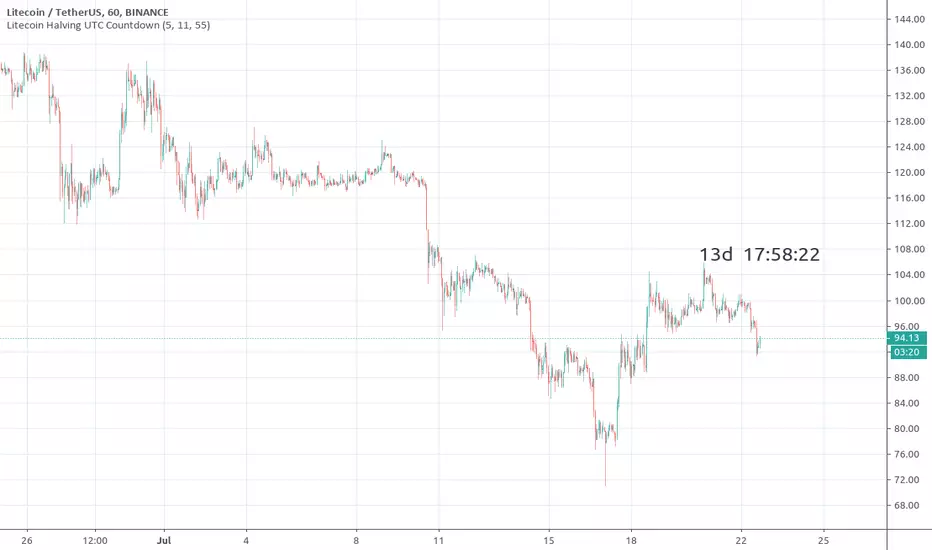
[RESEARCH] Litecoin Halving UTC CountdownAccording to this source www.litecoinblockhalf.com
The day, hour and minute of the halving date can be customized manually in case of mining troubles.
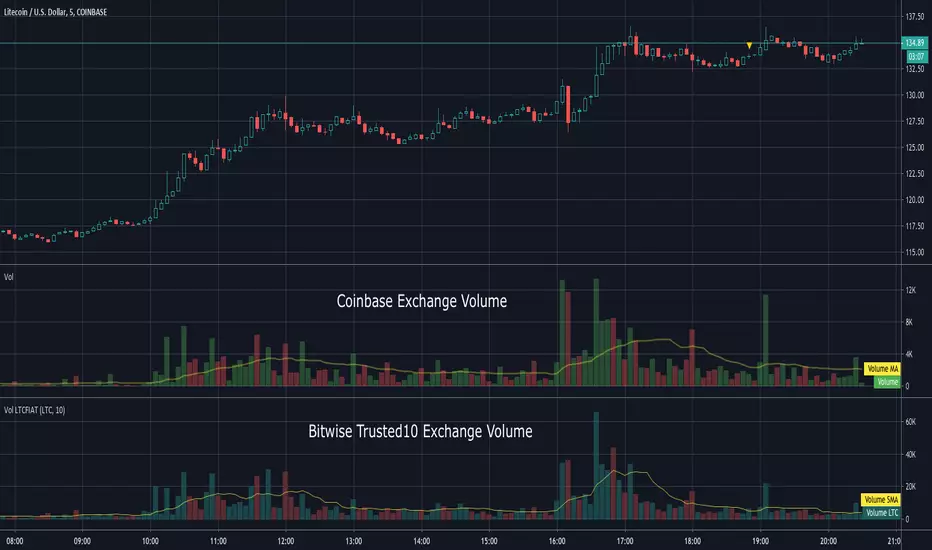
Volume LTCFIATThis indicator shows the aggregated volume of LTCFIAT of the Bitwise "Trusted 10" Exchanges that are available on TradingView.
I did not include every currency or stable coin available on these exchanges due to some being inconsequential in volume.
Volume can be shown in LTC or USD amounts. The moving average can be adjusted and if set to 0 will hide it.
Due to the number of lookups please be patient while loading. It will take a moment to display.
To load search Indicators for "Volume LTCFIAT" and click to load.
This indicator does not require access from me.
Litecoin Wizard (LTCUSD)Here is the complete market history of Litecoin available as an indicator.
Included are 2 simple moving averages and 2 exponential moving averages, as well as the Ichimoku cloud. You can deselect or configure them in the indicator settings.
Remember that this is an indicator! That means in order to see all the candles, you must apply it to a chart of an asset that is at least as old as the Litecoin data (October 2011). Here I use BNC:BLX, which is the complete Bitcoin market history.

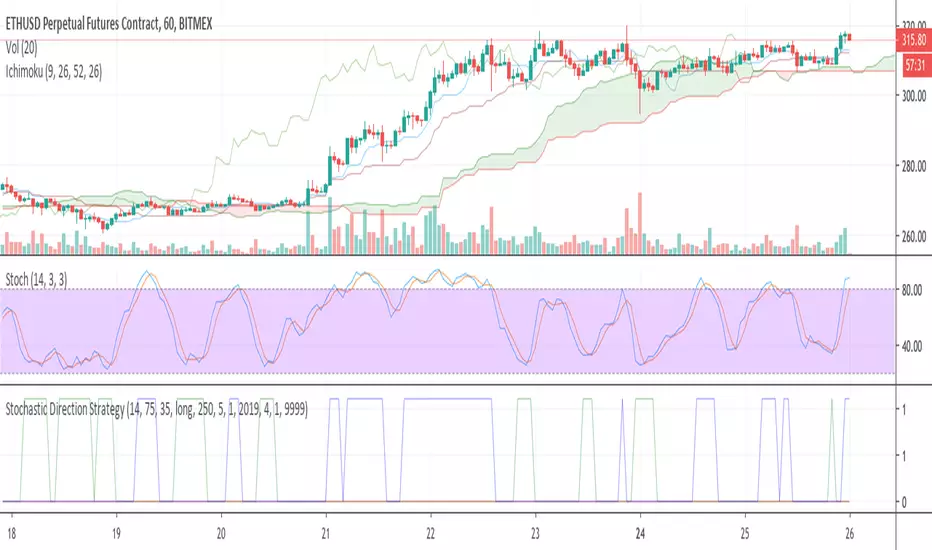
Stochastic Direction StrategyThis is a simple strategy based on the Stochastic Oscillator: stockcharts com/school/doku.php?id=chart_school:technical_indicators:stochastic_oscillator_fast_slow_and_full
Its purpose is to gradually build a position in a trending market (as of June 26th 2016 in most cryptocurrencies).
Inputs:
- direction (long/short)
- overbought/oversold
- close positions (yes/no to only increase positions)
Outputs:
- buy/sell/close signals plotted on a chart below
This script can easily be used as a TradingView study (for alerts) and a strategy (for backtesting). See the comments in the code.
I have added additional alert conditions to be used easily together with a trading bot reading the signals
Yet obviously you can also do manual trading on each alert.
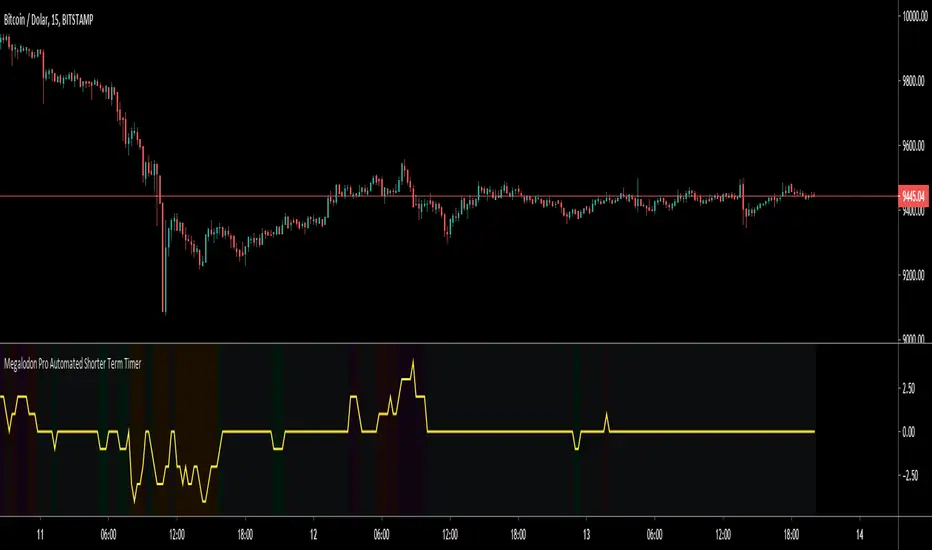
Megalodon Pro Automated Shorter Term TimerHow to use?
It should be used on 1 minute time frame for finding potential market reversal points.
It shows reversal signals by printing Green for Buy - Orange for Strong Buy - Red for Sell - Purple for Strong Sell signals.
Megalodon Pro Automated Longer Term TimerHow to use?
It should be used on DAILY time frame for finding potential market reversal points.
It shows reversal signals by printing Green for Buy - Orange for Strong Buy - Red for Sell - Purple for Strong Sell signals.

Megalodon Pro Automated Longer Term TraderHow to use?
Yellow line isolates between 0-100.
It should be used on DAILY time frame for understanding the market state.
It prints Green for Bull - Orange for Strong Bull - Red for Bear - Purple for Strong Bear signals.

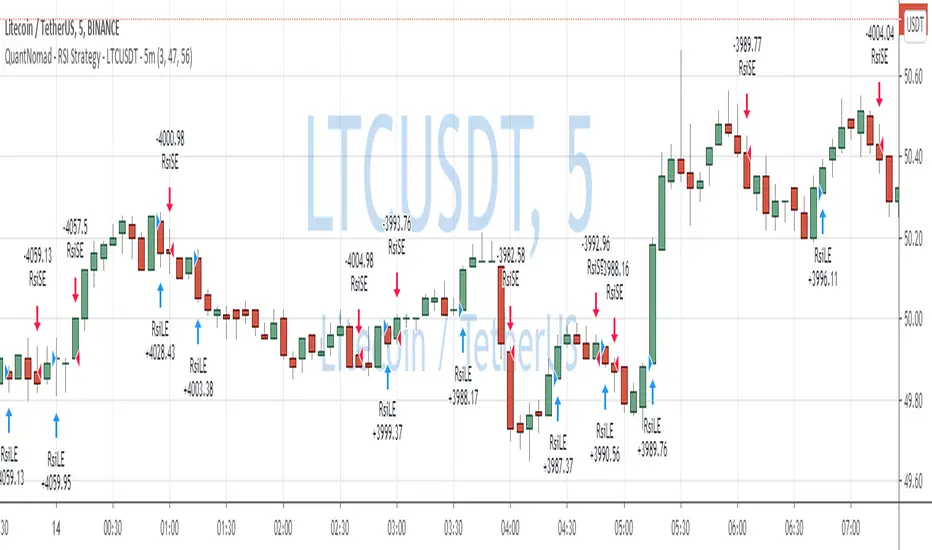
QuantNomad - RSI Strategy - LTCUSDT - 5mReally nice performance of Simple RSI Strategy for LTCUSDT ( Binance ) 5m chart.
Params: RSI Length: 3, RSI OverSold level: 47, RSI OverBought Level: 56
Performance: 391% profit, 2400 trades, 42% prof, 14.6% dd , 0.65 sharpe.
I think this strategy can be a really nice base for a pretty good strategy. We have quite a lot of trades here you can add additional filters that will improve strategy a bit.
And remember:
Past performance does not guarantee future results.