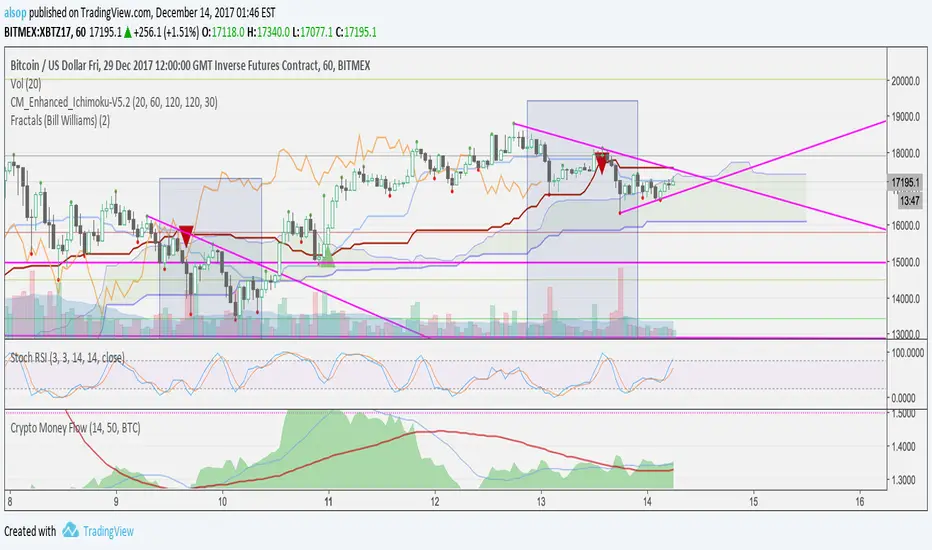
Crypto Money Flow RatioThis indicator shows you the movement of buyers and sellers in the market. Combined with other indicators like Stochastic RSI it can be a very powerful early indicator to buy and exit.
In this example, there are two moving averages applied to the indicator (at the bottom). Once the Fast crosses the Slow and the area is above both - this tells you the major market players are accumulating and you should be looking to long.
In addition, Stochastic RSI is also oversold and Ichimoku shows price above the cloud - all confluence on a long trade. As you can see, in the next hour price rocketed.
This size of move isn't always common, and this move may have been due to news. Even if so, people were aware and started buying and you could see it happen.
Another example here with DASH.
In this example, you can see there was a previous bull move that we applied a fib to and had a 38% retracement. We bought on the indicator cross and ratio above averages with a target of a 38% extension. It hit almost exactly and we closed out.
To apply this to other currencies, change the settings. For example, for ETHUSD - change the setting from BTC to ETH.
BITFINEX:BTCUSD
萊特幣(加密貨幣)
The Love B♥tPrivate invite only script - currently "LIVE TESTING".
Back test results look great. Doesn't repaint. A lot of people might be saying, why use H.A. and all that and its not reliable etc.
The current testing you see of NEO is using 1% commission rate to account for the price difference and also the usual 0.25% commission rate.
Also, sometimes with H.A., you will buy lower than listed price or buy higher than listed price. However, with the testing I have done, it averages out.
I recommend using anywhere between 1-4 hour charts.
The strategy is using a combination of few different indicators along with moving averages.


Crypto-Adjusted Parabolic Stop and Reverse (CAPSAR)Finally, a more accurate PSAR is here!
This PSAR will show up , and stick around when a majority of the Crypto-Currencies in the index below conform in the same direction.
The CAPSAR can be applied to any Crypto-currency and ANY time-frame!
This Crypto-Index makes up over 90% of the Crypto-Currency market cap (total global Crypto investment).
Bitcoin
Ethereum
Bitcoin Cash
Ripple
Litecoin
Nemcoin
Thick Blue lines beneath the price indicate a change in direction, and momentum up.
Thick Red lines above the price indicate a change in direction, and momentum down.
This indicators holds three editable parameters:
1. "Start" - The starting value for the Acceleration Factor (.02 is the Default).
2. "Increment" = The increment in which the Acceleration Factor will move (.02 is Default).
3. "Max" - The maximum value of the Acceleration Factor (.20 is the Default)

Best SuperTrend LTCUSDIf you want get access for super Trend with the best and optimum values for:
LTCUSD profit +%120
ETHUSD profit +%80 aka Best SuperTrend ETHUSD chart 30m
OMGUSD profit +%115
BCHUSD profit +%80
LTCUSD profit +%125
(XRP,DASH coming soon, these profits include trading fee %0.2)
Fee 0.015BTC per week
Contact me by chat for a free demo
LTCUSD
