Market God v6Advance your trading game by applying our TA based indicator-study on your charts. Market God v6 is a tool that can be added to any chart, timeframe, or ticker on https://tradingview.com, and suggests the situation at hand as an opportunity to buy or sell you interests.
Market God v6 Product Description
Advance and Improve your understanding of price movement using the Market God v6 Trading Study (accessed via tradingview.com)
* Set alerts to be delivered via email or SMS (See TradingView.com for limitations that may apply, based on your Tradingview account type)
* Quickly identify market trends with visual buy/sell alerts on chart
* Access charts on-the-go via Tradingview mobile app
* Apply study to any symbol within the entire Tradingview library
* Use on any timeframe available to you on Tradingview
Through use of tradingview.com’s advanced Pine Script programming language, I have spent thousands of hours to find the rights combination that has resulted in the indicator study you see today. That said, it is imperative to understand that this study is not a guarantee profit & should be far from the only reason you enter a trade. It is highly recommended that you backtest, or paper trade before using this study, as it is intended to be a tool, and not the end-all-be-all.
When starting, my goal was clear: to create a study that could suggest consistent, reliable, and accurate trades, at a rate of success that was either equal to, or better than if I were doing it myself. Ideally, I figured that if I could take my own personal buy/sell criteria, standardize it, and create an system that informed me once my own criteria was met, it would allow me to succeed on a more consistent basis, and allow me to focus on other projects.
But lets pull it back to way before this indicator was even on the map – to the middle of 2018, specifically the middle of crypto-winter. Like many, I started by doing something I believe every trader or investor should do: writing down the exact criteria that I would ultimately require that I hold myself, in order to enter or exit a position. I then demanded that I abide by that criteria when making any decision in trading. This was relatively easy, and also forced me to really understand where I went wrong, each time I would losing trade.
While establishing the trade plan, I ran through every study/indicator I used personally already, and utilized online resources to understand what made those indicators give the readings they do, and the various ways price movement and volume can be used to calculate trends.
By taking the wealth of knowledge available online, we have successfully created a study that applies these methods of TA, and standardizes a system of trading that was successfully established in the bear market.
萊特幣(加密貨幣)

50EMA + 52RSI Day TradeBased on the great day trading video by @TrueCrypto28 ( www.youtube.com ), this indicator is perfect for trading on Binance. Have tweaked it so it is based on the 50EMA instead of SuperTrend.
Default settings
Long signal will be given when RSI is above 52 on the hourly chart to confirm a higher timeframe bullish bias as well as price closing above the 50EMA on the 5 minute chart. High + Low + Close / 3 has been used to smooth signals.
Trade will be closed when price either closes below the 50EMA on the 5 minute or RSI drops above 52 on the hourly.
Colour coded candles included for ease of trading. Green = all signals met to buy. Red = sell.
Can change inputs to suite your style.

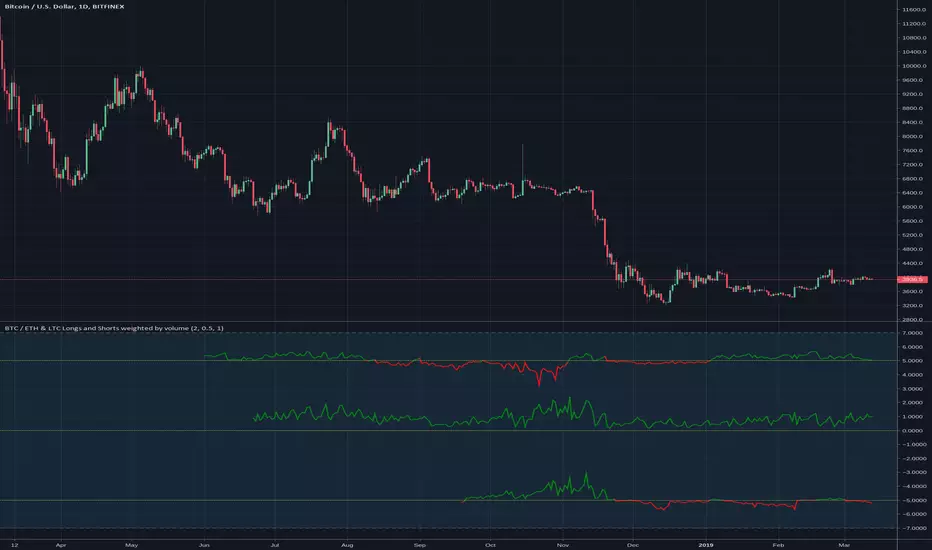
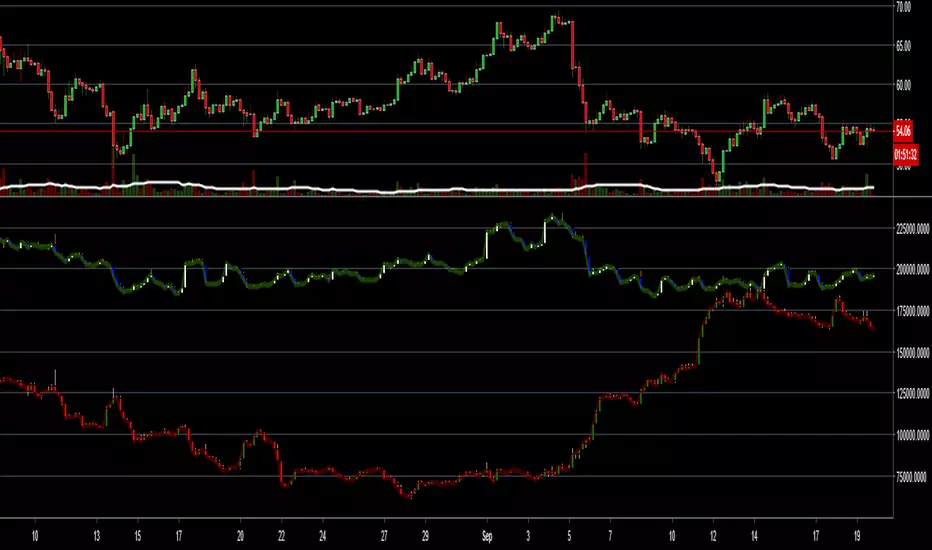
BTC / ETH & LTC Longs and Shorts weighted by volumeMy personal crypto market breadth.
The long and short contract come from Bitfinex, the daily volume for weighting is used from four different exchanges to average the result.
A line above the center line means more open long contracts (green) than open short contracts (red).
The upper indicator shows BTC ratio, the middle one ETH and the lower one LTC.

Aggregated Volume LTCBTCAggregates the LTC/BTC volume from multiple exchanges into a single indicator.
# Exchanges and Pairs
Included are only exchanges supported by TradingView:
* Binance
* Bitstamp
* Bittrex
* Coinbase
* Gemini
* Bitfinex
* Kraken
* Poloniex
* HitBTC
Many other top exchanges are not included, because they are not supported by TradingView.
# Inputs
By default the spot exchanges are selected. You can select also the other margin trading and derivatives exchanges.
# Contribute
Feel free to share any ideas and issues you have.
# Open Source
The code is open source @ github.com and uses the commonpine library github.com

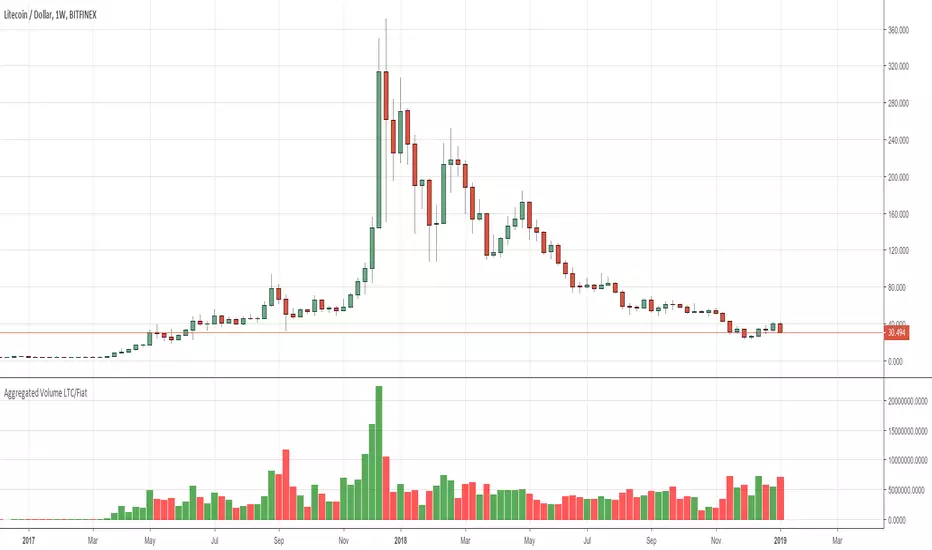
Aggregated Volume LTC/FiatAggregates the LTC/Fiat volume from multiple exchanges into a single indicator.
# Exchanges and Pairs
Included are only exchanges supported by TradingView:
* Binance
* Bitstamp
* Bittrex
* Coinbase
* Gemini
* Bitfinex
* Kraken
* Poloniex
* HitBTC
Many other top exchanges are not included, because they are not supported by TradingView.
The pair LTC/BTC is not included.
# Inputs
By default the spot exchanges are selected. You can select also the other margin trading and derivatives exchanges.
# Contribute
Feel free to share any ideas and issues you have.
# Open Source
The code is open source @ github.com and uses the commonpine library github.com
Bitfinex Longs/Shorts - Real numbersHere you go: real numbers of longs and shorts for most coins on Bitfinex. You can turn off the color between plots.

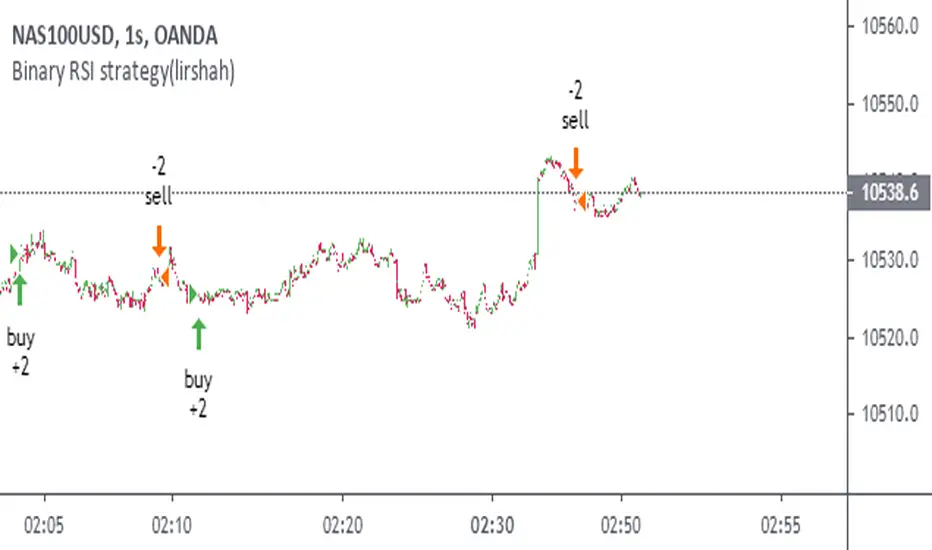
Binary RSI strategy(lirshah)Binary Rsi is one of the greatest strategies published by lirshah programming team.
it has a good operation on H2 ,H1, and M15 charts.
its better to say that this strategy can act such a money machine and
has a good result on almost all crypto currency pair:
LTCUSD – ETHUSD –BTCUSD- XBTUSD - ZECUSD –ETHBTC and …
Litecoin/USD Total VolumesHello traders!
This tool shows you Litecoin/USD total trade volumes from the all (well, almost) cryptocurrency exchanges on different timeframes.
Alerts included.
Supported timeframes
"1"
"3"
"5"
"10"
"15"
"30"
"45"
"60" - 1 hour
"120" - 2 hours
"180" - 3 hours
"240" - 4 hours
"300" - 5 hours
"360" - 6 hours
"420" - 7 hours
"480" - 8 hours
"540" - 9 hours
"600" - 10 hours
"660" - 11 hours
"720" - 12 hours
"780" - 13 hours
"840" - 14 hours
"900" - 15 hours
"960" - 16 hours
"1020" - 17 hours
"1080" - 18 hours
"1140" - 19 hours
"1200" - 20 hours
"1260" - 21 hours
"1320" - 22 hours
"1380" - 23 hours
"D"
"2D"
"3D"
"W"
"M"
How to get access
Buy for only 25$ to get lifetime access to this indicator
Like and follow for more cool indicators!
Happy Trading!

TradingLive24 System LTCUSDThis is a script for LTCUSD in 5 minutes resolution.
It will show you when you must to Buy, Sell or Exit from the Crypto.
The strategy has 80% of success. You can modify and adapt it to your requirements.
If you want to have more entries, you only need to modify the parameters 3 and 4, preferably with values less than 20.
Usually, the parameter 4 need to be grater than parameter 3.
The parameters 1 and 2 don't need to be modified, but you can touch them too.
Also, the TakeProfit1 and StopLoss1, usually are greater than TakeProfit2 and StopLoss2.
If you want more success percent, you can modify the TakeProfit with a smaller number.
Get 10-day Free Trial, just send us your TradingView Username here www.tradinglive24.com

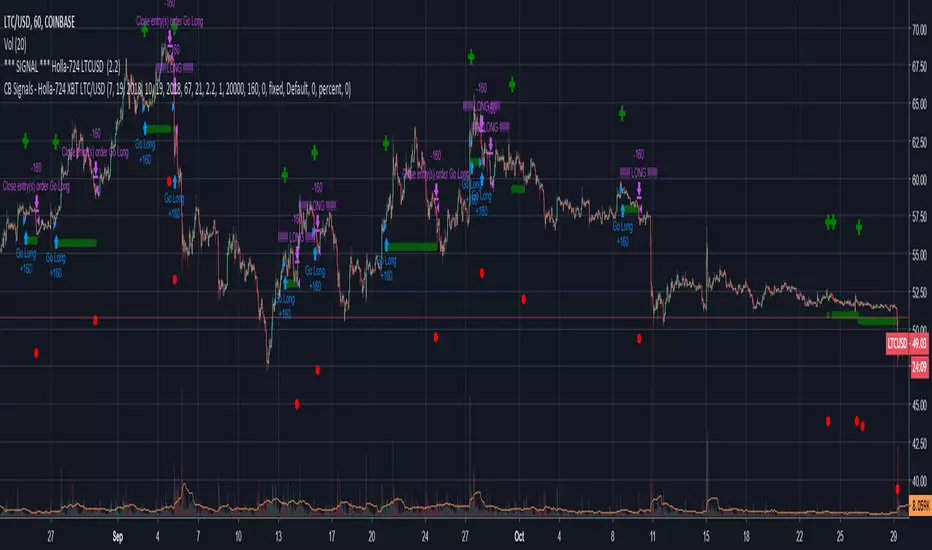
CB Signals - Holla-724 SPOT LTC/USD LONG ONLY (Paid Algo)This is the updated script with results for the last 3 months of the trading room July 19 - Oct 19th. This algo returned (-7.25%) vs. Buy and Hold returns of (-40.95%)
See details on performance in this period below by clicking the "Performance Summary" Tab
LTC Shorts & Longs (candles) - BitfinexSimilar version of my other scripts - this one is for LTCUSD Shorts and Longs in one indicator including the candles so you can see actual movement as well.
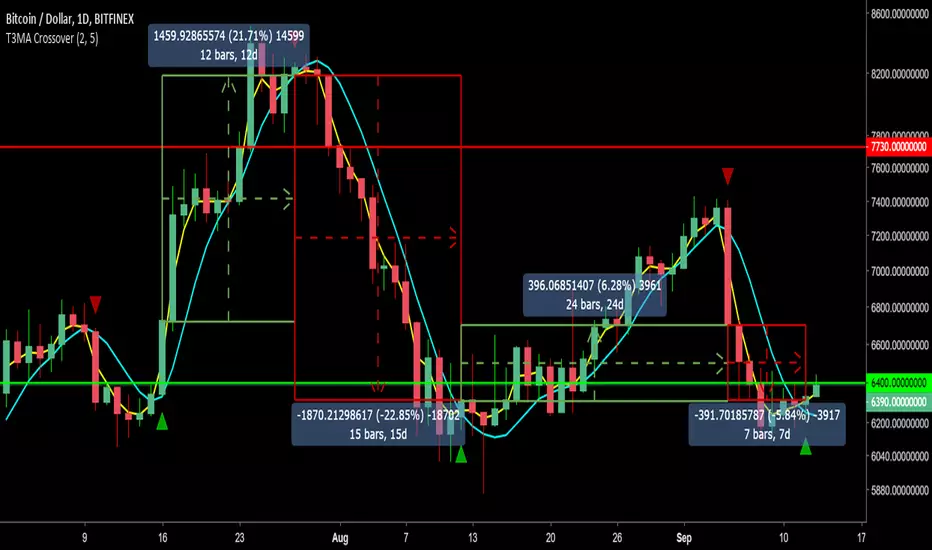
T3MA Crossover Strategy w/ Alerts v2.0Summary:
Using the T3MA formula developed by Tim Tillson, this differs from traditional SMA and EMA by providing a smoother curve and less lag. The smoothness is derived from the weighted sum of a single EMA through EMA 6 times.
How it works:
- Like any other crossover strategy.
- When fast MA crosses OVER the slow MA, go long.
- Close long and/or go short when the fast MA crosses UNDER the slow MA.
- Can keep flipping between long and short signals.
Quite a conservative strategy as it uses lagging indicators, not for intraday trading (you can, but I don't). Comes into it's own in trending markets as long as you stick to the signals.
Alert messages:
- Long
- Short
How I use it:
- My defaults are set at 2 fast MA and 5 slow MA to ride trends as close as possible.
- On BTCUSD and other altUSD pairs, I tend to use a daily time frame.
- On altBTC pairs, I tend to use a 12H time frame.
- Action on candle close at momentum confirmation (have seen numerous examples of a signal reversing mid candle into a dump).
Will need to be able to short altcoins to make the most of it, or it will at least keep you out of sustained downtrends (=/= holding).
Backtest it on bitcoin and other large cap alts on high time frames to see for yourself. For lazy trading, can set up alerts with AutoView.
0.1ETH for lifetime access. Message for details and support.
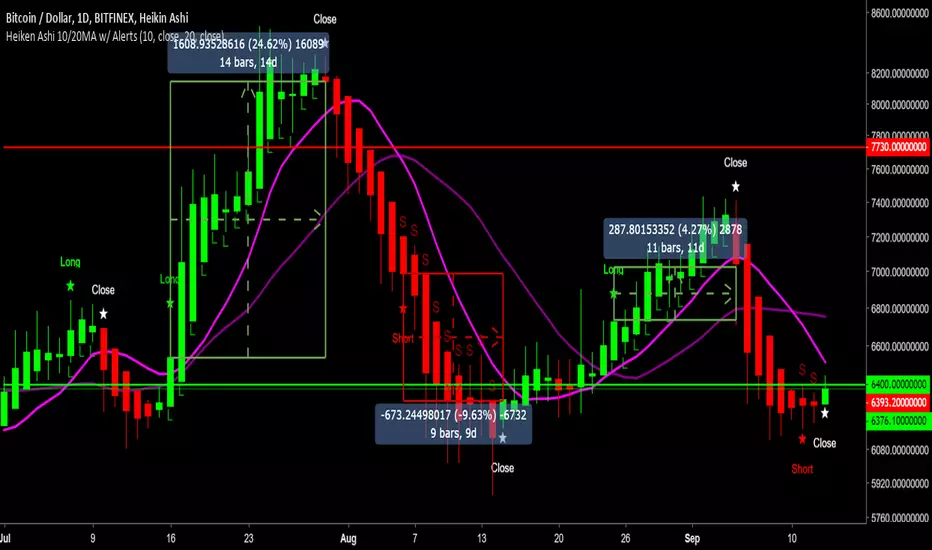
Heiken Ashi 10/20MA w/ Alerts v2.0Summary:
Using Heiken Ashi candles and default 10 and 20 Moving Averages for crossover signals to determine signals to go long, short and close trades.
How it works:
- Is the 10MA above the 20MA and a bullish candle? If yes, open a long.
- Will close the trade at the first bearish candle.
- Reverse this for going short.
- If you can't short, just close your long and hold till the next long signal.
Quite a conservative strategy, not for day trading. Comes into it's own in trending markets as long as you stick to the signals.
Alert messages:
- Long
- Short
- Close
Backtesting results:
XBTUSD = 85.9% (Bitmex)
LTCUSD = 75.6% (Bitfinex)
ETHUSD = 73.8% (Bitfinex)
NEOBTC = 83.9% (Binance)
TRXBTC = 79.4% (Binance)
EOSBTC = 88.1% (Binance)
Will need to be able to short altcoins to make the most of it, or at least will at least keep you out of sustained downtrends (=/= holding).
Backtest it on bitcoin and other large cap alts on high time frames to see for yourself. For lazy trading, can set up alerts with AutoView.
0.1ETH for lifetime access. Message for details and support.
Check out my other scripts.
Heiken Ashi 10/20MA w/ AlertsHeiken Ashi 10/20MA script with alerts.
General premise:
- Is the 10MA above the 20MA and a bullish candle? If yes, open a long.
- Will close the trade at the first bearish candle.
- Reverse it for going short.
Quite a conservative strategy, not for day trading.
Alerts:
- Long
- Short
- Close
Will need to be able to short altcoins to make the most of it, but will at least keep you out of sustained downtrends.
Backtest it on bitcoin and other large cap alts on high time frames. For lazy trading, can set up alerts with AutoView.
Check out my other scripts.

DachsundAlright so I updated the Holy Trinity Script because its not three indicators now its at least 5 indicator conditions that result in colored candles.
Blue Candles: Sell Alert, implies that now might be a good time to sell. If you hold through multiple blue candles, average out the two prices and create your stop loss there.
White Candles: Sell signal, implies that you should probably sell. I've made it to where a white candle is seldom rare, so if you have not sold by then - take this as a signal and not a warning.
Black Candles: Long Alert, implies that a good buy area is incoming. You can buy on black candles but I would not do it with high leverage. I've weeded out conditions that make black candles appear in a bear trend, but low leverage is still always necessary for these candles.
Yellow Candles: Long Signal, The Golden Signal, The Dachshund. Buy here for the love of Christ, that's all it is saying. Hold strong, better room for higher leverage, hold for a while and reap the benefits. If you miss a candle like this it isn't too late feel free to go long as long as the price is within a reasonable percentage. Never chase pumps ;)
Best if used on 30min, 45min, and 1hr-4hr.

Bitfinex Longs/Shorts Multi-Coin [acatwithcharts]This script plots the longs/shorts ratio derived from Bitfinex for BTCUSDLONGS, BTCUSDSHORTS, and similar for 11 top cryptocurrencies chosen selected based on marketcap, trading volume on Bitfinex, and the maximum number of times that TradingView would let me call the "security" function in one script. Included coins:
BTC, ETH, LTC, BCH, XRP, EOS, IOT (IOTA), ETC, ZEC, NEO, XMR
In addition to just plotting the ratios for the individual coins, this script also calculates for a customizable selection of the 11 coins both the average ratio and a weighted average weighted by (USD price of coin * sum of long and short positions).
I wrote it both to use both for a big picture overview of leveraged positions across major coins and to use as a Swiss army knife of longs/shorts ratio indicators for individual coins, most of which do not currently have individual scripts published.
I'm an amateur and you definitely shouldn't take anything I say or use any of my scripts as financial advice. I'd appreciate any feedback.


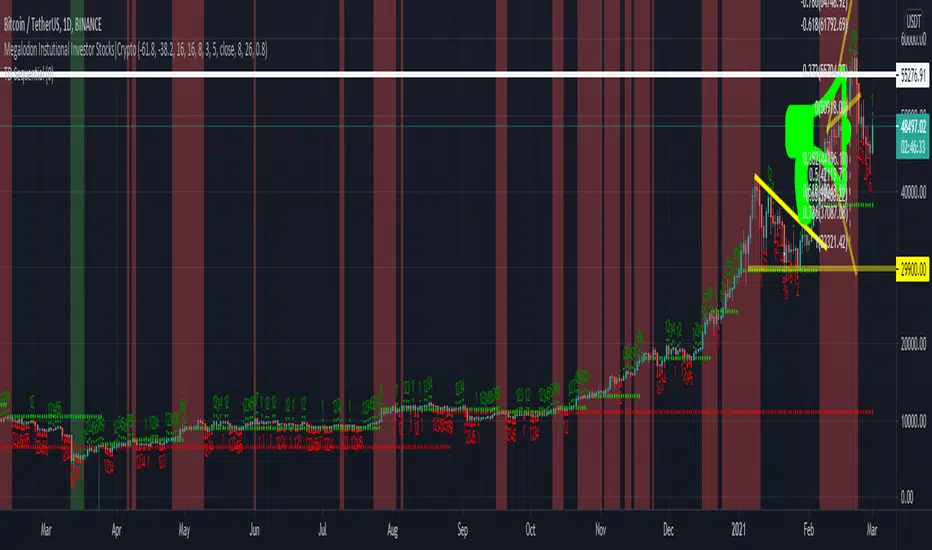
iPyra◬_theMegalodonTHEMEGALODON
theMegalodon looks for the institutional finger prints, the whales or the big boys.
theMegalodon is really simple to use.
theMegalodon combines the 8 different unique indicators, that each have almost perfect success rate.
theMegalodon works with any kind of market state, any kind of trading, and any kind of asset.
theMegalodon has more features than any other indicator in the market: Out of 9 working indicators, we have 3 momentum, 3 price and 3 volume indicators showing you the best signals.
--------------------------------------
theMegalodon is designed for us, the small fishes in the ocean, the millennials, the college students. This will basically makes us the new Megalodons(whale hunters).
All you have to do is:
1- Look for green or red arrows.
2- Look for orange or red candles.
3- Repeat
--------------------------------------
TECHNICAL DETAILS
Some boring info that you don't necessarily need to know.
1- Draws fibonacci retracement (s)' levels depending on your preferred look back period (Default: 365 and 120)
i) Can draw 2 fibs on the same chart. Can reverse the fib levels. Even, add an additional fib level to look for.
ii) Automatic fill function for a Reload Zone inside of a Reload Zone. *61.8% levels to 100% levels or 0% levels
2- Changes the color of the candle when strong buy(orange) or strong sell(red). Draws arrows on the chart for long and short positions.
i) Analyses and Combines
a) Price
b) Momentum
c) Volume
3- Prints out the indicators that are either giving Short or Long signs on the right corner.
4- The closer the unclebo indicator(click enable UncleBo) gets to the All time high, the better buy it is.
i) Same with the other way around. The closer it gets to the 0, the better sell it is.
5- Draws Bollinger Bands on the chart and shows where to buy or sell
6-The indicator is designed to be used in Daily time frame for the best calls to short or long.
--------------------------------------------------
iPyra◬
Enlighten others
UncleBo EasyVersion_BETAHey friends,
The Beta version of UncleBo indicator.
Trying to make it as simple and powerful as possible.
I will publish it once i feel like it does the job perfect.
----------------------
For more details and inquiries please pm me.

LTC Arb ObserverTracks Litecoin price variance across 6 exchanges. Code mostly stolen from Spreadeagle1's "Crypto Strength" script. Could easily be modified to track a different crypto/magic internet coin. Enjoy
