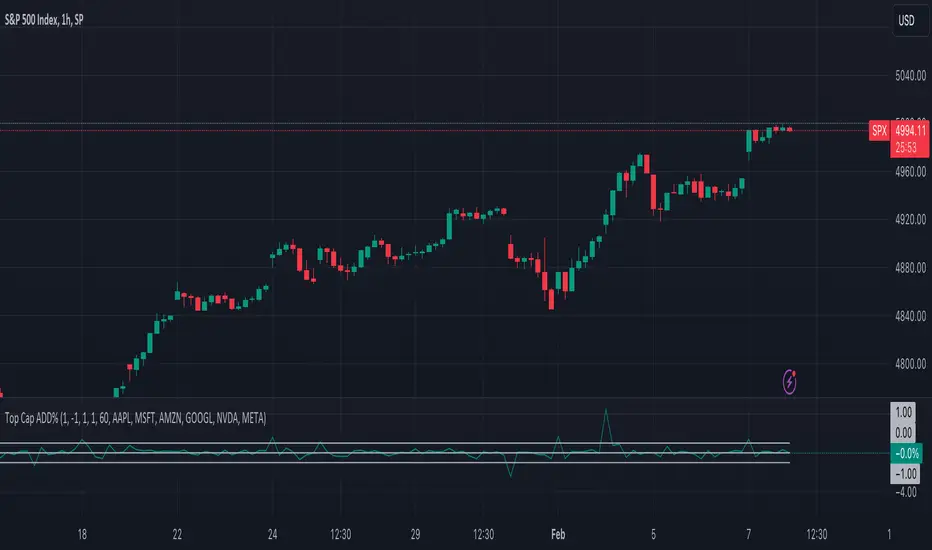
Top Cap ADD%This is a very basic oscillator that plots the average % change of the top 5 highest market cap stocks in the S&P500. It can be easily modified to suit your needs on which stocks you'd like to track, and or filter out the threshold you're looking for.
M-oscillator
Asset Rotation ApertureAsset Rotation Aperture visualizes volume accumulation momentum, of multiple assets, side by side.
It's a surgical, multi-purpose leading indicator of price, market narratives and capital rotation.
Each colored line represents the rolling cumulative volume (or open interest) of an asset, index, narrative, or symbol equation. Normalized to each other, relative to each other.
This enables Asset Rotation Aperture to visualize assets and narratives with dramatically different market caps (and therefore different volume accumulation profiles), side by side.
METRIC CONSTRUCTION
Asset Rotation Aperture is a fork of Money Flow Index, like a centered On Balance Volume.
Modified to more effectively lead price, smoothed to more clearly visualize with clarity, and recursively printed.
SYMBOL SELECTION
I highly recommend selecting symbols from exchanges that dominate volume for the asset(s) you're visualizing.
For crypto, this typically means Binance pairs.
Keep the exchange consistent across symbols whenever possible.
To construct an index / narrative, use the following formula format:
(BINANCE:UNIUSDT*BINANCE:SNXUSDT*BINANCE:AAVEUSDT*BINANCE:CRVUSDT)^(1/4)
THE Y AXIS
The Y axis represents the asset's percentage of volume accumulated, relative to its norm AND relative to other assets.
It's a made up figure, and I recommend ignoring it.
A visual scan of the data viz is more effective than studying any Y-axis output.

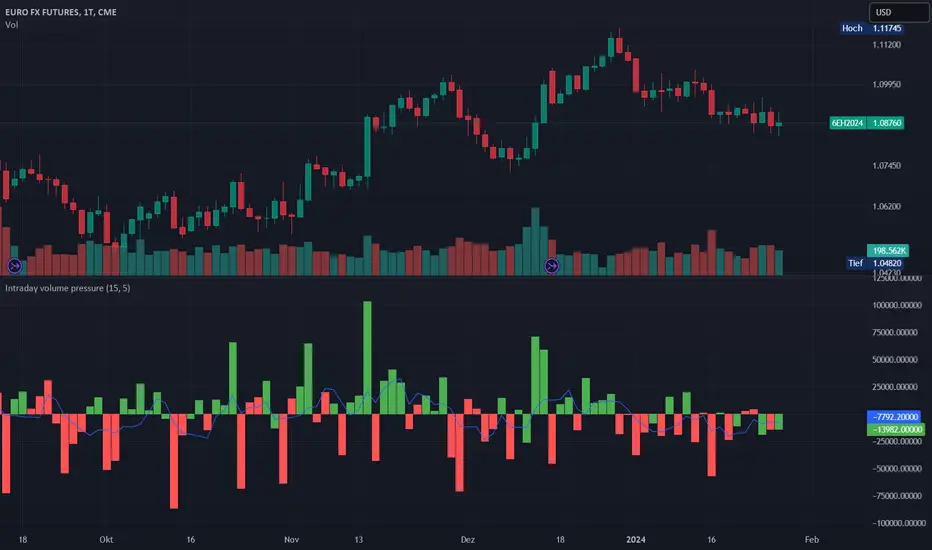
Intraday volume pressureThis indicator shows the difference of bullish and bearish trading volume during intraday
The idea
Especially in "6E1!" it caught my eye, that often outside regular trading hours the price moves in one direction with thin volume and inside regular trading hours it moves back with much higher volume. It is possible, that the market closes e.g. with a plus. And over some days maybe you can see e.g. weak rising prices. But in this time the movements with high volume are going down every day. And one day - maybe within view minutes - the market rushs a level deeper.
Maybe some are manipulating the market in this way, maybe not, it doesn't matter. So my question was, can I find a way to show such divergences? I guess I can do.
How to use this indicator
Use it at your own risk! I don't take over any responsibility. You are the only one, who is responsible for your decisions. Always collect information from different independent sources!
Watch it in the daily chart - not intraday, not weekly! Of course this indicator just analyzes the past as all indicators. Everytime everything may happen that influences the market in any direction, no indicator can predict any news.
Watch it in sideways market or when the price is moving quite slow over days! An average volume pressure
below zero shows a volume-driven bearish pressure
above zero shows a volume-driven bullish pressure
of the last days. So there is a chance, that the market may follow the volume pressure within the next days. But of course, I cannot guarantee anything. The indicator just can give you an idea, why this will happen, when it will happens. Otherwise, the indicator indicated nothing helpfull.
Of course you also can try other securities. Maybe it will work there better or worse - difficult to say. I guess, it depends on the market.
Possible settings aside of colors
Intraday minute bars: Default is 15 minutes, in 6E in my point of view it is a good value. If you choose a smaller value, the chart gets too noisy, the results are getting too small. With a bigger timeframe some moves are hidden in bigger candles, the results are getting a large spread
Average over days: Default is 5 days - so one week. In 6E in my point of view it is a good value. A smaller value is too noisy. A bigger value reacts too slow. Often 6E has a trend over weeks. Sometimes it changes within some days - the indicator may help. But sometimes the market changes with a buying or selling climax. Such a case this indicator cannot recognize. But with the 5 days average maybe you get a change in the indicator within one or two days. Anyway, it is always a good idea to learn recognizing climaxes otherwise.
How the indicator works
It uses the function request.security_lower_tf to get the intraday candles. The volume of intraday up-candles is added to the intraday summary volume. The volume of down candles is substracted from the intraday summary volume.
In the oscillator area I plot a green bar on a day with a higher close than open and a red bar on a day with a lower close than open. The bar has a positive value, if the volume pressure is positive and a negative value if the volume pressure is negative. So it happens, that a green bar has a negative value or a red bar has a positive value.
The average is calculated with a floating sum. Once we have enough days calculated, I devide the floating sum by the length of the "Average over days" and plot the result. Then I substract the first value of the queue and I remove it.
SuperTrend Fisher [AlgoAlpha]🚀🌟 Introducing the "Super Fisher" by AlgoAlpha, a sophisticated and versatile tool crafted for the discerning trader. This innovative indicator merges the precision of the Fisher Transform with the adaptability of the SuperTrend methodology, offering a fresh perspective on market analysis. 📈🔍
Key Features:
🔶 Customizable Settings: Tailor the indicator to your trading style with adjustable inputs like "Fair-value Period" and "EMA Length". Choose your preferred "Up Color" and "Down Color" for a personalized visual experience.
🔶 Advanced Fisher Transform: At the heart of this tool is the Fisher Transform, an algorithm renowned for pinpointing potential price reversals by normalizing asset prices.
🔶 Integrated SuperTrend Functionality: This feature adds a layer of trend analysis, using the refined Fisher Transform values to generate dynamic, trend-following signals.
🔶 Enhanced Visualization: Clearly distinguishable bullish and bearish market phases, thanks to the color-coded plots of Fisher Transform and SuperTrend values.
🔶 Overbought/Oversold Levels: Visual plots and fills for these levels provide additional insights into market extremities.
🔶 Configurable Alerts: Stay informed with alerts for critical market movements like crossing the zero line or the SuperTrend.
Logic:
The "Super Fisher" operates on a sophisticated algorithm:
1. Fisher Transform Calculation: It starts by calculating the Detrended Price Oscillator (DPO) and its standard deviation. These values are then transformed using the Fisher Transform formula, which is subsequently smoothed with a Hull Moving Average.
2. SuperTrend Integration: The SuperTrend function employs the Fisher Transform values to create a dynamic trend-following tool. It calculates upper and lower bands and determines which one to use for market direction based on whether the fisher is above or below the bands, offering an insightful view of the price trend.
3. Overbought/Oversold Identification: The tool plots specific levels to indicate overbought and oversold conditions, aiding in the identification of potential reversal points.
Here's a closer look at the core calculations:
Calculates the Fisher Transform:
value = 0.0
value := round_(.66 * ((src - low_) / (high_ - low_) - .5) + .67 * nz(value ))
fish1 = 0.0
fish1 := .5 * math.log((1 + value) / (1 - value)) + .5 * nz(fish1 )
fish1 := ta.hma(fish1, l)
Calculates the SuperTrend:
supertrend(factor, atrPeriod, srcc) =>
src = srcc
atr = atrr(srcc, atrPeriod)
upperBand = src + factor * atr
lowerBand = src - factor * atr
prevLowerBand = nz(lowerBand )
prevUpperBand = nz(upperBand )
lowerBand := lowerBand > prevLowerBand or srcc < prevLowerBand ? lowerBand : prevLowerBand
upperBand := upperBand < prevUpperBand or srcc > prevUpperBand ? upperBand : prevUpperBand
int direction = na
float superTrend = na
prevSuperTrend = superTrend
if na(atr )
direction := 1
else if prevSuperTrend == prevUpperBand
direction := srcc > upperBand ? -1 : 1
else
direction := srcc < lowerBand ? 1 : -1
superTrend := direction == -1 ? lowerBand : upperBand
How to Use:
📊 To maximize the potential of the "Super Fisher", follow these steps:
1. Customize Settings: Adjust the inputs to match your trading preferences. This includes setting the periods for the Fisher Transform and SuperTrend, as well as choosing colors for better visualization.
2. Analyze the Market: Observe the Fisher Transform and SuperTrend plots to gauge market direction. Pay special attention to color changes, as they indicate shifts in market sentiment.
3. Identify Extremes: Use the overbought and oversold plots to understand potential reversal points.
4. Set Alerts: Utilize the alert functionality to stay informed about significant market movements, ensuring you never miss an opportunity.
🔥 In summary the "Super Fisher" is a comprehensive market analysis tool designed to enhance your trading insights and decision-making process. 📉🌟🚨

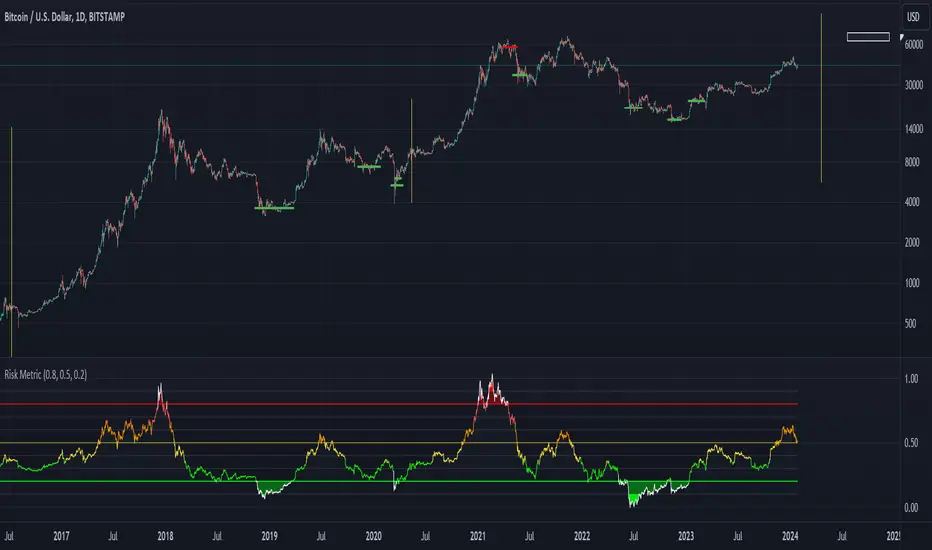
Risk Metric combinedAttempt at replicating a simplified Risk-Metric for BTC.
Original code written by user Oakley Wood.
Based on 3 different approaches:
- deviation from 4 year sma
- ln(btc / 20 wma)
- 50D MA / 50W MA
QQE MOD + SSL Hybrid + Waddah Attar Explosion IndicatorINDICATOR PURPOSE
This indicator is designed to complement my original QQE MOD + SSL Hybrid + Waddah Attar Explosion strategy.
Multiple users have requested that I convert the strategy to an indicator because alertconditions do not work on strategies and people want to specific set alerts for BUY, SELL, CLOSE BUY and CLOSE SELL. This can only be achieved using alertcondition().
This indicator functions in the exact same way as the strategy, but it doesn't have any backtesting functionality. I recomment that you use the original QQE MOD + SSL Hybrid + Waddah Attar Explosion strategy for parameter tuning and backtesting, then if you need more control on alerts you can use this indicator for that purpose.
Only other difference is that I have added grey exit labels on the chart since it's not obvious where the exits would happen like it was in the strategy version.
CREDITS
QQE MOD byMihkel00
SSL Hybrid by Mihkel00
Waddah Attar Explosion by shayankm

RSI in Candlestick MODEDescription:
The "RSI Bar" indicator is a versatile tool designed to enhance your technical analysis on trading charts. This Pine Script™ code calculates the Relative Strength Index (RSI) for open, close, high, and low prices, and represents the results as bars on the chart. The bars are color-coded based on whether the closing RSI is higher or lower than the opening RSI.
Additionally, the indicator incorporates advanced features such as Pareto analysis and Gaussian smoothing. The Pareto analysis helps identify significant lows and highs in the RSI, providing insights into potential trend reversals. The Gaussian smoothing further refines the analysis, contributing to a more accurate representation of the average RSI trend.
Key Features:
RSI calculation for open, close, high, and low prices.
Color-coded bars for easy visualization of RSI trends.
Pareto analysis to highlight key RSI levels indicating potential reversals.
Gaussian smoothing for improved trend analysis and visualization.
Heiken-Ashi

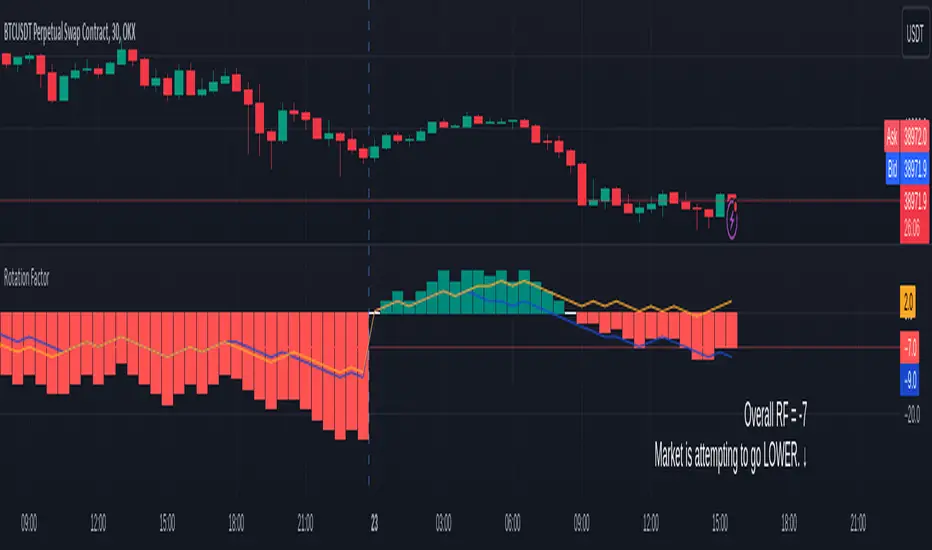
Rotation Factor for TPO and OHLC (Plot)The Rotation Factor objectively measures attempted market direction(or market sentiment) for a given period. It records the cumulative directional attempts of auction rotations within a given period, thus, helping traders determine which way the market is trying to go and which market participant is exerting greater control or influence.
Theory
The premise is that a greater number of bars auctioning higher contrasted to bars auctioning lower indicates that buyers are exerting greater control over price within the given period(usually daily). In this case, the market is attempting to go higher (Market is Bullish). The same is true for a greater number of bars auctioning lower than higher, which, in this case, indicates that the sellers are exerting greater control over price within the given period and that the market is attempting to go lower (Market is Bearish).
Calculation
Each bar is individually measured in relation to the immediate previous bar, and calculations are reset at the beginning of each period.
For every bar, two variables are utilised: One for the highs and another for the lows. During bar start, these variables are initiated at 0.
As the period progresses, these variables are set accordingly: If the high of the current bar is higher than that of the previous bar, then the bar's highs variable is assigned a "+1". If the opposite is true, it is given a "-1". Finally, if both bar highs are equal, it is, instead, assigned a "0". The same is true for the lows: if the low of the current bar is higher than that of the previous low, then the bar's lows variable is assigned a "+1". Similarly, the opposite is given a "-1", while equal lows causes it to be assigned a "0". All highs and lows are then summed together resulting to a total, which becomes the Rotational Factor.
Presentation
Furthermore, this Rotation Factor Indicator is presented as a plot, which, unlike its classic variation, shows you how the rotation factor is developing. It also includes lines indicating the Top Rotation Factor and the Bottom Rotation Factor individually, the better to observe the developing auction.
Link to the Classic Variation:
Features
1. Customisable Tick Size/Granularity : The calculation tick size/ granularity is customisable which can be accessed through the indicator settings.
2. Customisable Labels and Lines : The colour and sizes used by the labels and lines are customisable the better for accessibility.
3. Period Separator : A separator is rendered to represent period borders (start and end). If separators are already present on your chart, you can remove them from the indicator settings.
4. Individual Top Rotation Factor and Bottom Rotation Factor plots : These two parts which becomes of the Rotation Factor are also presented individually, on their own plots, the better to observe the developing auction.
Works for both split Market Profile(TPO) charts and regular OHLC bars/candle charts
The Rotation Factor is usually used with a Split Market Profile (TPO). However, if no such tool is available, you will still be able to benefit from the Rotation Factor as the price ranges of Split Market Profiles and OHLC bars/candles are one and the same. In such cases, it is recommended that you set your chart to use a 30 minute timeframe and the indicator's period to "daily" to simulate a Split Market Profile.
Note :
The Rotation Factor is, to quote, "by no means not an all-conclusive indication of future market direction.". It only helps determine which way the market is trying to go by objectively measuring the market's directional attempts.
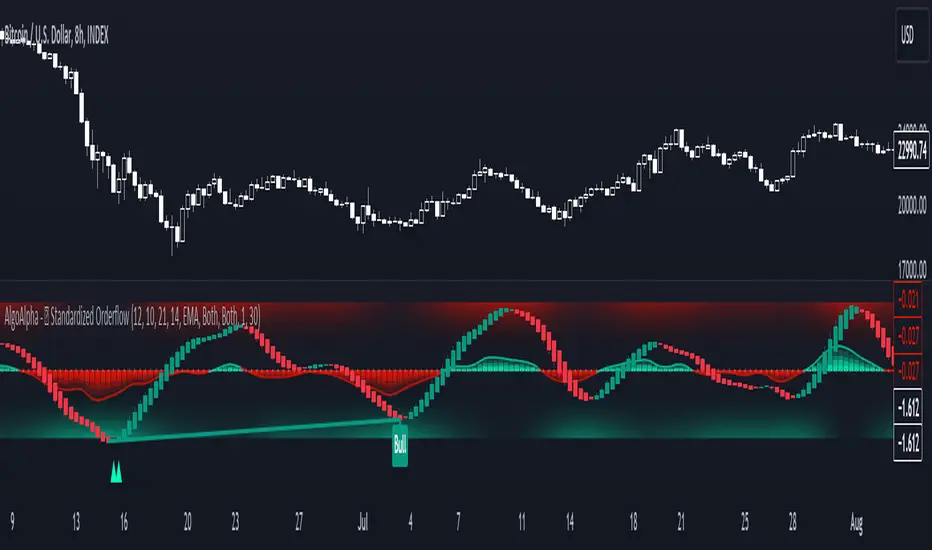
Standardized Orderflow [AlgoAlpha]Introducing the Standardized Orderflow indicator by AlgoAlpha. This innovative tool is designed to enhance your trading strategy by providing a detailed analysis of order flow and velocity. Perfect for traders who seek a deeper insight into market dynamics, it's packed with features that cater to various trading styles. 🚀📊
Key Features:
📈 Order Flow Analysis: At its core, the indicator analyzes order flow, distinguishing between bullish and bearish volume within a specified period. It uses a unique standard deviation calculation for normalization, offering a clear view of market sentiment.
🔄 Smoothing Options: Users can opt for a smoothed representation of order flow, using a Hull Moving Average (HMA) for a more refined analysis.
🌪️ Velocity Tracking: The indicator tracks the velocity of order flow changes, providing insights into the market's momentum.
🎨 Customizable Display: Tailor the display mode to focus on either order flow, order velocity, or both, depending on your analysis needs.
🔔 Alerts for Critical Events: Set up alerts for crucial market events like crossover/crossunder of the zero line and overbought/oversold conditions.
How to Use:
1. Setup: Easily configure the indicator to match your trading strategy with customizable input parameters such as order flow period, smoothing length, and moving average types.
2. Interpretation: Watch for bullish and bearish columns in the order flow chart, utilize the Heiken Ashi RSI candle calculation, and look our for reversal notations for additional market insights.
3. Alerts: Stay informed with real-time alerts for key market events.
Code Explanation:
- Order Flow Calculation:
The core of the indicator is the calculation of order flow, which is the sum of volumes for bullish or bearish price movements. This is followed by normalization using standard deviation.
orderFlow = math.sum(close > close ? volume : (close < close ? -volume : 0), orderFlowWindow)
orderFlow := useSmoothing ? ta.hma(orderFlow, smoothingLength) : orderFlow
stdDev = ta.stdev(orderFlow, 45) * 1
normalizedOrderFlow = orderFlow/(stdDev + stdDev)
- Velocity Calculation:
The velocity of order flow changes is calculated using moving averages, providing a dynamic view of market momentum.
velocityDiff = ma((normalizedOrderFlow - ma(normalizedOrderFlow, velocitySignalLength, maTypeInput)) * 10, velocityCalcLength, maTypeInput)
- Display Options:
Users can choose their preferred display mode, focusing on either order flow, order velocity, or both.
orderFlowDisplayCond = displayMode != "Order Velocity" ? display.all : display.none
wideDisplayCond = displayMode != "Order Flow" ? display.all : display.none
- Reversal Indicators and Divergences:
The indicator also includes plots for potential bullish and bearish reversals, as well as regular and hidden divergences, adding depth to your market analysis.
bullishReversalCond = reversalType == "Order Flow" ? ta.crossover(normalizedOrderFlow, -1.5) : (reversalType == "Order Velocity" ? ta.crossover(velocityDiff, -4) : (ta.crossover(velocityDiff, -4) or ta.crossover(normalizedOrderFlow, -1.5)) )
bearishReversalCond = reversalType == "Order Flow" ? ta.crossunder(normalizedOrderFlow, 1.5) : (reversalType == "Order Velocity" ? ta.crossunder(velocityDiff, 4) : (ta.crossunder(velocityDiff, 4) or ta.crossunder(normalizedOrderFlow, 1.5)) )
In summary, the Standardized Orderflow indicator by AlgoAlpha is a versatile tool for traders aiming to enhance their market analysis. Whether you're focused on short-term momentum or long-term trends, this indicator provides valuable insights into market dynamics. 🌟📉📈
Standardized Median Proximity [AlgoAlpha]Introducing the Standardized Median Proximity by AlgoAlpha 🚀📊 – a dynamic tool designed to enhance your trading strategy by analyzing price fluctuations relative to the median value. This indicator is built to provide clear visual cues on the price deviation from its median, allowing for a nuanced understanding of market trends and potential reversals.
🔍 Key Features:
1. 📈 Median Tracking: At the core of this indicator is the calculation of the median price over a specified lookback period. By evaluating the current price against this median, the indicator provides a sense of whether the price is trending above or below its recent median value.
medianValue = ta.median(priceSource, lookbackLength)
2. 🌡️ Normalization of Price Deviation: The deviation of the price from the median is normalized using standard deviation, ensuring that the indicator's readings are consistent and comparable across different time frames and instruments.
standardDeviation = ta.stdev(priceDeviation, 45)
normalizedValue = priceDeviation / (standardDeviation + standardDeviation)
3. 📌 Boundary Calculations: The indicator sets upper and lower boundaries based on the normalized values, helping to identify overbought and oversold conditions.
upperBoundary = ta.ema(positiveValues, lookbackLength) + ta.stdev(positiveValues, lookbackLength) * stdDevMultiplier
lowerBoundary = ta.ema(negativeValues, lookbackLength) - ta.stdev(negativeValues, lookbackLength) * stdDevMultiplier
4. 🎨 Visual Appeal and Clarity: With carefully chosen colors, the plots provide an intuitive and clear representation of market states. Rising trends are indicated in a shade of green, while falling trends are shown in red.
5. 🚨 Alert Conditions: Stay ahead of market movements with customizable alerts for trend shifts and impulse signals, enabling timely decisions.
alertcondition(ta.crossover(normalizedValue, 0), "Bullish Trend Shift", "Median Proximity Crossover Zero Line")
🔧 How to Use:
- 🎯 Set your preferred lookback lengths and standard deviation multipliers to tailor the indicator to your trading style.
- 💹 Utilize the boundary plots to understand potential overbought or oversold conditions.
- 📈 Analyze the color-coded column plots for quick insights into the market's direction relative to the median.
- ⏰ Set alerts to notify you of significant trend changes or conditions that match your trading criteria.
Basic Logic Explained:
- The indicator first calculates the median of the selected price source over your chosen lookback period. This median serves as a baseline for measuring price deviation.
- It then standardizes this deviation by dividing it by the standard deviation of the price deviation over a 45-period lookback, creating a normalized value.
- Upper and lower boundaries are computed using the exponential moving average (EMA) and standard deviation of these normalized values, adjusted by your selected multiplier.
- Finally, color-coded plots provide a visual representation of these calculations, offering at-a-glance insights into market conditions.
Remember, while this tool offers valuable insights, it's crucial to use it as part of a comprehensive trading strategy, complemented by other analysis and indicators. Happy trading!
🚀

Volume Oscillators Focus IndicatorVolume Oscillators Focus Indicator
Short name VolumeFocus
This indicator seeks to show episodes of high and low volumes analyzing these by calculating three lines and create colorings on the basis of where these lines go relative to each other.
The first line is a percent based on the current volume level, for which a 3 period sma is taken.
It is calculated by using the lowest volume in the lookback as zero, the highest as 100 percent
This line is called “current volume level”
The second line is a percent, based on the median volume of the last five periods. This line is called “new normal volume”
The third line is a percent, based on the median volume of the lookback period. This is called “old normal volume”
For the second and third line the lowest “new normal volume” in the lookback is used as zero while the 100 percent level is the same as in the calculation of the first line.
The reasoning for the colors is as follows:
When both current en new normal level are below old normal, the volume is to be considered ‘low’. When volume is low, the background color is gray and the fill color between the old normal and current lines is navy.
When both current and new normal level are above old normal, the volume is to be considered ‘significantly expanded’. When this happens the fill color between current and old normal is orange.
When volume is not low it is considered normal or high and the background color is green.
The lookback is set to 50, it advise to keep it that way.
Use of the indicator.
Volume results from focus of the market on the instrument. When the price seems correct, some buy it, some sell it but most don’t care. Then the volume is low, the background is gray. The navy fill color indicates ‘how low’.
When the price seems off, many will care and start trading. Then volume is high, background is green. When the trading is really heating up the orange fill color appears, showing that the market has high focus on this instrument, perhaps move in a trend.
Of course we don’t know in which way the market tries to ‘correct’ the price, for that purpose I use this indicator together with REVE Cohorts which provide useful markers to explain what the excess volume means.
Eykpunter

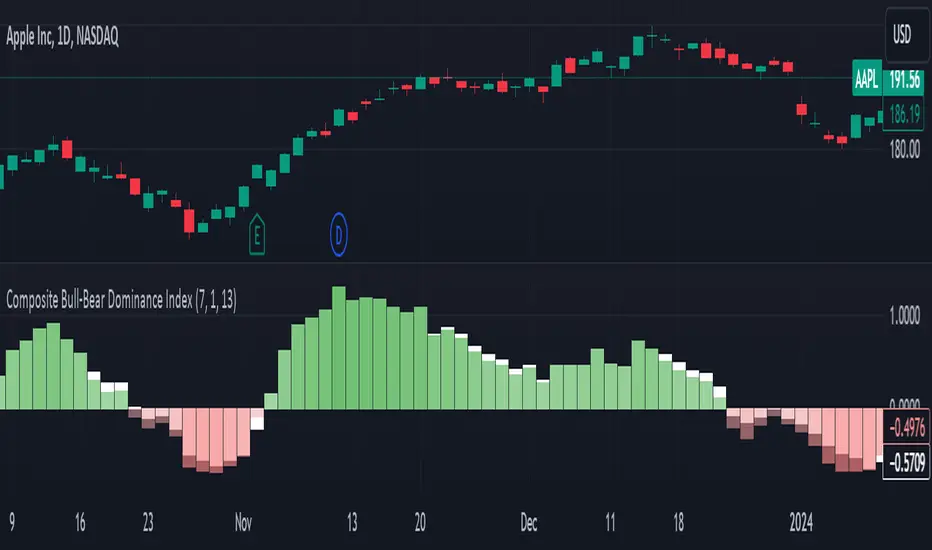
Composite Bull-Bear Dominance IndexNote: CREDITS: This is based on the Up Down Volume Indicator (published in Trading View) and Elder Ray Index (Bull Bear Power).
The Composite Bull Bear Dominance Index (CBBDI) is a indicator that combines up down volume analysis with Bull and Bear Power to provide a comprehensive view of market dynamics. It calculates Z-scores for up down volume delta and bull bear power measures, averages them, and then smoothes the result using Weighted Moving Average (WMA) for Bull and Bear Power and Volume Weighted Moving Average (VWMA) for Up and Down Volume Delta. The advantages include responsiveness to short-term trends, noise reduction through weighting, incorporation of volume information, and the ability to identify significant changes in buying and selling pressure. The indicator aims to offer clear signals for traders seeking insights into overall market dominance and indicate if the bulls or the bears have the upper hand.
Volume Analysis (Up/Down Volume Delta):
Up/Down Volume Delta reflects the net difference between buying and selling volume, providing insights into the prevailing market sentiment.
Positive Delta: Indicates potential bullish dominance due to higher buying volume.
Negative Delta: Suggests potential bearish dominance as selling volume surpasses buying volume.
Price Analysis (Bull and Bear Power):
Bull and Bear Power measure the strength of buying and selling forces based on price movements and the Exponential Moving Average (EMA) of the closing price.
Positive Bull Power: Reflects bullish dominance, indicating potential upward momentum.
Positive Bear Power: Suggests bearish dominance, indicating potential downward momentum.
Composite Bull Bear Dominance Index (CBBDI):
CBBDI combines the standardized Z-scores of Up/Down Volume Delta and Bull Bear Power, providing an average measure of both volume and price-related dominance.
Positive CBBDI: Indicates an overall bullish dominance in both volume and price dynamics.
Negative CBBDI: Suggests an overall bearish dominance in both volume and price dynamics.
Smoothing Techniques:
The use of Weighted Moving Average (WMA) for smoothing Bull and Bear Power Z-scores, and Volume Weighted Moving Average (VWMA) for smoothing Up/Down Volume Delta, reduces noise and provides a clearer trend signal.
Smoothing helps filter out short-term fluctuations and emphasizes more significant trends in both volume and price movements.
Color Coding:
CBBDI values are color-coded based on their direction, visually representing the prevailing market sentiment.
Green Colors: Positive values indicate potential bullish dominance.
Red Colors: Negative values suggest potential bearish dominance.
Median Proximity Percentile [AlgoAlpha]📊🚀 Introducing the "Median Proximity Percentile" by AlgoAlpha, a dynamic and sophisticated trading indicator designed to enhance your market analysis! This tool efficiently tracks median price proximity over a specified lookback period and finds it's percentile between 2 dynamic standard deviation bands, offering valuable insights for traders looking to make informed decisions.
🌟 Key Features:
Color-Coded Visuals: Easily interpret market trends with color-coded plots indicating bullish or bearish signals.
Flexibility: Customize the indicator with your preferred price source and lookback lengths to suit your trading strategy.
Advanced Alert System: Stay ahead with customizable alerts for key trend shifts and market conditions.
🔍 Deep Dive into the Code:
Choose your preferred price data source and define lookback lengths for median and EMA calculations. priceSource = input.source(close, "Source") and lookbackLength = input.int(21, minval = 1, title = "Lookback Length")
Calculate median value, price deviation, and normalized value to analyze market position relative to the median. medianValue = ta.median(priceSource, lookbackLength)
Determine upper and lower boundaries based on standard deviation and EMA. upperBoundary = ta.ema(positiveValues, lookbackLength) + ta.stdev(positiveValues, lookbackLength) * stdDevMultiplier
lowerBoundary = ta.ema(negativeValues, lookbackLength) - ta.stdev(negativeValues, lookbackLength) * stdDevMultiplier
Compute the percentile value to track market position within these boundaries. percentileValue = 100 * (normalizedValue - lowerBoundary)/(upperBoundary - lowerBoundary) - 50
Enhance your analysis with Hull Moving Average (HMA) for smoother trend identification. emaValue = ta.hma(percentileValue, emaLookbackLength)
Visualize trends with color-coded plots and characters for easy interpretation. plotColor = percentileValue > 0 ? colorUp : percentileValue < 0 ? colorDown : na
Set up advanced alerts to stay informed about significant market movements. // Alerts
alertcondition(ta.crossover(emaValue, 0), "Bullish Trend Shift", "Median Proximity Percentile Crossover Zero Line")
alertcondition(ta.crossunder(emaValue, 0), "Bearish Trend Shift", "Median Proximity Percentile Crossunder Zero Line")
alertcondition(ta.crossunder(emaValue,emaValue ) and emaValue > 90, "Bearish Reversal", "Median Proximity Percentile Bearish Reversal")
alertcondition(ta.crossunder(emaValue ,emaValue) and emaValue < -90, "Bullish Reversal", "Median Proximity Percentile Bullish Reversal")
🚨 Remember, the "Median Proximity Percentile " is a tool to aid your analysis. It’s essential to combine it with other analysis techniques and market understanding for best results. Happy trading! 📈📉

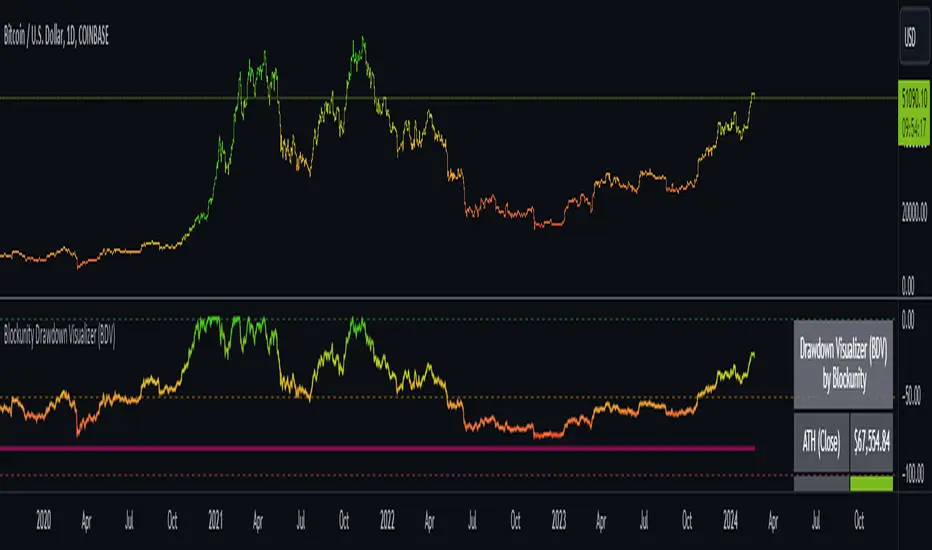
Blockunity Drawdown Visualizer (BDV)Monitor the drawdown (value of the drop between the highest and lowest points) of assets and act accordingly to reduce your risk.
Introducing BDV, the incredibly intuitive metric that visualizes asset drawdowns in the most visually appealing manner. With its color gradient display, BDV allows you to instantly grasp the state of retracement from the asset’s highest price level. But that’s not all – you have the option to display the oscillator’s colorization directly on your chart, enhancing your analysis even further.
The Idea
The goal is to provide the community with the best and most complete tool for visualizing the Drawdown of any asset.
How to Use
Very simple to use, the indicator takes the form of an oscillator, with colors ranging from red to green depending on the Drawdown level. A table summarizes several key data points.
Elements
On the oscillator, you'll find a line with a color gradient showing the asset's Drawdown. The flatter line represents the Max Drawdown (the lowest value reached).
In addition, the table summarizes several data:
The asset's All Time High (ATH).
Current Drawdown.
The Max Drawdown that has been reached.
Settings
First of all, you can activate a "Bar Color" in the settings (You must also uncheck "Borders" and "Wick" in your Chart Settings):
You can display Fibonacci levels on the oscillator. You'll see that levels can be relevant to drawdown. The color of the levels is also configurable.
In the calculation parameters, you can first choose between taking the High of the candles or the Close. By default this is Close, but if you change the parameter to High, the indication next to ATH in the table will change, and you'll see that the values in the table will be affected.
The second calculation parameter (Start Date) lets you modify the effective start date of the ATH, which will affect the drawdown level. Here's an example:
How it Works
First, we calculate the ATH:
var bdv_top = bdv_source
bdv_top := na(bdv_top ) ? bdv_source : math.max(bdv_source, bdv_top )
Then the drawdown is calculated as follows:
bdv = ((bdv_source / bdv_top) * 100) - 100
Then the max drawdown :
bdv_max = bdv
bdv_max := na(bdv_max ) ? bdv : math.min(bdv, bdv_max )
Osmosis [ChartPrime]Osmosis is a multi indicator, multi period heatmap. Lookback periods can be mysterious as it can tend to seem very arbitrary. This tool allows users to see how price/volume reacts to short to long periods by visualizing all of the periods at the same time. This is useful because small periods are only good for short term movements while long periods are useful for long term movements. This more detailed view of market trends is analogues of multi time frame analysis. The lookback periods are arranged from bottom up, where the bottom of the indicator is the shortest period while the top is the longest period.
One major feature of this indicator is its ability to signal potential trend reversals. For example, a shift in the direction at the lower end of the heatmap can indicate a weakening of the current trend, suggesting a possible reversal. On the other hand, when the heatmap is fully saturated at all levels, it may indicate a strong trend that could be nearing a reversal point.
Another important and unique aspect of the Osmosis indicator is its automatic highlighting feature. This feature emphasizes regions within the heatmap that score exceptionally high or low, drawing attention to significant market movements or potential anomalies.
All of the indicators are normalized using min/max scaling driven by the highest highs and lows. The period of this scaling is adjustable by changing the "Lookback" parameter under settings. Delta length changes the lookback for "MA Delta" and "Volume Delta". A longer period corresponds to a smoother output. Fast Mode scales back the range of the indicator, literally halving the increment.
Here is a short description of what each input does:
Alternate Source: A choice to use a different data source for the indicator.
Source: An option to turn on or off the alternate data source.
Style: A selection menu to choose the visual style of the indicator.
Lookback: Adjusts how far back in time the indicator looks for its calculations.
Delta Length: Changes the length of time over which changes are measured.
Fast Mode: A setting that adjusts the range of the indicator for quicker analysis.
Enable Smoothing: A choice to smooth out the data for a cleaner look.
Smooth: Activates the smoothing feature.
Max Region: Highlights the highest value regions in the heatmap.
Max Threshold: Sets the threshold for what counts as a 'max' region.
Minimum Max Width: Determines the smallest size for a 'max' region to be highlighted.
Max Region Color: Chooses the color for the maximum value regions.
Max Top Line Alpha: Adjusts the transparency of the top line in max regions.
Max Bottom Line Alpha: Adjusts the transparency of the bottom line in max regions.
Line Width: Sets the thickness of the lines in the max regions.
Region Start Indication: Specifies where the max region starts.
Fill Max: Decides if the max regions should be filled with color and sets the transparency level for the color fill in max regions.
Minimum Region: Highlights the lowest value regions in the heatmap.
Minimum Threshold: Sets the threshold for what counts as a 'min' region.
Minimum Minimum Width: Determines the smallest size for a 'min' region to be highlighted.
Minimum Region Color: Chooses the color for the minimum value regions.
Minimum Top Line Alpha: Adjusts the transparency of the top line in min regions.
Minimum Bottom Line Alpha: Adjusts the transparency of the bottom line in min regions.
Minimum Line Width: Sets the thickness of the lines in the min regions.
Minimum Region Start Indication: Specifies where the min region starts.
Fill Minimum: Decides if the min regions should be filled with color and sets the transparency level for the color fill in min regions.
Color Presets: Provides pre-set color schemes.
Invert Color Scale: Flips the color scale.
Gradient Colors: Customizes individual colors for the gradient scale.
Available styles include:
'MACD Histogram'
'Normalized MACD'
'Slow MACD'
'MACD Percent Rank'
'MA Delta' (Delta Length set to 2)
'BB Width'
'BB Width Percentile'
'Stochastic'
'RSI'
'True Range OSC'
'Normalized Volume'
'Volume Delta'
'True Range'
'Rate of Change' (Smoothing set to 1)
'OBV' (Smoothing set to 1)
'MFI' (Smoothing set to 1)
'Trend Angle' (Smoothing set to 2 and fast mode off)

Fibonacci Averages Trend OscillatorOverview:
The Fibonacci Averages Trend Oscillator is a unique technical indicator that leverages Fibonacci numbers to analyze market trends. It calculates the average trend sentiment over periods determined by Fibonacci numbers and smooths the result to create an oscillator.
Key Features:
Uses Fibonacci sequences for trend analysis.
Smooths the trend data to create a clear oscillator.
Offers adjustable oversold and overbought levels for customized analysis.
Inputs:
Max Fib Number: Select the highest Fibonacci number for trend calculation.
Smooth: Adjust the smoothness of the oscillator line.
Using the Oscillator:
A rising oscillator indicates a bullish trend, while a falling oscillator suggests bearish sentiment.
Oversold and overbought levels help identify potential reversal points.
Use the oscillator in conjunction with other indicators for comprehensive market analysis.
Tips for Effective Use:
Adjusting Fibonacci Levels: Experiment with different 'Max Fib Number' settings to find the one that best matches your trading style and the asset's characteristics. Higher Fibonacci numbers consider longer periods, which might be more suitable for long-term trend analysis.
Smoothing Level: The 'Smooth' input helps in reducing noise. A higher smooth level results in a less responsive but smoother line, which can be useful for identifying the overall trend direction.
Interpreting Overbought/Oversold: Watch for the oscillator reaching overbought or oversold levels. These points could signal potential trend reversals or consolidation phases.
Combination with Other Tools: For best results, combine the Fibonacci Averages Trend Oscillator with other technical tools like moving averages, RSI, or MACD to validate the signals and develop a robust trading strategy.
Conclusion:
The Fibonacci Averages Trend Oscillator offers a unique approach to trend analysis by incorporating Fibonacci numbers into its calculation. Its adjustable settings allow for customization to fit various trading styles and market conditions, making it a versatile tool for traders seeking to enhance their technical analysis capabilities.
