Key Levels// How it Works \\
Calculating Previous Days, Weeks and Monthly open, high, low, close and vwaps
Plots these levels on your chart
// Settings \\
You can enable/disable any of the levels you want to see
You can also change the amount of bars back the levels are plotted back to
// Use Case \\
These levels are often used in different methods of Technical analysis for support and resistance.
// Suggestions \\
Happy for anyone to make any suggestions on changes which could improve the script,
// Terms \\
Feel free to use the script, If you do use the script could you please just tag me as I am interested to see how people are using it. Good Luck!
月圖表

Day/Week/Month/3M/6M/12M MTF breaks by makuchakuThis indicator plots breaks for multiple timeframes. Works on Daily to Yearly timeframes.
Currently supported timeframes :
Daily
Weekly
Monthly
Quarterly
Half Yearly
Yearly
It currently plots all breaks together. From Indicator settings hide what you don't need and save as default settings.

Key Levels (Time Frames - Weekly,Monthly,Quarterly,Yearly)This indicator plots the 4h, Daily, Weekly, Monthly, Quarterly, Yearly Open High, Low and Mids.
You can watch how these institutional trading levels work as support and resistance.
Most Important you can add alerts to these levels with a few clicks.
Just add/remove unnecessary levels for scaling problems.
For any error/suggestion/improvement just let me know.

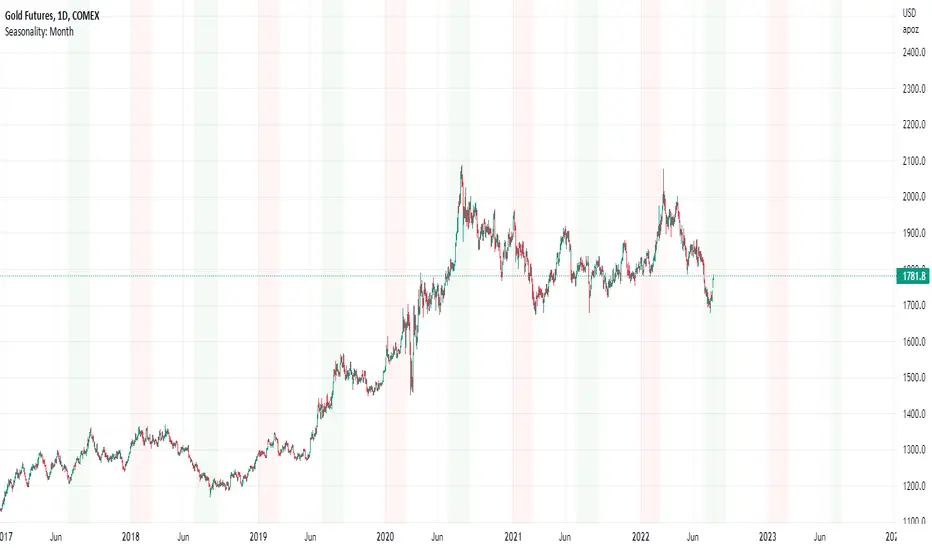
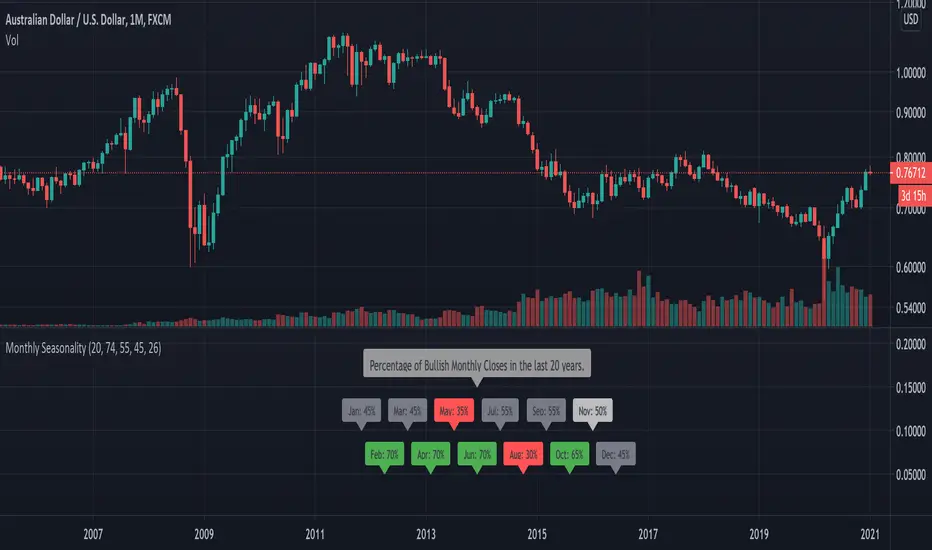
Seasonality: Month HighlightMany Assets, especially Commodities , have patterns of seasonality: Periods in the year when they have shown a greater tendency to rise or a greater tendency to fall.
The Seasonality of an asset is based on historical data (20yrs+): Specific asset seasonality charts can be found via an online search.
This is a simple tool that allows users to highlight and color code each of the 12 months of the year; depending on the seasonality of the specific asset.
The above chart shows Sugar Futures ; which are a seasonal 'sell' in February , and a seasonal 'buy' in May and August.
Seasonality should only be used to compliment a trading setup, NOT as a single reason in itself to buy or sell. Simply put: if you find a good setup, AND you have seasonality on your side; your odds of success are increased.
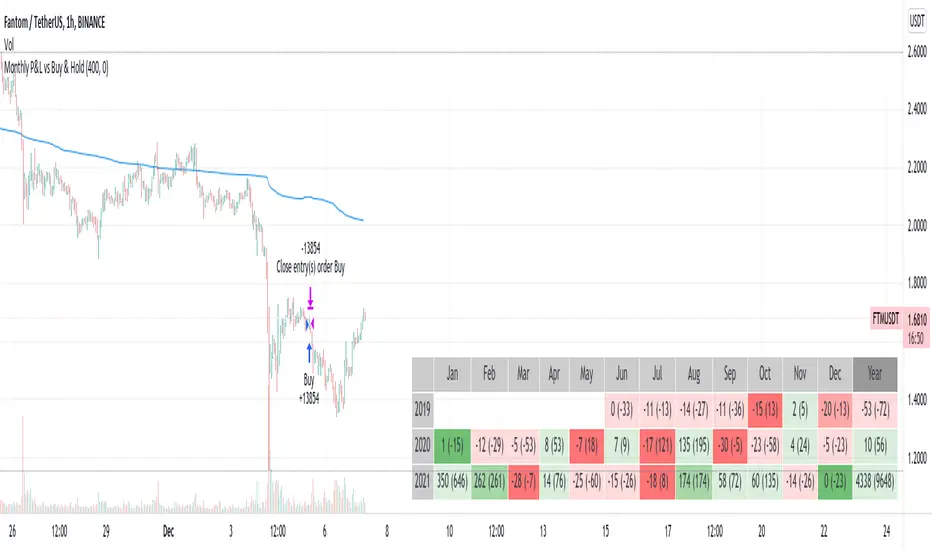
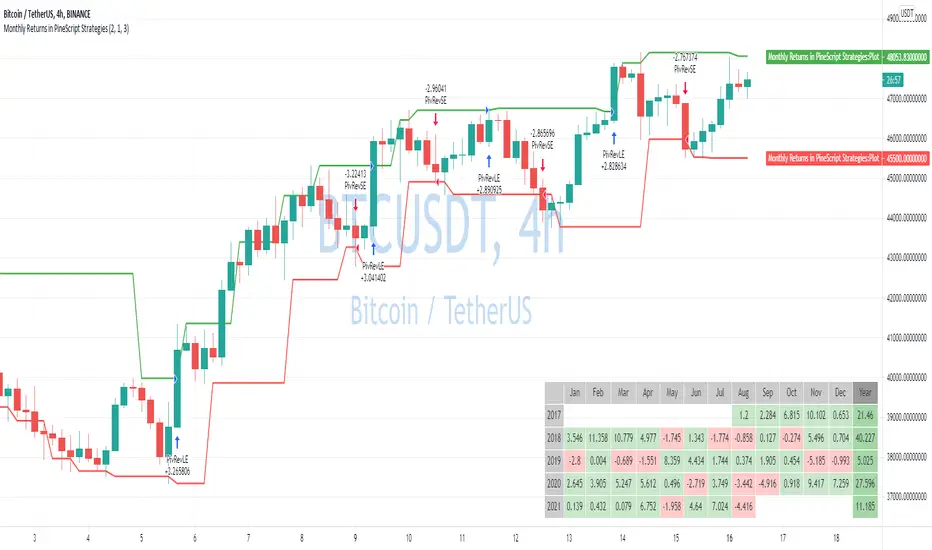
Monthly Returns with BenchmarkI keep working on trying to make TradingView strategies look fancier.
A few months ago I published the first version of the Monthly Returns for Strategies in Pine Script. I received quite a lot of good feedback and quite a lot of requests to update it.
This is a more advanced version of the Monthly Returns, in it, you can:
Display monthly returns of your strategy, benchmark, and alpha over this benchmark.
Select benchmark to be another instrument
Select the date from which you want to compute monthly returns
Show/hide benchmark and alpha
Choose colors for gradient for gain/loss values
Use it with any type of strategy
Use it with replay
I hope it will be useful for you.
It's not about the strategy itself but the way you display returns on your chart. So pls don't critique my choice of the strategy and its performance 🙂
Disclaimer
Please remember that past performance may not be indicative of future results.
Due to various factors, including changing market conditions, the strategy may no longer perform as well as in historical backtesting.
This post and the script don’t provide any financial advice.
Simple/Compounded Returns & Drawdowns TableVery excited to bring this script to the public. This is a very useful table that displays the performance of any strategy you give it in a more detailed view. It runs on all timeframes and at any position on the chart with the replay function. It also updates on tick changes. The table consists of three modes: Simple Equity, Compound Equity and Drawdown.
Simple Equity – shows the change in equity for every month and year. It is calculated by finding the difference in initial equity at the beginning of the month/year and the end of the month/year. The table will thus display strategy performance in blocks of time that are not correlated. It is an excellent way to see individual month/year performance from start to finish but it may not represent true change in equity over time. For example, let's assume that 100% of equity is used on every trade for simplicity. If a loss of 50% is made in the first month and a profit of 100% is made in the next month, the strategy will show 50% profit for the year. This aggregate value might be helpful to know for testing purposes, but in reality, the account is actually at break-even for the year (Initial Equity * 0.5 * 2 = Initial Equity).
Compound Equity – shows compounded change in equity for every month and year. It is calculated by finding the difference in starting equity when the strategy is run and equity at the end of the month/year. The table will thus display the true strategy performance – compounded equity at the end of each month/year.
Drawdown – shows max drawdown for every month and year. It is calculated by finding the difference between the highest equity achieved for the month/year and the trough in equity for the same month/year. Notice: strategy tester might have a max drawdown value higher than any of the drawdown values in the table. This is because the strategy tester calculates the difference between the highest and lowest equity for the entire strategy, whereas the table displays drawdowns for months and years only. Sometimes, the max drawdown for the year will also be the max drawdown for the entire strategy; hence the two values will be the same.
To use this table with your own strategy, simply find " PLACE YOUR STRATEGY CODE HERE " at the bottom of the script and place your strategy code there. Special thanks to QuantNomad for the inspiration. As always, please let me know if there are any bugs or if you need some help. Leave a like if you wish!

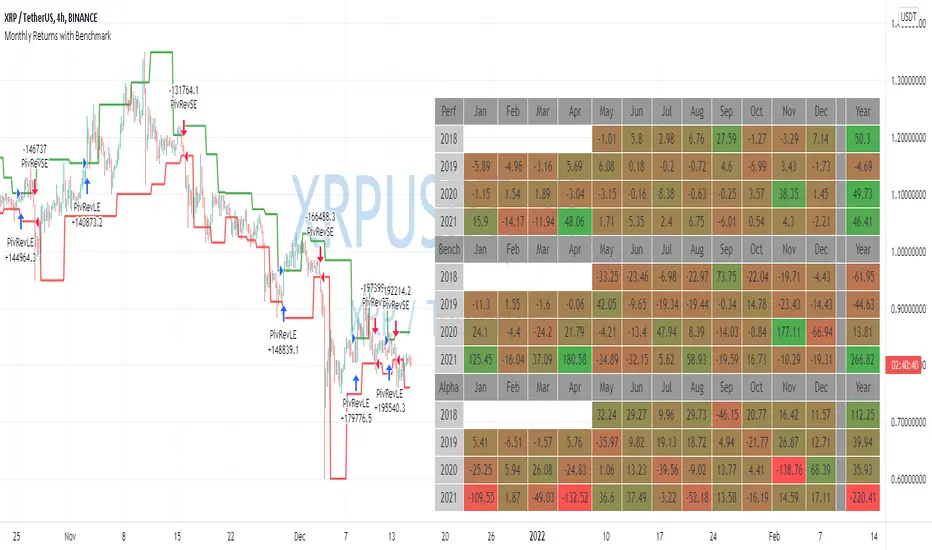
Monthly Returns in Strategies with Market BenchmarkThis is a modified version of this excellent script Monthly Returns in PineScript Strategues by QuantNomad
I liked and used the script but wanted to see how strategy performed vs market on each month/year. So I am sharing back.
The modification consists in adding Market or Buy & Hold performance between parenthesis inside each cell to better see how strategy performed vs market.
Also, 3 red levels and 3 green levels have been used :
For green :
1/ Light when strategy pnl > 0 but < market
2/ medium when strategy pnl > 0 and > market
3/ Dark when strategy pnl > 0 and market < 0 or pnl > market x 2
Same logic in the opposite direction for red.
The strategy provided here is just a showcase of how to use the table in pine script.
Disclaimer
Please remember that past performance may not be indicative of future results.
Due to various factors, including changing market conditions, the strategy may no longer perform as well as in historical backtesting.
This post and the script don’t provide any financial advice.
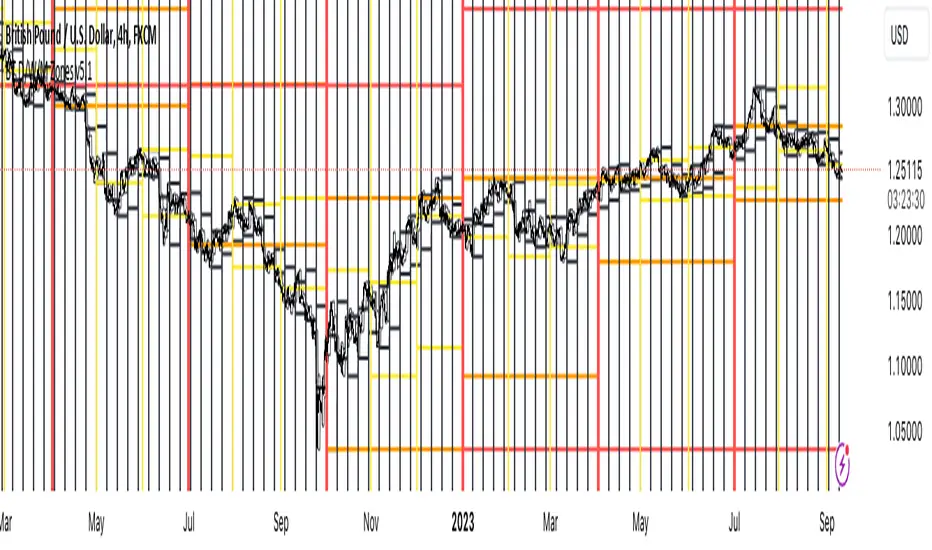
High Low Open Mid Ranges & Levels (Multi-Timeframe)This indicator automatically plots the chosen timeframe's high, low, mid point and open. These levels on higher timeframes act as support and resistance levels on lower timeframes, helping find entries, stoploss and profit targets.
Most common timeframes to choose are Daily, 1W, 1M, and 3M. Other timeframes that are good include, 2D, 2W and 2M.
For example, you can see in the snapshot below, we are on the 4hr TF showing those levels from the 2W. This historical 2W zone (open and mid) was (and currently still is) resistance. You can see it also provided a good entry to go short.
This is also useful for intraday scalping. Below, we are on the 15min TF with levels set on the 2D timeframe. You can see how the Open and Mid levels acted as resistance, providing good entries on range trades, with take profit set at the previous 2D low.
There is also a table which tells you all the main TFs high, low, open, and mid levels. They are the most important ones to look out for.
This indicator should not be used in isolation; it is best to pair it up with other TA such as orderblocks, S/D zones, S&R or overlay indicators.

Price Range TableThe table shows the ranking of the price as a percentage relative to the past candles.
100 ~ highest price of the time frame
0 ~ lowest price of the time frame

Monthly Returns in PineScript StrategiesI'm not 100% satisfied with the strategy performance output I receive from TradingView. Quite often I want to see something that is not available by default. I usually export raw trades/metrics from TradingView and then do additional analysis manually.
But with tables, you can build additional metrics and tools for your strategies quite easily.
This script will just show a table with monthly/yearly performance of your script. Quite a lot of traders/investors used to look at returns like that. Also, it might help you to identify periods of time when your strategy performed good/bad than expected and try to analyze that better.
The script is very simple and I believe you can easily apply it to your own strategies.
Disclaimer
Please remember that past performance may not be indicative of future results.
Due to various factors, including changing market conditions, the strategy may no longer perform as well as in historical backtesting.
This post and the script don’t provide any financial advice.
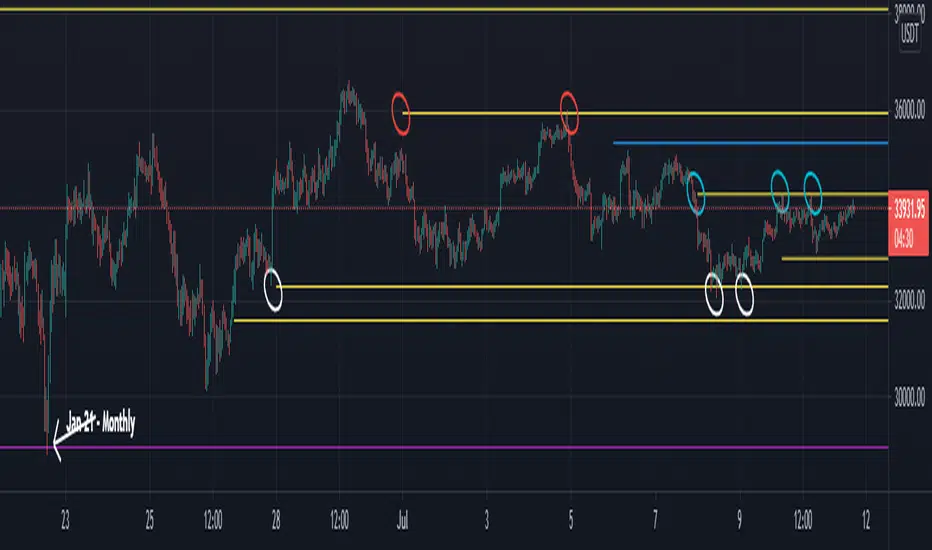
MTF Key Levels - Support and ResistanceThis indicator shows how to Multi Time Frame (MTF) interpret levels:
Watch how price acts around these levels and how they can act as support/resistance and can be used as great confluence levels for your technical analysis.
This indicator displays:
VWAP Levels
Daily / Weekly / Monthly / Yearly
Within the chart above I have marked out how displaying these VWAP levels can provide support and resistance levels to be aware of.
Daily – Weekly - Monthly – Yearly Levels
O = Open / H = High / L = Low
pO = Previous Open / pH = Previous High / pL = Previous Low / pEQ = Previous Equlibrium
Having previous Low/High levels makes you aware of Swing Failure Patterns (SFP). Also the daily/weekly/monthly opening and previous opening can assist with the trend.
Daily Open: Gives you an idea who is in control for the day. This level very often acts as strong support or resistance.
Weekly Open: Indicates where the price is within the higher timeframe.
Monthly Open & Yearly Levels: Overview of direction for the whole month without looking at a monthly chart and Yearly chart
Line Options
Within the line options you can choose to have a clean chart and display a “short line”. These line length can be adjusted by the user.
Line just to the right.
Line across the screen.
Disclaimer: The Monthly and Yealy VWAP will only show on higher timeframes this is due to restriction of how many candles can be shown on the chart. The candles displayed need to go back to either the start of the month of year to be able to calculate their VWAPs.

Higher Time Frame levelsSimple script to see where the hloc levels are on the last confirmed candle on a higher timeframe. Good for keeping a eye on the monthly or weekly levels . NOTE if you are using the script on monthly setting and are currently on a lower timeframe (15min ) and do not see the lines rendering you just need to move your chart to the left to get the start point of the line to appear on screen, then tradingview will render the lines.

Naked - Daily Weekly MonthlyUser request for Naked Daily Weekly Monthly Opens.
This indicator plots the Daily Weekly Opens (the day after day after creation), they then will stay on the chart until a candle close is completed on the other side of the plot.
In the above chart picture you can see how previous monthly and daily opens have acted as support and resistance.
Thanks go to:
StackOverFlow Bjorn Mistiaen
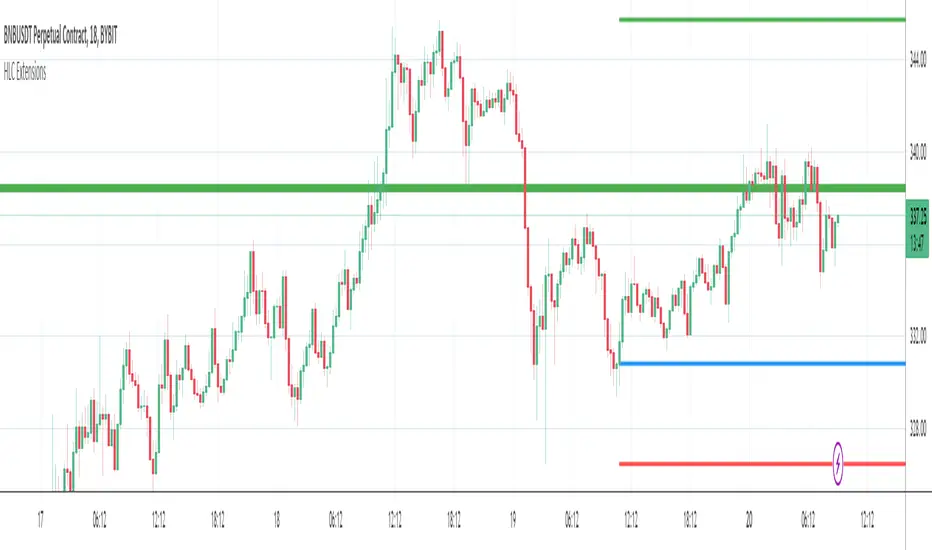
Yesterdays & Last Weeks High Low Close ExtensionsPlots the Extensions of Yesterdays and Last Weeks High Low Close
Unfortunately all of the levels wont always show therefore it is good use this in conjunction with my Levels script
I tried to combine the 2 scripts but doing so gave me memory overload errors in Tradingview thats why I have made them separate
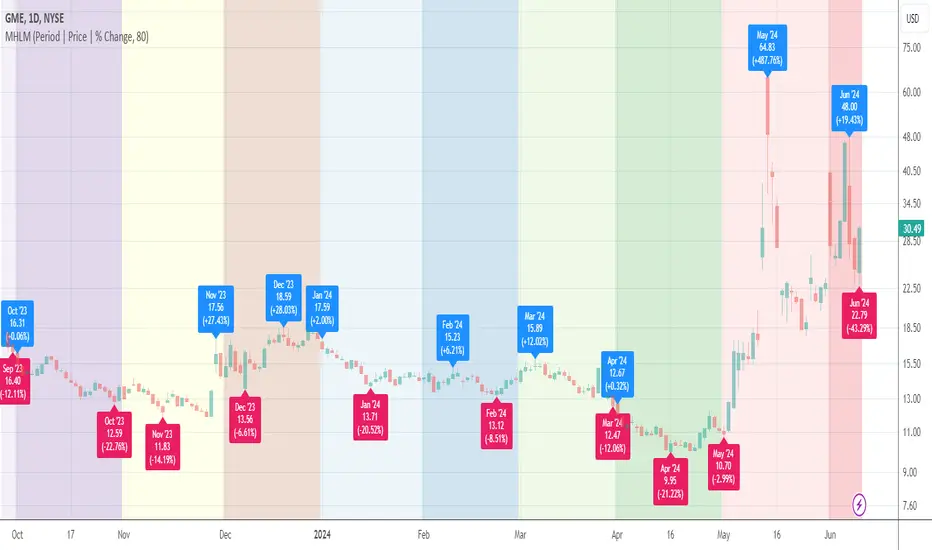
Combo Month-to-Month % ReturnA combined version of two already published indicators:
Combo Month-to-Month % Return (January - June)
Combo Month-to-Month % Return (July - December)
Allows to compare an asset's monthly returns over years.
Includes:
Customizable columns
Up to 20 columns per each chart
Customizable Min, Max, Mean, Median and Standard Deviation lines
Customizable labels

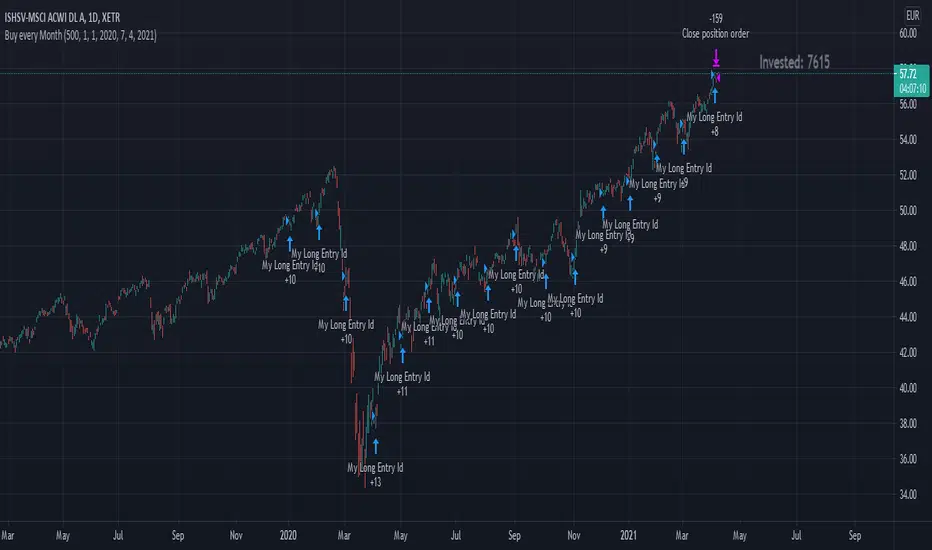
Buy every MonthThis strategy script simulates, if you invest every new month.
Features:
You can set a Date Range
You can set your Sparrate/how much you want to invest every month
In the Right Corner you can see, how much you invested so far
In the End of the Date Range, all positions get closed and you can see your performance.
Note: Please ignore the "Ordersize" Option from the Propeties Tab and use the "Ordersize / Sparrate" option from the Inputs Tab.
With best regards Embit0one.
Diese Strategie simuliert einen Sparplan der jeden Monat eine Summe x investiert.
Features:
Das Start und End Datum für den Sparplan ist frei wählbar
Die Sparrate pro Monat ist einstellbar
In der rechten oberen Ecke sieht man, wieviel bisher investiert wurde
Am End-Datum werden alle Positionen geschlossen und man kann sich das Ergebnis ansehen. Um zu sehen wieviel Prozent man gemacht hat, sollte man die investierte Summe im Feld "Initial Capital" eingeben und im Performance Tab der Strategy nachschauen.
Notiz: Bitte die Sparrate im Inputs Tab eingeben, der Wert im Propeties Tab wird nicht verwendet.
Mit freundlichen Grüßen Embit0one.
Monthly SeasonalitySimple indicator designed as filter so you can easily see how the currency or asset performed during each month historically.
Can used to identify a possible month to enter or exit a trade in. For best results use in combination with another indicator or candle pattern to signal an entry in a historically bullish month
*This indicator is designed to be used only on the monthly chart.
Heiken Ashi MTF Strategy- IndicatorHello, this is both a strategy and indicator that revolves around Heikin Ashi candles.
In this case we take 3 different time frames, in this example we use daily , weekly and monthly.
The conditions for entry are :
For long : we check that we have a green daily candle, at the same time we check that the weekly and monthly candles are also green.
For short : We check that all candles, daily, weekly and monthly and red.
For exit of long : as soon as 1 of the 3 candles, daily or weekly or monthly converts to red, we exit.
For exit of short : as soon as 1 of the 3 candles converts to green, we exit.
This strategy- indicator can be adapted to any type of market.

Key Levels TheHuntThis indicator is made to show you some key levels on the chart on the different timeframes. You can hide them or show them in the settings. The levels are the Monthly Weekly and Daily opens, current monthly, weekly and daily high / low, last weeks high / low & last daily high / low as well as Monday high and low. These levels can be used as key pivots or key liquidity areas. You can also adjust the time to also use the correct Mon range for forex pairs.
As you can see on the chart, that is how the levels show up on the chart.

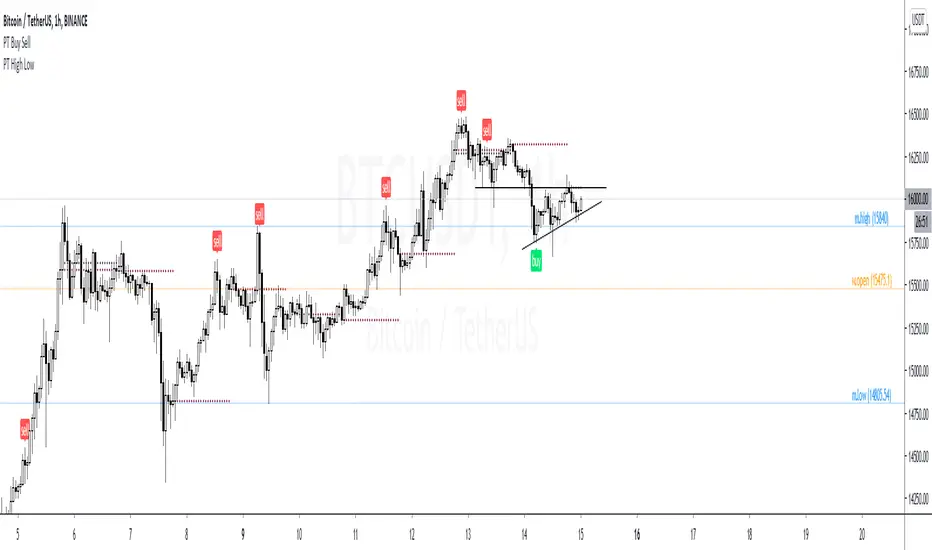
PT High Low Version 1.0 of our PT High Low indicator helps create a visual for the Daily, Weekly, Monthly & Yearly range. These levels will give you an idea of where the price can react if reached. Consider them pivotal areas. We included a toggle that will help you go between the candle's High/Low to the candle's Open/Close. Both features are unique when scalping & swinging. The High/Low will paint a beautiful visual for your day to day trading & the Open/Close will help you determine where price maxed opened & closed for that specified timeframe.
Strategy:
Price tends to gravitate between the Daily level when playing intraday scalps. If playing the weekly, you want to be above the weekly pivot to punt longs & under the weekly level to punt shorts. More likely than not, when the price hits a monthly or yearly level, we get a noticeable reaction off it.
This Oscillator was built around our buy sell indicator & it is used on all time frames for swinging & scalping. It is included as part of the library. Just message us for access!
Static + Dynamic LevelsShows static and dynamic levels which can act as support/resistance. These are important as there is a lot of users who are interested in buying/selling at these prices.
Static Levels include -
Daily/Weekly/Monthly/Yearly Open (changes color depending on if below or above price)
Previous Daily/Weekly/Monthly/Yearly Open
Previous day's High/Low
Dynamic Levels include -
100/200 Daily MA
100/200 Weekly MA

BT D/W/M SeparatorsThis will print vertical lines for Daily/Weekly/Monthly open and close times. Also highlighting the days of the week including weekends for the crypto lovers :-)
Monthly High/Low MarksThis utility tool marks the highest and the lowest price of each month on the chart. Works everywhere and doesn't use any calls of built-in functions which are used for a data extraction.
Labels provide additional information about closing price and % change for a particular month and allow micro customizations.