Example - HTF Values Without 'Security()'This is an example of how to reference higher timeframe data without the
need for a 'security()' call.
I have attempted to create the function example:
f_insecurity()
with the purpose of wrapping up and pumping out all common relevent HTF
price data that's needed for your everyday indicators in a reliable fashion.
Resolution

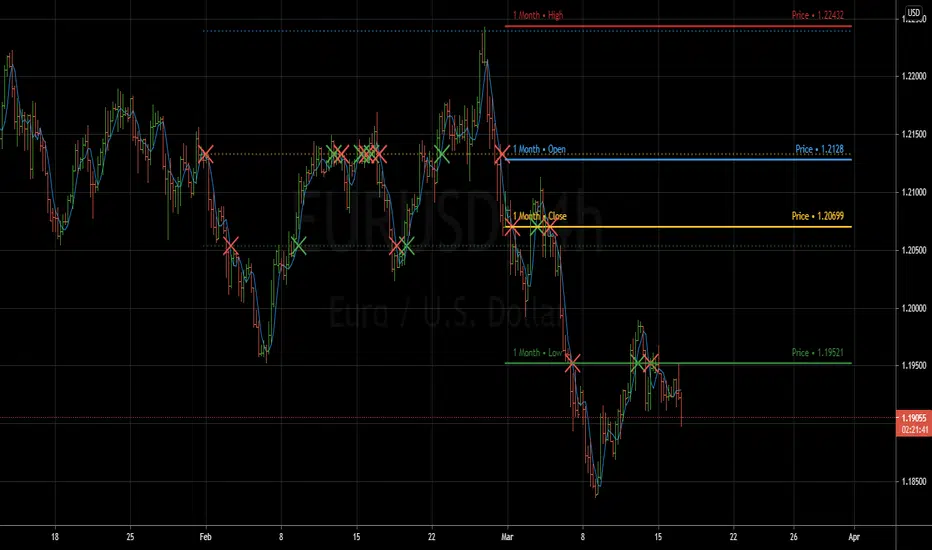
Previous Period Levels - X Alerts====== ABOUT THIS INDICATOR
- A simple but highly customisable display of previous higher time-frame
OHLC values, drawn using line.new and label.new. Nothing fancy but...
- Customised resolution input which excludes time frames lower than 1 hour
while extending the common higher reference inputs to include:
• 6, and 12 Hour
• 5 Day
• 3, and 6 Month
• 1 Year
- Alert conditions using an adjustable SMA to help reduce false positive
spam.
- Full visual customisation options for (almost) every aspect, so it can be
tuned to suit most individual preferences.
- In line with the miriad visual customisation options is the ability to
change the display format of the Labels, to show more or less information,
or disable them altogether.
====== REASON FOR STUDY
- To practice advanced user input option handling to allow for a full visual
customisation experience without stepping outside of, or interfering with,
the intended function of the indicator.
- Provide reasonably clear code commenting and structure in order to be
useful as a potential learning aid for others, and future reference for
myself.
====== DISCLAIMER
Any trade decisions you make are entirely your own responsibility.
I've made an effort to squash all the bugs, but you never know!
Free Multiple Timeframe Chart Candle Resolution by Emiliano MesaFree Multiple Timeframe Chart Resolution by Emiliano Mesa
This indicator allows free users to have a multiple timeframe candlestick graph without the need of upgrading to PRO, PRO+, or Premium accounts. Furthermore you can even apply indicators to the chart, and has a much more historic data than similar indicators with the same purpose I have previously seen in the platform, which is a huge plus.
How to use?
1) Install the indicator
2) The background color, must be the same color as your actual TradingView chart background. For example, as mine is the white theme, then ill choose the white background.
3) Set a small timeframe for your real TradingView chart, this must always be less than the timeframe set in the indicator
4) Set a bigger timeframe in the indicator, this is done in the "Timeframe Wanted"
5) Expand the indicator window as much as you want
For the best results, try to make the wanted resolution 3 times bigger than the real chart resolution. For instance if using 3 minute real resolution I suggest a 9 minute multiple time frame wanted resolution for the indicator. If you are using 5 minutes, ill suggest a 15 minute, and so on
Add an indicator over the indicator?
1) When clicking in the indicator name, you will see 3 dots. Click them
2) Select "Add indicator on indicator/Strategy"
3) Select the indicator you whish to add
4) Select if the indicator will work with close,open,high, or low. More options will come in future updates.
Enjoy!
Indicator by Emiliano Mesa

Moving Average 4 & 8 daily, on all timeframesThis script takes 2 of the most popular moving averages ( 4 & 8 SMA ) in one indicator and will allow you the set the resolution to any time frame you want. If you are day trading, but want to keep an eye on the daily 4 SMA and 8 SMA on your 5 min chart; this script will do the trick. You can also change the period for both MA's.

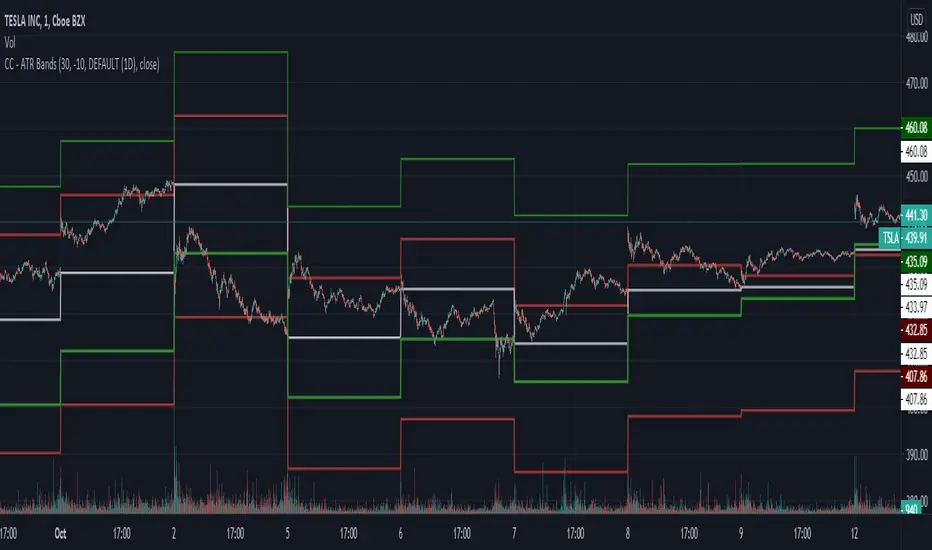
CC - ATR BandsPlots ATR bands around candles at any HTF resolution you desire, taken in through the inputs. The white line represents the open of the HTF, the red and green the expected boundaries. You can use the risk tolerance slider up/down to adjust how risky you want to be with the ATR bands.
I am not responsible for outcomes using this method, indicator or anything else. Please do your own due diligence.
CC - Array-meta Consolidated Interval Display (ACID)This script extends my other two Array examples (which I've also provided to you open source):
The Ticker-centric 5m,15m,45m,1h,4h,1d resolution labels using arrays:
And the more Macro VIX,GLD,TLT,QQQ,SPY,IWM 1d resolution labels using arrays:
This script aims to show how to use min/max/avg with Arrays easily. My next example after this will be exploring the usage of variance versus covariance ratios over different periodic interval resolutions. Currently, this is using the following intervals: 5m,15m,45m,1h,4h,1d. It takes these intervals, calculates the values at those resolutions and puts the absolute min and max from the 5 minute to the 1 day resolutions.
It's more of an example of the power that arrays can hold, as all this truly is right now is a min/max bound calculator. The real gem lies in the avg calculators for multiple resoltuions tied into a single label with readable data. Check out the code and let me know what you think. If you need more examples, the other two scripts I mentioned before are also open source.
Using this on intervals of less than 1D sometimes times out, the way I wrote it is memory intensive, may not work for non-pro users.
Thanks!
NONE OF THIS IS FOREWARD LOOKING STATEMENTS, THIS IS NOT A PREDECTIVE ANALYSIS TOOL. THIS IS A RESEARCH ATTEMPT AT A NOVEL INDICATOR. I am not responsible for outcomes using it.
Please use and give criticisms freely. I am experimenting with combining resolutions and comparing covariance values at different levels right now, so let me know your thoughts! The last indicator will likely not be open source, but may be depending on how complex I get.

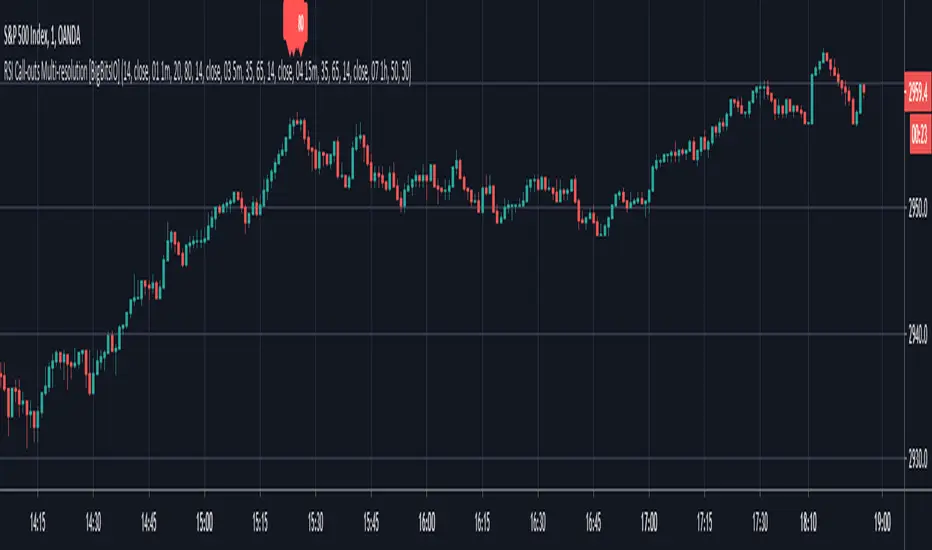
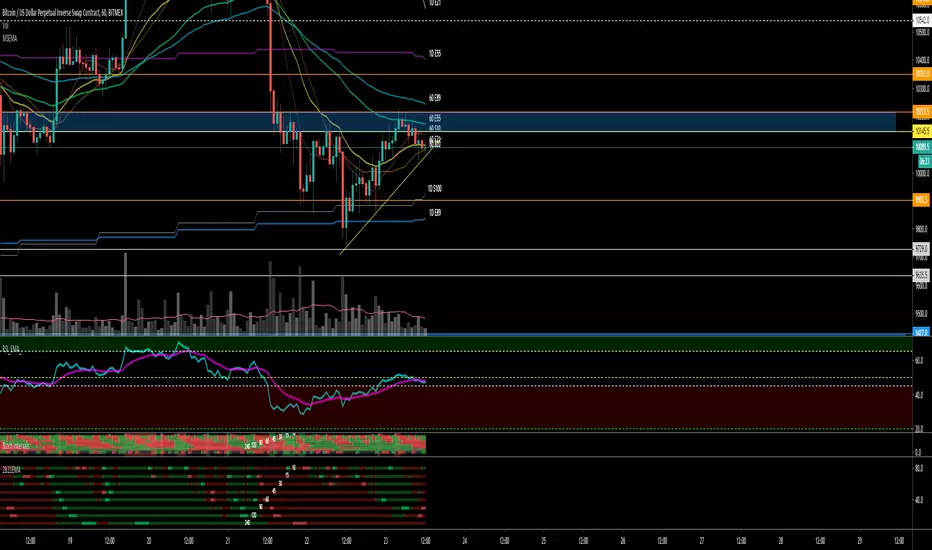
RSI Call-outs Multi-resolution [BigBitsIO]This is a simple multi-resolution (multi-timeframe) RSI indicator that overlays the current chart to show labels for specified oversold and overbought areas defined with inputs.
Up to 4 different resolutions/timeframes for their respective RSI (1,2,3, or 4). RSI1 is always enabled and can not be disabled.
Red labels with white text represent overbought RSI levels as defined by the user. All enabled RSI will have to qualify as overbought based on settings.
Green labels with black test represent oversold RSI levels as defined by the user. All enabled RSI will have to qualify as oversold based on settings.
This RSI overlay help easily call-out overbought and oversold candles on a chart where other RSI values on larger resolutions/timeframes are also oversold/overbought without sacrificing screen space for a traditional RSI indicator that is not overlayed on the chart.
This indicator has alert conditions that will trigger when all enabled RSI indicators are either oversold or overbought respective to your settings.
Note: The best results are to operate your chart as your smallest RSI resolution selected. Personally, I prefer to have my smallest (shortest timeframe) in RSI1, and go larger farther out to RSI4.
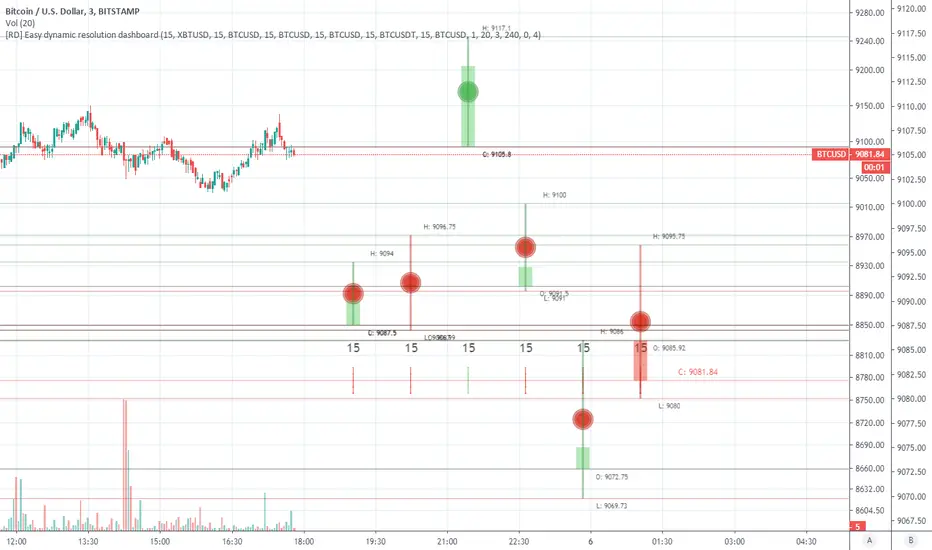
[RD] Easy dynamic resolution dashboard=== Easy dynamic resolution dashboard (initial) ===
Easy dashboard to show different running reolution bars most of the scale is adjustable.
Current state is initial and could have some bugs, or been in a cleaner way of coding. Let me know if you find something so we could fix it
Best way to start is in a seperate pane to adjust the you like best or most. Afterwards can copied to chart if needed
The round circle in the middle is the avg low|high price of that specifick candle in the resolution
Loading and input adjustments could take a while (reload)
You should get a warning if the current timeframe is higher then the input resolutions choosen. Adjust the reolutions according and you should be fine
Special thanks go to and borrowed some code from
- @PineCoders
- @RicardoSantos
Notes / Updates
- Let me know where it need (bug) fixes or adjustments
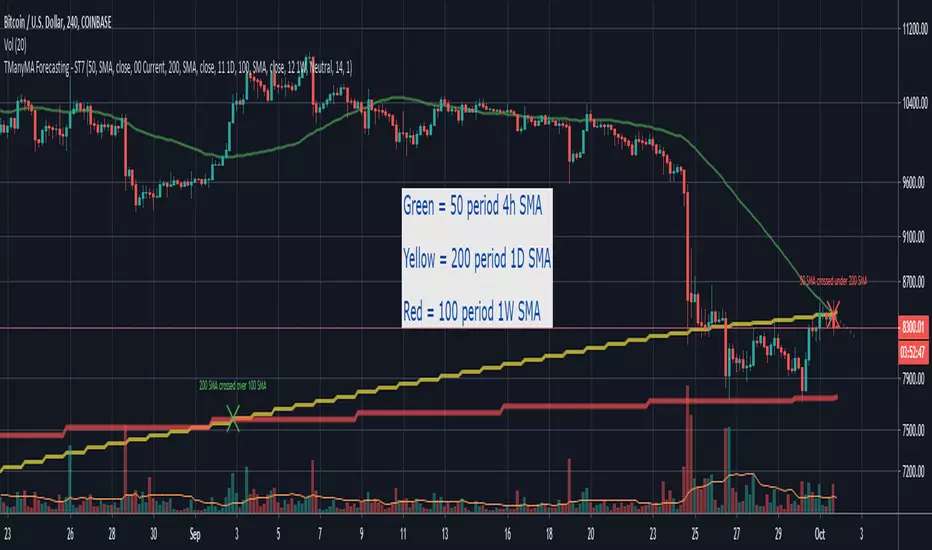
Scripting Tutorial 8 - Triple Many Moving Averages RibbonsThis script is for a triple moving average indicator where the user can select from different types of moving averages, price sources, lookback periods and resolutions.
Features:
- 3 Moving Averages with variable MA types, periods, price sources, resolutions and the ability to disable each individually
- Crossovers are plotted on the chart with detailed information regarding the crossover (Ex: 50 SMA crossed over 200 SMA )
- Forecasting available for all three MAs. MA values are forecasted 5 values out and plotted as if a continuation to the MA.
- Forecast bias also applies to all forecasting. Bias means we can forecast based on an anticipated bullish, bearish or neutral direction in the market.
- To understand bias, please read the source code, or if you can't read the code just send me a message on here or Twitter. Twitter should be linked to my profile.
- Ribbons added and on by default. Optional setting to disable the ribbons. 5 ribbons between MA1 and MA2 and another 5 between MA2 and MA3.
- Ribbons are alpha-color coded based on their relation to their default MAs.
- Ribbons are only visible between MAs if the MAs being compared share the same Type, Resolution, and Source because there is no way to consolidate those three in a simple manner.
- Ribbon values are calculated based on calculated MA Periods between the MAs.
This script is meant as an educational script with well-formatted styling, and references for specific functions.

Scripting Tutorial 7 - Triple Many Moving Averages ResolutionsThis script is for a triple moving average indicator where the user can select from different types of moving averages, price sources, lookback periods and resolutions.
Features:
- 3 Moving Averages with variable MA types, periods, price sources, resolutions and the ability to disable each individually
- Crossovers are plotted on the chart with detailed information regarding the crossover (Ex: 50 SMA crossed over 200 SMA )
- Forecasting available for all three MAs. MA values are forecasted 5 values out and plotted as if a continuation to the MA.
- Forecast bias also applies to all forecasting. Bias means we can forecast based on an anticipated bullish, bearish or neutral direction in the market.
- To understand bias, please read the source code, or if you can't read the code just send me a message on here or Twitter. Twitter should be linked to my profile.
This script is meant as an educational script with well-formatted styling, and references for specific functions.
Smoothed RSIThis smoothed RSI indicator is designed to allow users to try and identify periods of extended time in oversold and overbought areas using a smoothed RSI value.
Features:
- RSI
- Period
- Source
- Resolution
- Visibility
- Smoothed RSI
- Period
- Moving Average Type
- Visibility

Multi EMA/SMA with different resolutions and labelsUp to 6 EMA and 4 SMA that each let you select the time period you want to view them on. Useful for keeping an eye on larger timeframes while watching smaller timeframes and vice versa. Hope you all enjoy!
If you enjoy it so much and are overwhelmed with joy, donations are welcome as I've just recently accomplished the going-broke phase of learning how to trade :)
BTC -- 1G4nKVgK8uJGspXyjYtsQNqiUcnXFTTQ9B
Eth -- 0x11904637C133eFb4BfF95dC8b62cF5c876E170bC
LTC -- Ld3coYyARp3NmLKWd2o9AoTMtirc949hbC
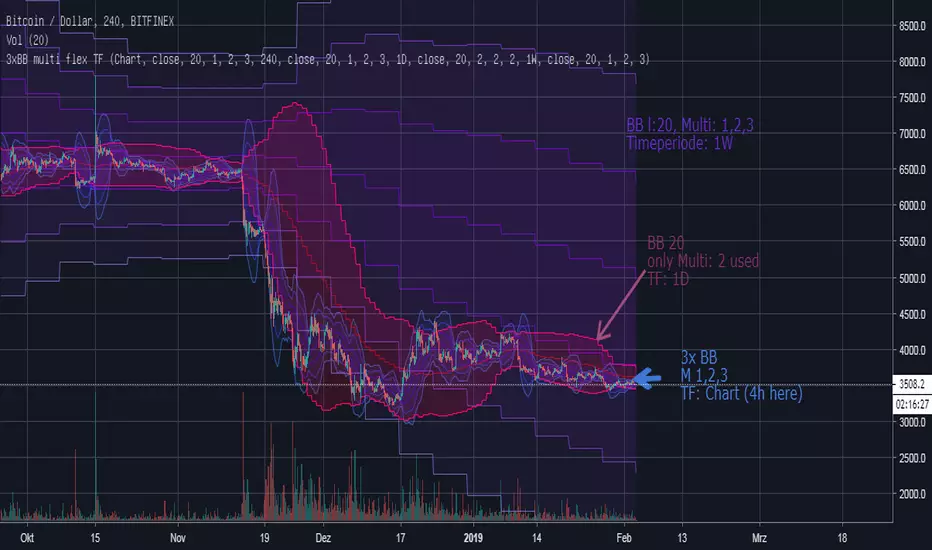
3xBB multi flex TF4 independent 3x Bollinger Bands
each of them hast the following parameterset (user inputs):
- Show/enable true/false: to de-/activate the 3xBB
- 3 diff Multiplier (set some of them to same values or disable some in style-menu to get a better overview)
- Length
- Source
- Timeframe/Resolution: "5","15","30","60", "240","360","720", "1D", "1W", "1M", "Chart"
To use the native chart time resolution select "Chart" as TimeFrame
Without any guarantee / warranty!
Please report bugs in comment section.
Multiple customizable MA own timeresolution own MA-typeMultiple (8) customizable MA
Features:
Set MA-Type/Smoothing: "RMA", "SMA", "EMA", "WMA", "VWMA"
Set Timeframe/Resolution: "60", "240", "1D", "1W", "1M", "Chart"
To use the native chart time resolution select "Chart" as TimeFrame

15minMAThis script lets you plot a simple or exponential moving average from a specific time frame that you can select. For example, if you always want the Daily 50MA on your chart, regardless of what resolution your chart is on, this will do it. It's also color coded to show if it's rising or falling.

Multiple Moving Averages [clean]Very simple indicator script to display multiple simple moving averages. I know others have made this but they often are too feature-rich and can get cluttered.
Can optionally show a cross when MA 1 crosses MA 3. These are colors such that when MA 1 crosses BELOW MA 3 a red cross is shown, and green when crossing above.

Heffae Resolution Commander (RAW)This is a script to call resolutions with some math on top of your base resolution.
Using the modulo operator to quantize integer values, it works by converting the modified resolution integer to a 4 digit string value.
Use the function within your own scripts to call funny resolutions otherwise difficult to calculate.
You cannot add series expressions to the resolution value since pine does not allow "series" as a resolution for a security call
However, you could easily stack a crapload of these together and use an expression to switch the referenced security function for your purposes.
This is the raw timeframe output as integer, not string.
To go back to string outputs (for use in security calls etc) unslash line 52 //resvalue
For those interested in the verbose version of the timeframe mod function, showing all the steps, here is a pastebin:
pastebin.com
Cheers! Drop a line / comment if you enjoy or have any questions on how to integrate this into your script@!
The Modulo operator is so much fun!
Heffae Resolution CommanderThis is a script to call resolutions with some math on top of your base resolution.
THIS IS NOT AN INDICATOR TO USE ON A CHART!!! The resolution call function is really useful for your own scripting ideas!
Using the modulo operator to quantize integer values, it works by converting the modified resolution integer to a 4 digit string value.
The function within this script is what is valuable, use it within your own scripts to call funny resolutions otherwise difficult to calculate.
You cannot add series expressions to the resolution value since pine does not allow "series " as a resolution for a security call
However, you could easily stack a crapload of these together and use
an expression to switch the referenced security function for your purposes.
The SMA and plot overlay are just there to show a visual example of how the function works.
You can view the raw timeframe output integer by getting rid of tostring(x) and // out the security calls,
plotting the raw function outputs.
For those interested in the verbose version of the timeframe mod function, showing all the steps, here is a pastebin:
pastebin.com
Cheers! Drop a line / comment if you enjoy or have any questions on how to integrate this into your script@!
The Modulo operator is so much fun!
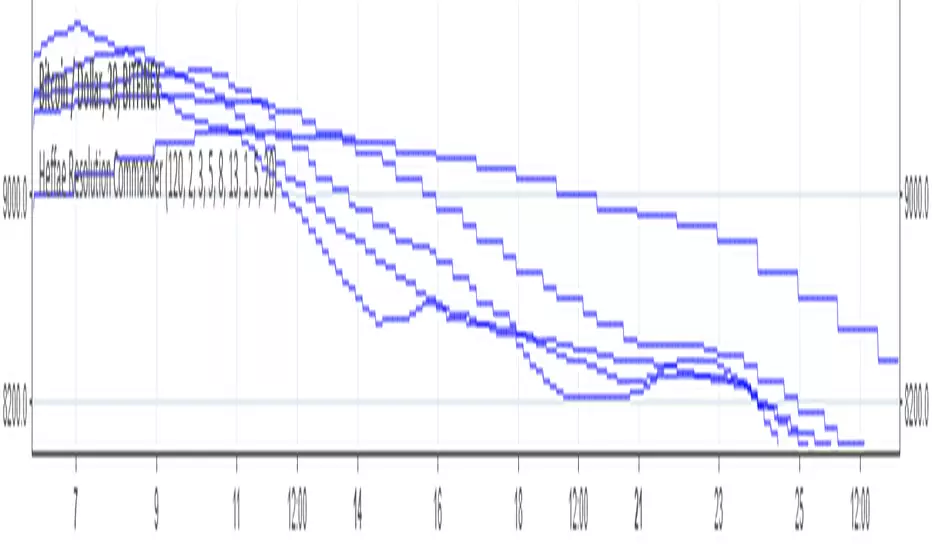
Deep CandleAccess two chart resolutions and/or securities with crystal clarity. Have your one minute candles built right into your one hour candles, or whatever other combinations you'd like. Use "Fade Mode" to accentuate low res candles when zoomed out and mute them when zoomed in. Choose any security/exchange and any resolution.
If you'd like to plug this concept into another indicator, I'm at your service.
~jdhadwin
Two resolutions, same exchange, one chart:
Two resolutions, Coinbase 1m & Bitfinex 30m, one chart:
Fade Mode Off
Fade Mode On
1 Minute Chart with 1 Day Candles applied
15 Minute Chart with 1 Day Candles applied (zoomed out)
15 Minute Chart with 1 Day Candles applied (zoomed in) with Fade Mode Off
15 Minute Chart with 1 Day Candles applied (zoomed in) with Fade Mode On

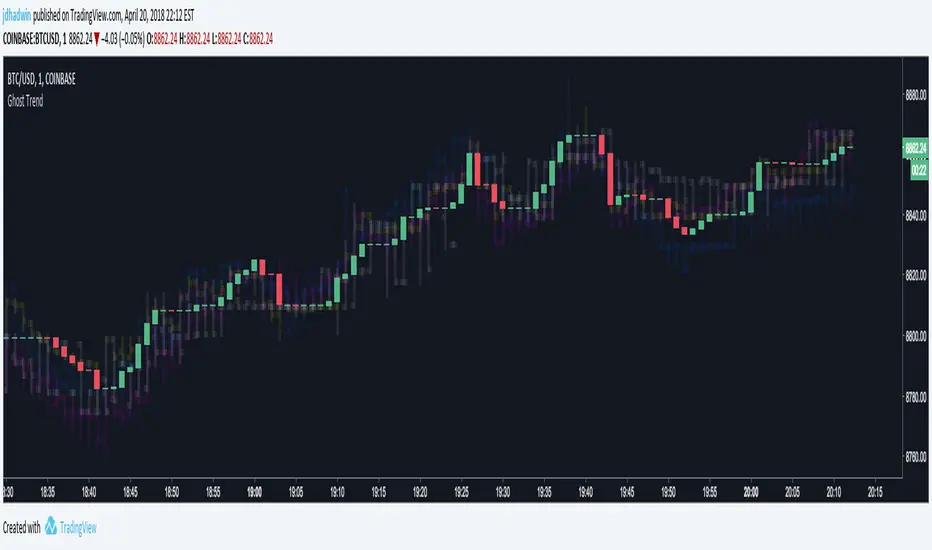
Ghost TrendUse ghosted charts from multiple exchanges to visualize global market trends for your trading pair BEFORE the trend comes to your exchange. Use Ghost Averaging to find what Bitcoin is ACTUALLY doing across up to four exchanges, by averaging all four exchanges into a single ghost. As for the name, Ghost Trend just sounded way cooler than Arbitrage Helper!
Hone your skills and you may even find yourself able to avoid crashes moments BEFORE they happen, or able buy right BEFORE a take-off. Ghosts sometimes show moves earlier than the exchange you're using. But be careful, sometimes ghosts are nasty little deceivers 8o
Instructions:
First time ghosting? Start out with a 1 minute Bitcoin chart on Coinbase ( ), then check out the Ghost Trend settings.
Start small, pick just one alternate exchange (say Bitfinex ) and play with the Ghosted Open/High/Low/Close settings. Certain combinations will display bars by default, others will display plotted lines. Make it work for you.
Next, pick a second exchange and you'll see a second ghost. Now comes the fun part. Click "Average Ghosted Pairs". Now you're looking at the two averaged together. You can even average Coinbase back into the Ghosted Average if you want. Add up to four, and most importantly, have fun.
DON'T FORGET TO SET THE CORRECT CHART RESOLUTION!!! Everything goes haywire if you mismatch Ghost Trend's resolution with your current chart.
Lots of fun to be had on the 1 minute chart, but it's especially useful to use Ghost Averaging with Open and Close unchecked and High and Low checked, when on greater resolution charts. ;) Happy arbitraging!
If you'd like to incorporate Ghost Trend into your script, you know where to find me.
~jdhadwin
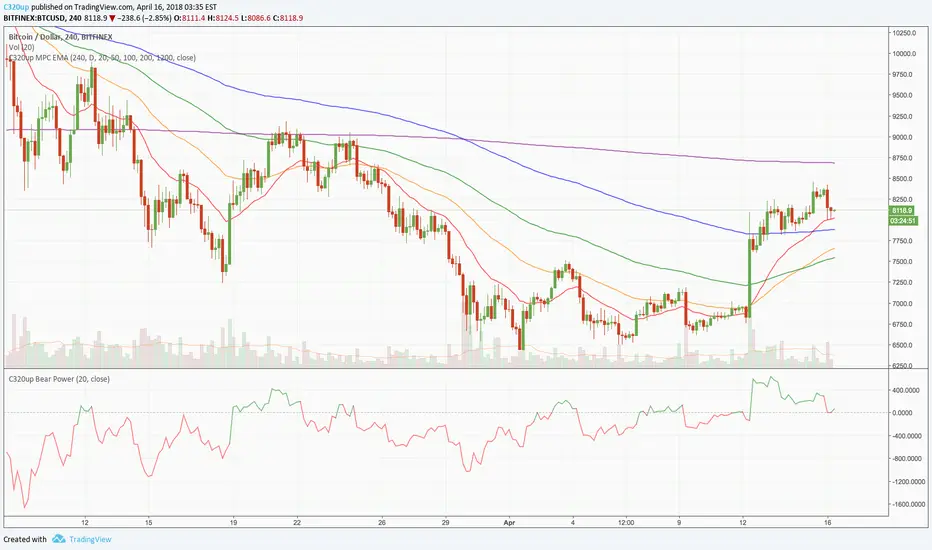
C320up MPC EMA 5 by Chart ResolutionC320up "MPC" EMA 5 by Chart Resolution
- This is a custom version of our C320up EMA by Chart Resolution.
This version has 5 EMA’s and is easier to quickly switch chart resolutions, this time using only 2 chart periods.
Why have filtered chart resolutions?
Some EMA’s don’t tend to give a useful indication at a given chart resolution, so any resolution not selected will not have the EMA lines appear on the screen.
Default resolutions are “240” Minutes (4 Hour), and “D” (1 Day).
With these settings the EMA lines will only appear on the 4 Hour and Daily charts.
Default EMA’s are 20, 50, 100, 200, and 1200.
Why 1200 you may ask. 1200 on the 4 Hour chart is equivalent to 200 on the Daily chart.
You can change these inputs to suit your requirements.
The first input is used to manually type in the chart resolution, as the TV built in drop downs don’t have all of the chart resolutions, 240 Minutes (4 Hour) for example.
If you don’t want them all to show on the screen, you can un-check them in the Style tab in settings.
Check out our scripts page for more indicators. (Including our Bear Power Indicator)
Any questions, just leave a comment.
If you want more control over the chart resolutions, try using this one:
"C320up EMA by Chart Resolution"
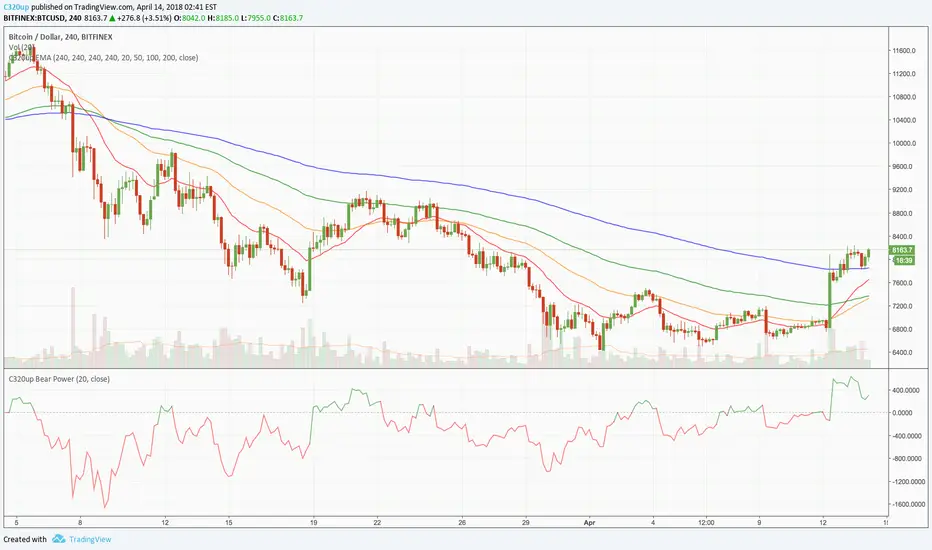
C320up EMA by Chart ResolutionC320up EMA by Chart Resolution
- You may only want your EMA’s to appear on specific chart resolutions.
Use this indicator to select up to four resolutions and four EMA’s.
Sometimes a certain EMA (Exponential Moving Average) doesn’t give a good indication on a smaller time frame or vice versa, so you can customise these to suit.
Default settings are “240” Minutes for all EMA’s to appear.
Default EMA’s are 20, 50, 100, and 200.
To change the resolution, type in one of these examples:
15 = 15 Minutes, 60 = 1 Hour, 240 = 4 Hours, D = Day, W = Week, M = Month, 2M = 2 Months, etc.
You could have just the one EMA appear on multiple time frames, or have 2 appear on 2 time frames, etc.
Check out our scripts page for more indicators.
Any questions, just leave a comment.
Dynamic Support/Resistance Zones Multi-ResSimple support and resistance areas. The threshold parameter determines the sensibility. It works better if volume data is good.
Remember to refresh the script once in awhile when applied to lower resolutions.
//std1243cf0
