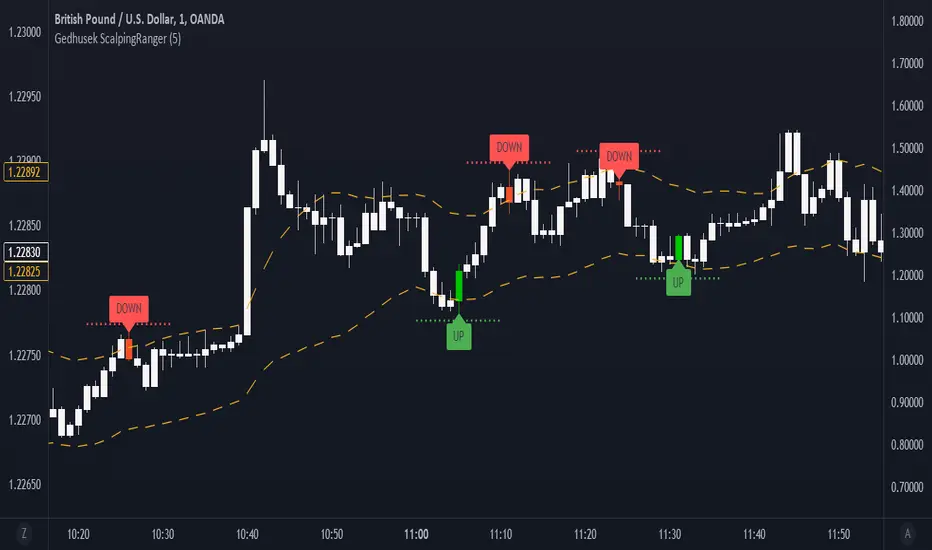
Gedhusek ScalpingRangerThis indicator was designed for finding good entries for scalping the market
How does it work:
- It works on a basis of price running out of its bands and its return
- Once the price is out of bands, the system starts scanning for two patterns --> sudden price reversion and losing of momentum.
- If any of these patterns occur, the indicator waits for a confirmation bar and after that it gives you a signal that the price could be moving upwards or downwards.
- These signals are represented by a label and sudden price change of the current bar
- Also you will see a dotted line above or below the bar that can be used as a potential Stop Loss level
Idea behind the trigger patterns:
Sudden price reversion
- Idea behind this pattern is that the price has a higher success of reversion if there is a fast change of its momentum. This pattern is recognized by measuring the divergence between prior and current price change
- The divergence is measured as correlation between shorter-term price action and longer-term price action. If the correlation is negative and statistically significant, it is counted as a reversion signal (= shorter-time price action goes in the opposite direction of longer-term price action)
Losing of momentum
- The idea behind this pattern is that once there is no strong momentum, there is lower probability of a breakout and start of strong trend
- It is calculated as a difference between current price and previous price. If the difference is minimal, it is taken as a signal that the price lost its momentum and therefore there is higher chance of reversion.
When to use:
- This indicator works well in ranging markets, but slightly less well in trending markets. Therefore look for sideways markets and use the indicator there
- Price action patterns work really well with this indicator, such as Support and Resistance levels, double Tops and Bottoms,...
Inputs:
- This indicator has only one input and that is "Analysis Period". This input declares how many bars and going to be used when finding the patterns of possible price reversion
Reversion
Gedhusek MasterReversionThe MasterReversion Indicator works as a scanner for possible price reversals.
How does it work?:
The main feature of this indicator is finding extreme price deviations from its mean. This is reached by calculating the average price deviation from its mean and then comparing it with the current price deviation. This deviation is expressed as a percentage in relation to the historically highest price deviation --> if the maximum deviation is 200 points and the current deviation is 180 points, than the percentage displayed is going to be 90%.
With knowing how extreme the current deviation is, we can do some good decision making about whether the market is ready to reverse to its mean or not.
The next feature of this indicator is classic SuperTrend indicator. This tool is mainly used for identifying shifts in the market trend and in this case it becomes very useful when catching the actual price reversion.
The key idea:
The main idea behind this tool is that the price can be away from moving average, but cant stay that way forever. Therefore its convenient to know when the reversion part might happen
How to use:
Generally, you would want to wait until the current price reaches certain percentage (you can see a label on the latest bar displaying current percentage deviation). After that happens, wait for a sign of pullback. For that you can use the built-in SuperTrend indicator or any other strategy that you like. Your potential Take Profit should be somewhere around the main moving average (it has a white colour) as you are speculating on mean reversion.
[
Settings:
MA Period = Period of a moving average. Price deviations will be relative to this moving average, so as the value is larger, you will catch more significant price deviations and vice versa
Percentage Trigger = Specifies what percentage do you consider as significant.
ATR Period = Settings for a SuperTrend. Specifies a period of an ATR indicator. I like to use values 22 or 34. As the value is higher, the indicator will be generally less sensitive
ATR Multiplier = Also specifies a sensitivity of SuperTrend. As the value is higher, the SuperTrend is going to be less sensitive and vice versa
I would personally encourage you to experiment with the indicator first, so you can decide which inputs are the best ones for your style of trading.
Which markets and Time Frame:
This indicator works best on Forex and can be used on any TF.
It is possible to use it also on other instruments, but the settings has to be adjusted more.

Daily/Weekly ExtremesBACKGROUND
This indicator calculates the daily and weekly +-1 standard deviation of the S&P 500 based on 2 methodologies:
1. VIX - Using the market's expectation of forward volatility, one can calculate the daily expectation by dividing the VIX by the square root of 252 (the number of trading days in a year) - also know as the "rule of 16." Similarly, dividing by the square root of 50 will give you the weekly expected range based on the VIX.
2. ATR - We also provide expected weekly and daily ranges based on 5 day/week ATR.
HOW TO USE
- This indicator only has 1 option in the settings: choosing the ATR (default) or the VIX to plot the +-1 standard deviation range.
- This indicator WILL ONLY display these ranges if you are looking at the SPX or ES futures. The ranges will not be displayed if you are looking at any other symbols
- The boundaries displayed on the chart should not be used on their own as bounce/reject levels. They are simply to provide a frame of reference as to where price is trading with respect to the market's implied expectations. It can be used as an indicator to look for signs of reversals on the tape.
- Daily and Weekly extremes are plotted on all time frames (even on lower time frames).

Mean Reverse Grid Algorithm - The Quant ScienceMean Reverse Grid Algorithm - The Quant Science™ is a dynamic grid algorithm that follows the trend and run a mean reverting strategy on average percentage yield variation.
DESCRIPTION
Trades on different price levels of the grid, following the trend. The grid consists of 10 levels, 5 higher and 5 lower. The grids together create a channel, this channel represents the total percentage change where the algorithm works. The channel also represents the average change yields of the asset, identified during analysis with the "Yield Trend Indicator".
The algorithm can be set long or short.
1. Long algorithm: opens long positions with 20% of the capital every time the price crossunder a lower grid, for a maximum total of 5 simultaneous trades. Trades are closed each time the price crossover a higher grid.
2. Short algorithm: opens short positions with 20% of the capital every time the price crossover a higher grid, for a maximum total of 5 simultaneous trades. Trades are closed each time the price crossunder a lower grid.
USER INTERFACE SETTING
The user configures the percentage value of each grid from the user interface.
AUTO TRADING COMPLIANT
With the user interface, the trader can easily set up this algorithm for automatic trading. Automating it is very simple, activate the alert functions and enter the links generated by your broker.
BACKTESTING INCLUDED
With the user interface, the trader can adjust the backtesting period of the strategy before putting it live. You can analyze large periods such as years or months or focus on short-term periods.
NO LIMIT TIMEFRAME
This algorithm can be used on all timeframes and is ideal for lower timeframes.
GENERAL FEATURES
Multi-strategy: the algorithm can apply either the long strategy or the short strategy.
Built-in alerts: the algorithm contains alerts that can be customized from the user interface.
Integrated grid: the grid indicator is included.
Backtesting included: automatic backtesting of the strategy is generated based on the values set.
Auto-trading compliant: functions for auto trading are included.
ABOUT BACKTESTING
Backtesting refers to the period 1 August 2022 - today, ticker: ETH/USDT, timeframe 1H.
Initial capital: $1000.00
Commission per trade: 0.03%

[Sidders]Std. Deviation from Mean/MA (Z-score)This indicator visualizes in a straight forward way the distance price is away from the mean in absolute standard deviations (Z-score) over a certain lookback period (can be configured). Additionally I've included a moving average of the distance, the MA type can be configured in the settings.
Personally using this indicator for some of my algo mean reversion strategies. Price reaching the extreme treshold (can be configured in settings, standard is 3) could be seen as a point where price will revert to the mean.
I've included alerts for when price crosses into extreme areas, as well as alerts for when crosses back into 'normal' territory again. Both are also plotted on the indicator through background coloring/shapes.
Since I've learned so much from other developers I've decided to open source the code. Let me know if you have any ideas on how to improve, I'll see if I can implement them.
Enjoy!

[BUBBLENUKE] BOB The Reversal Trader=============================================================: BOB The Reversal Trader :=============================================================
COMPONENTS:
- VWAP Anchored at Friday CME close
- Bitcoin CME close
- Volume bars
SETTINGS:
- Asset: BTCUSDTPERP
- Time frame: 30M
- Hard TP %: 1.5
- Hard SL %: 40
- Trading Session Start (UTC): 4
- Trading Session End (UTC): 17
DESCRIPTION:
BOB is a mean-reversion trading system focused in BTCUSDT asset in the 30M time frame. The system is divided into 2 types of entries:
WEEKENDS:
BOB will trigger his entry when the price of Bitcoin is at one of the two deviations from the VWAP anchored at Friday CME close and BOB will take your profits when the price returns to the VWAP. When BOB hits Sunday and the CME reopens, BOB will close all your open positions.
INTRA-WEEK:
BOB will trigger its entry when the price of Bitcoin is at one of the two deviations from the VWAP anchored at the Friday CME close or when a volume candle indicates a reversal. BOB will take your profits when the price returns to the VWAP or when the HARD TP % is reached (1.5% by default). When BOB hits Friday and the CME closes, BOB will close all your open positions.

Multiple Indicator 50EMA Cross AlertsHere’s a screener including Symbol, Price, TSI, and 50 ema cross in a table output.
The 50 Exponential Moving Average is a trend indicator
You can find bullish momentum when the 50 ema crossed over or a bearish momentum when the 50 ema crossed under we are looking to take advantage by trading the reversion of these trends.
True strength index (TSI) is a trend momentum indicator
Readings are bullish when the True Strength Index shows positive values
Readings are bearish when the indicator displays negative values.
When a value is above 20, we look for selling overbought opportunity and when the value is under 20, we look for buying oversold opportunity.
You can select the pair of your choice in the settings.
Make sure to create an alert and choose any alerts then an alert will trigger when a price cross under or cross over the 50 ema for every pair separately.
This allow the user to verify if there is a trade set up or not.
Disclaimer
This post and the script don’t provide any financial advice.

Trend Day IndentificationVolatility is cyclical, after a large move up or down the market typically "ranges" during the next session. Directional order flow that enters the market during this subsequent session tends not to persist, this non-persistency of transactions leads to a non-trend day which is when I trade intraday reversionary strategies.
This script finds trend days in BTC with the purpose of:
1) counting trend day frequency
2) predicting range contraction for the next 1-2 days so I can run intraday reversion strategies
Trend down is defined as daily bar opening within X% of high and closing within X% of low
Trend up is defined as daily bar opening within X% of low and closing within X% of high
default parameters are:
1) open range extreme = 15% (open is within 15% of high or low)
2) close range extreme = 15% (close is within 15% of high or low)
There is also an atr filter that checks that the trend day has a larger range than the previous 4 bars this is to make sure we find true range expansion vs recent ranges.
Notes:
If a trend day occurs after a prolonged sideways contraction it can signal a breakout - this is less common but is an exception to the rule. These types of occurrences can lead to the persistency of order flow and result in extended directional daily runs.
If a trend day occurs close to 20 days high or low (stopping just short OR pushing slightly through) then wait an additional day before trading intraday reversion strategies.

Deviation BandsThis indicator plots the 1, 2 and 3 standard deviations from the mean as bands of color (hot and cold). Useful in identifying likely points of mean reversion.
Default mean is WMA 200 but can be SMA, EMA, VWMA, and VAWMA.
Calculating the standard deviation is done by first cleaning the data of outliers (configurable).

ETF 3-Day Reversion StrategyIntroduction: This strategy is a modification of the “3-day Mean Reversion Strategy” from the book "High Probability ETF Trading" by Larry Connors and Cesar Alvarez. In the book, the authors discuss a high-probability ETF mean reversion strategy for a 1-day time-frame with these simple rules:
The price must be above the 200 day SMA and below the 5 day SMA.
The low of today must be lower than the low of yesterday (must be true for 3 consecutive days)
The high of today must be lower than the high of yesterday (must be true for 3 consecutive days)
If the 3 rules above are true, then buy on the close of the current day.
Exit when the closing price crosses above the 5 day SMA.
In practice and in backtesting, I’ve found that the strategy consistently works better when using an EMA for the trend-line instead of an SMA. So, this script uses an EMA for the trend-line. I’ve also made the length of the exit EMA adjustable.
How it works:
The Strategy will buy when the buy conditions above are true. The strategy will sell when the closing price crosses over the Exit Moving Average
Plots:
Green line = Exit Moving Average (Default 5 Day EMA)
Blue line = 5 Day EMA (Used as Entry Criteria)
Disclaimer: Open-source scripts I publish in the community are largely meant to spark ideas that can be used as building blocks for part of a more robust trade management strategy. If you would like to implement a version of any script, I would recommend making significant additions/modifications to the strategy & risk management functions. If you don’t know how to program in Pine, then hire a Pine-coder. We can help!

EMA MTF PlusI like trading the 1 minute and 3 minutes time-frames. I'm what is commonly called a "scalper". Long term investments yes, I have some, but for trading, I don't have neither the time,
nor the patience to wait hours or days for my trade to be complete.
This doesn't mean I discount the higher time-frames, no, I actually rely heavily on them. I found that EMAs do a decent job as support/resistance, sometimes to a tick level of precision. And this is important for a 1 minute trader.
As such, I made this script that tracks the higher time-frames EMAs and displays the last value as a line.
I do not need the whole EMA, I'm not interested in crossovers or crossunders, these are anyway late signals for me.
What's with the triangles? These are local tops/bottoms , candles that have a have decent size of the wick. These tops and bottoms are by no means "final", they are merely a rejection at certain levels of price. Due to markets complexities (and human erratic behaviors hehe) these levels could be breached at the very next candle. For a more "final" version (nothing is really final but..) I added Schaff Trend Cycle as filter, so a triangle will pop only when a trend is mature enough ( STC with a value near 0 or near 100).
Colored bars. When the body of the candle is big, it shows strength. Strong bars tend to have follow through, especially when breaking key levels. The script looks at the body of the candle and compares it with ATR (Average True Range), if it's at least 0.8 of ATR it changes the bar color to yellow (bull candles) or fuchsia(bear candles).
Range identifier. This code is copied from Lazy Bear (if there are any issues please let me know), it's very useful in conjunction with colored bars.
I look for breakout candles that go outside of the range as a signal for a trade.
There are many ways in which this script can be useful, like trading mean reversions or momentum trades (breakouts) or simply trend following trades.
I hope you guys find it useful, you can play with default values and change them as you like, these are what I found to be working best for me and my trading universe (mostly crypto).
Special thanks for the original work of:
LazyBear
everget
Jim8080

Keltner Channels BandsKeltner Channel Bands
Great indicator for mean reversion strategies.
Alerts you can set:
Crossover EMA
Crossunder EMA
Crossover upper band
Crossunder upper band
Crossover lower band
Crossunder lower band
Have fun!

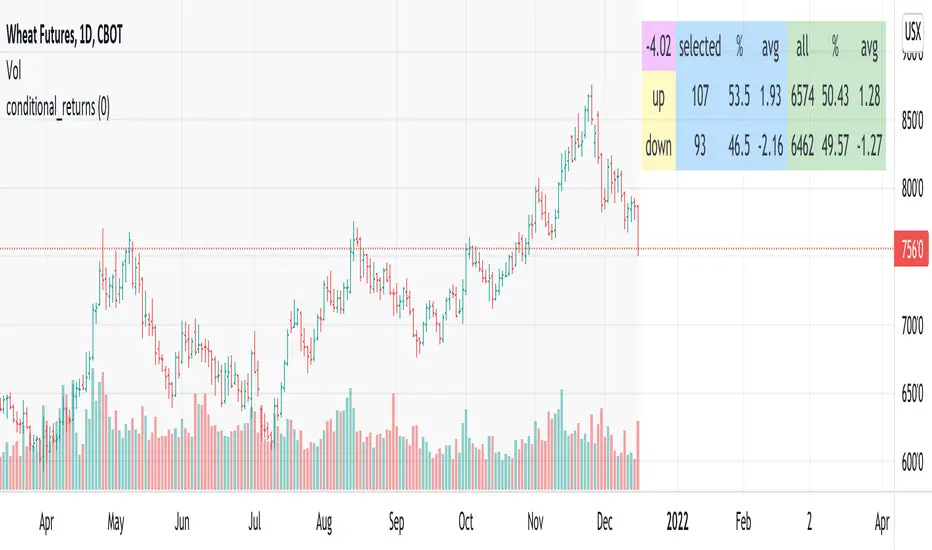
conditional_returnsThis script attempts to contextualize the instrument's latest return. It asks, "when a return of the same or greater magnitude occurred in the past, in the same direction, what was the following period's return?"
By default, the latest return is used. For example, on a daily chart, that would mean "today's" return. However, you can select any return you want using the "override" input.
The output table shows:
- The latest/override return, as a percentage. This is in the top left, fuchsia cell.
The first three, blue columns, show:
- The count of up and down (or positive and negative) next period returns. This shows you the sample size.
- The percentage of up/down next period returns.
- The average next-period return return, up and down, as percentages.
The next three, green columns show these same statistics, but for all returns--every period in the active date range is used. This data serves as a basis for comparison.
Note that you can select a custom date range with the "start" and "end" inputs. The corresponding area on the chart is shaded light grey, to show which data is used in the computations.
[cache_that_pass] 1m 15m Function - Weighted Standard DeviationTradingview Community,
As I progress through my journey, I have come to the realization that it is time to give back. This script isn't a life changer, but it has the building blocks for a motivated individual to optimize the parameters and have a production script ready to go.
Credit for the indicator is due to @rumpypumpydumpy
I adapted this indicator to a strategy for crypto markets. 15 minute time frame has worked best for me.
It is a standard deviation script that has 3 important user configured parameters. These 3 things are what the end user should tweak for optimum returns. They are....
1) Lookback Length - I have had luck with it set to 20, but any value from 1-1000 it will accept.
2) stopPer - Stop Loss percentage of each trade
3) takePer - Take Profit percentage of each trade
2 and 3 above are where you will see significant changes in returns by altering them and trying different percentages. An experienced pinescript programmer can take this and build on it even more. If you do, I ask that you please share the script with the community in an open-source fashion.
It also already accounts for the commission percentage of 0.075% that Binance.US uses for people who pay fees with BNB.
How it works...
It calculates a weighted standard deviation of the price for the lookback period set (so 20 candles is default). It recalculates each time a new candle is printed. It trades when price lows crossunder the bottom of that deviation channel, and sells when price highs crossover the top of that deviation channel. It works best in mid to long term sideways channels / Wyckoff accumulation periods.

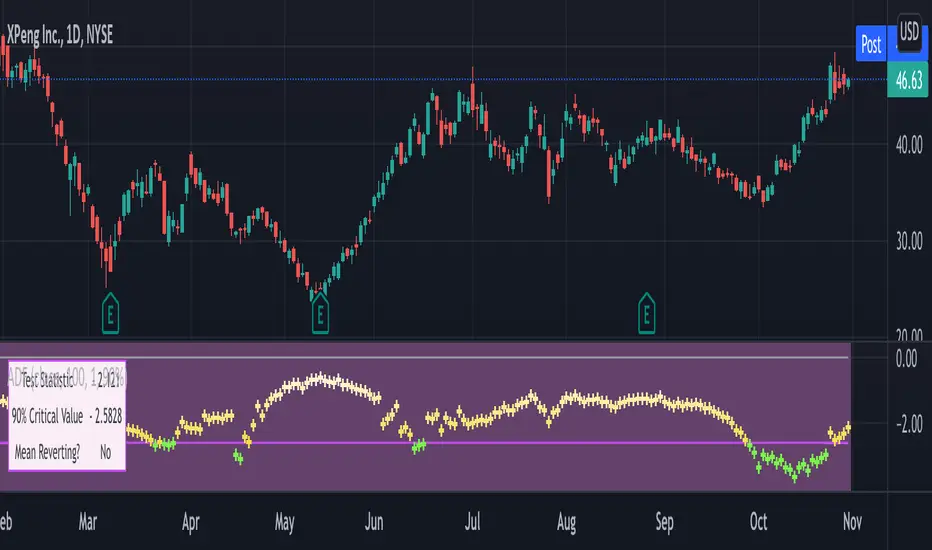
Augmented Dickey–Fuller (ADF) mean reversion testThe augmented Dickey-Fuller test (ADF) is a statistical test for the tendency of a price series sample to mean revert .
The current price of a mean-reverting series may tell us something about the next move (as opposed, for example, to a geometric Brownian motion). Thus, the ADF test allows us to spot market inefficiencies and potentially exploit this information in a trading strategy.
Mathematically, the mean reversion property means that the price change in the next time period is proportional to the difference between the average price and the current price. The purpose of the ADF test is to check if this proportionality constant is zero. Accordingly, the ADF test statistic is defined as the estimated proportionality constant divided by the corresponding standard error.
In this script, the ADF test is applied in a rolling window with a user-defined lookback length. The calculated values of the ADF test statistic are plotted as a time series. The more negative the test statistic, the stronger the rejection of the hypothesis that there is no mean reversion. If the calculated test statistic is less than the critical value calculated at a certain confidence level (90%, 95%, or 99%), then the hypothesis of a mean reversion is accepted (strictly speaking, the opposite hypothesis is rejected).
Input parameters:
Source - The source of the time series being tested.
Length - The number of points in the rolling lookback window. The larger sample length makes the ADF test results more reliable.
Maximum lag - The maximum lag included in the test, that defines the order of an autoregressive process being implied in the model. Generally, a non-zero lag allows taking into account the serial correlation of price changes. When dealing with price data, a good starting point is lag 0 or lag 1.
Confidence level - The probability level at which the critical value of the ADF test statistic is calculated. If the test statistic is below the critical value, it is concluded that the sample of the price series is mean-reverting. Confidence level is calculated based on MacKinnon (2010) .
Show Infobox - If True, the results calculated for the last price bar are displayed in a table on the left.
More formal background:
Formally, the ADF test is a test for a unit root in an autoregressive process. The model implemented in this script involves a non-zero constant and zero time trend. The zero lag corresponds to the simple case of the AR(1) process, while higher order autoregressive processes AR(p) can be approached by setting the maximum lag of p. The null hypothesis is that there is a unit root, with the alternative that there is no unit root. The presence of unit roots in an autoregressive time series is characteristic for a non-stationary process. Thus, if there is no unit root, the time series sample can be concluded to be stationary, i.e., manifesting the mean-reverting property.
A few more comments:
It should be noted that the ADF test tells us only about the properties of the price series now and in the past. It does not directly say whether the mean-reverting behavior will retain in the future.
The ADF test results don't directly reveal the direction of the next price move. It only tells wether or not a mean-reverting trading strategy can be potentially applicable at the given moment of time.
The ADF test is related to another statistical test, the Hurst exponent. The latter is available on TradingView as implemented by balipour , QuantNomad and DonovanWall .
The ADF test statistics is a negative number. However, it can take positive values, which usually corresponds to trending markets (even though there is no statistical test for this case).
Rigorously, the hypothesis about the mean reversion is accepted at a given confidence level when the value of the test statistic is below the critical value. However, for practical trading applications, the values which are low enough - but still a bit higher than the critical one - can be still used in making decisions.
Examples:
The VIX volatility index is known to exhibit mean reversion properties (volatility spikes tend to fade out quickly). Accordingly, the statistics of the ADF test tend to stay below the critical value of 90% for long time periods.
The opposite case is presented by BTCUSD. During the same time range, the bitcoin price showed strong momentum - the moves away from the mean did not follow by the counter-move immediately, even vice versa. This is reflected by the ADF test statistic that consistently stayed above the critical value (and even above 0). Thus, using a mean reversion strategy would likely lead to losses.
Hophop Reversion Strategy
█ OVERVIEW
Mean reversion is a financial term assuming that an asset's price will tend to converge to the average price over time.
Due to the trending nature of the crypto markets, mean reversion on a high timeframe could be pretty dangerous. When it comes to running mean reversion strategy on low timeframe, commission and slippage may cost more than strategy gains.
In this strategy, I tried to achieve being conservative in the trending market while avoiding trades if necessary and trading high probability reversion opportunities .
█ CONCEPTS
Strategy is build based on the combination of the momentum and the historical / implied volatility; when the price exceeds the potential volatility range, the strategy places the orders, and the target point is the mean of the expected range high and range low.
The range low and high lines displayed on the chart shows where to short or long, to make sure that the orders are limit orders; orders are placed 0.5% above/below the ranges!
Key information about the strategy
• All the orders are limit entry
• 0.02% commission is included in the backtest
• 30 ticks set for Verify Price Limit for Orders
• 30 ticks set for Slippage
• Initial version does not include the money management and hard stops hence you need to be extra cautious in trending markets
• Restricted to be used for BTC and ETH for 15 min timeframe
█ Ozet
Ortalamaya dönme, bir varlığın fiyatının zaman içinde ortalama fiyata yakınsama eğiliminde olacağını varsayan bir finansal terimdir.
Kripto piyasalarının trend egilimli doğası nedeniyle, yüksek zaman diliminde ortalamaya dönüş oldukça tehlikeli olabilir.
Ortalama geri dönüş stratejisini düşük zaman diliminde calistirmak söz konusu olduğunda, komisyon ve kayma, strateji kazanımlarından daha pahalıya mal olabilir.
Bu stratejide, gerektiğinde alım satımlardan kaçınırken ve yüksek olasılıklı ortalamaya dönüş fırsatlarını degerlendiren, trend olan piyasada ise isleme girerken temkinli olmasi uzerine calistim
█ Aciklama
Strateji, momentum ve tarihsel / zımni oynaklığın birleşimine dayalı olarak inşa edilmistir; fiyat potansiyel oynaklık aralığını aştığında, strateji emirleri verir ve hedef nokta, beklenen yüksek aralığın ve düşük aralığın ortalamasıdır.
Grafikte görüntülenen aralık alt ve üst satırları,
Stratejiye ait onemli bilgiler/b]
• Tüm emirler limit emirdir girişlidir
• Backtest performansinda %0.02 komisyon dahildir
• Limit Emir fiyat dogrulamasi icin 30 tick bekleme kullanilmistir
• Slippage için 30 tick bekleme kullanilmistir
• İlk sürüm para yönetimini ve stoploss içermez, bu nedenle trend olan piyasalarda ekstra dikkatli olmanız gerekir.
• 15 dakikalık zaman dilimi ile BTC ve ETH için kullanımla sınırlıdır
Emirlerin limit emir olduğundan emin olmak için nerede short veya long isleme girilecegini gosteren cizgilerin %0.5 üstünde/altında verilir!

Roc Mean Reversion (ValueRay)This Indicator shows the Absolute Rate of Change in correlation to its Moving Average.
Values over 3 (gray dotted line) can savely be considered as a breakout; values over 4.5 got a high mean-reverting chance (red dotted line).
This Indicator can be used in all timeframes, however, i recommend to use it <30m, when you want search for meaningful Mean-Reverting Signals.
Please like, share and subscribe. With your love, im encouraged to write and publish more Indicators.

Trend channel [log scale] with projection forecastTrend channel with projection forecast
This indicator is used to model data where growth or decay accelerates rapidly at first and then slows over time.
Because the channel distance is based off the largest pullback or highest peak within a trend, for effectively drawing and using this indicator it is recommended that this type of indicator is applied to mature trends .
This model is interesting for the long term series data (such as 10 or 20 years span) because can be plotted correctly on logarithmic charts .
Technical issues
*The user have to pan over the chart from the beginning to the end of the study range (such as 10 years of bars) so the pine script could generate those lines on the chart.
*If on the chart the number of bar is less than the lookback period, it won't generate any lines as well.
Disclaimer
Success in trading is all about following your trading strategy and indicators should fit into your own strategy, and not be traded purely on.
This script is for informational and educational purposes only. Use of the script does not constitute professional and / or financial advice. You are solely responsible for evaluating the outcome of the script and the risks associated with using the script. In exchange for the use of the script, you agree not to hold monpotejulien TradingView user responsible for any possible claims for damages arising out of any decisions you make based on the use of the script.

% Divergence of RSIA simple script that plots the difference between the %ROC of price vs the %ROC of RSI, AKA the % of divergence. A simple way to analyze how strong a potential divergence is. Top reversals are above 0, bottom reversals are below. A value of 0 means price and RSI are changing by the same % value. So, if oscillator is moving up as price moves up, it means divergence is increasing. If oscillator moves down as price moves up, it means divergence is decreasing.

Res/Sup With Concavity & Increasing / Decreasing Trend AnalysisPurple means the concavity is down blue means concavity is up which is good.
Yellow means increasing, Red means decreasing.
Sup = Green
Res = Red

Jaws Mean Reversion [Strategy]This very simple strategy is an implementation of PJ Sutherlands' Jaws Mean reversion algorithm. It simply buys when a small moving average period (e.g. 2) is below
a longer moving average period (e.g. 5) by a certain percentage and closes when the small period average crosses over the longer moving average.
If you are going to use this, you may wish to apply this to a range of investment assets using a screener for setups, as the amount signals are low. Alternatively, you may wish to tweak the settings to provide more signals.
Context can be found here:
LINK

Hurst ExponentMy first try to implement Full Hurst Exponent.
The Hurst exponent is used as a measure of long-term memory of time series. It relates to the autocorrelations of the time series and the rate at which these decrease as the lag between pairs of values increases
The Hurst exponent is referred to as the "index of dependence" or "index of long-range dependence". It quantifies the relative tendency of a time series either to regress strongly to the mean or to cluster in a direction.
In short, depending on the value you can spot the trending / reversing market.
Values 0.5 to 1 - market trending
Values 0 to 0.5 - market tend to mean revert
Hurst Exponent is computed using Rescaled range (R/S) analysis.
I split the lookback period (N) in the number of shorter samples (for ex. N/2, N/4, N/8, etc.). Then I calculate rescaled range for each sample size.
The Hurst exponent is estimated by fitting the power law. Basically finding the slope of log(samples_size) to log(RS).
You can choose lookback and sample sizes yourself. Max 8 possible at the moment, if you want to use less use 0 in inputs.
It's pretty computational intensive, so I added an input so you can limit from what date you want it to be calculated. If you hit the time limit in PineScript - limit the history you're using for calculations.
####################
Disclaimer
Please remember that past performance may not be indicative of future results.
Due to various factors, including changing market conditions, the strategy may no longer perform as good as in historical backtesting.
This post and the script don’t provide any financial advice.

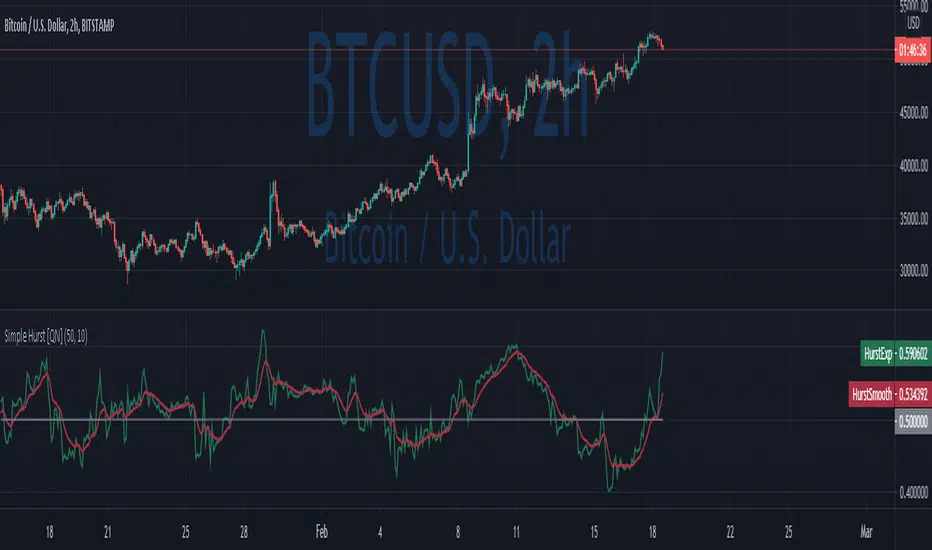
Simple Hurst Exponent [QuantNomad]This is a simplified version of the Hurst Exponent indicator.
In the meantime, I'm working on the full version. It's computationally intensive, so it's a challenge to squeeze it to PineScript limits. It will require some time to optimize it, so I decided to publish a simplified version for now.
The Hurst exponent is used as a measure of long-term memory of time series. It relates to the autocorrelations of the time series, and the rate at which these decrease as the lag between pairs of values increases
The Hurst exponent is referred to as the "index of dependence" or "index of long-range dependence". It quantifies the relative tendency of a time series either to regress strongly to the mean or to cluster in a direction.
In short depend on value you can spot trending / reversing market.
Values 0.5 to 1 - market trending
Values 0 to 0.5 - market tend to mean revert
####################
Disclaimer
Please remember that past performance may not be indicative of future results.
Due to various factors, including changing market conditions, the strategy may no longer perform as good as in historical backtesting.
This post and the script don’t provide any financial advice.