Volume Based RSI with ADXThe RSI indicator is a powerful tool that utilizes both volume and time to determine market trends. When there is a low volume of trades in a short period of time, but the trading activity is high, it is considered bullish or bearish. In the case of a bullish trend, the RSI indicator will display a green color, while a bearish trend will be represented by a red color. If there is no trading activity, the indicator will display a gray color. Additionally, if the ADX level meets the threshold level, the indicator will display a blue color. However, if the ADX level does not meet the threshold level, the indicator will revert back to displaying a gray color.
Rsidivergence

RSI + Divergences + Alerts [MisterMoTA]The indicator RSI + Divergences + Alerts by MisterMoTA is an RSI indicator that fills the RSI and RSI moving average with 4 different colors (growing up, falling up, falling down and rising down colors), users can customize colors from dashboard , also can be disabled the fill if the user want a standard RSI.
The dafault value of RSI is 14 and value of the moving average is 50 ( a dynamic 50 rsi line is better for trend identification than a standard 50 line) and users can change the values from indicator settings.
For detecting the divergences displayed in the indicator, I integrated in our script the default Divergences indicator from Tradingview, users can display, hide and change colors for regular and hidden divergences.
RSI indicator display also trend conditions for RSI and RSI MA, the RSI MA angle is calculated using ATR value, the slope of the RSI Noving Average can help to identify trend conditions too.
The script comes with 12 different alerts, if need different alerts please let me know in the comments and will update the script with your request:
Alert for Regular Bullish Divergence
Alert for Regular Bearish Divergence
Alert for Hidden Bullish Divergence
Alert for Hidden Bearish Divergence
Alert for RSI Overbought
Alert for RSI Extreme Overbought
"Alert for RSI Oversold
Alert for RSI Extreme Oversold
Alert for RSI Crossing Above RSI MA
Alert for RSI Crossing Bellow RSI MA
Alert for RSI Crossing Above 50
Alert for RSI Crossing Bellow 50
Please follow me for other script like this one.
Kind regards,
MisterMoTA

RSI with Close & Tail DivergencesRSI divergence is a cornerstone signal for both stock and cryptocurrency traders, renowned for its reliability.
The basis for measuring divergence can vary:
Historically, it's been determined by the candlestick's closing price.
However, a contemporary approach uses the tail values, specifically the high and low prices, of the candlestick.
Depending on the criteria selected, the resultant signals can be markedly different.
Our innovative indicator offers:
Divergence tracking based on the closing price of the candlestick.
Divergence tracking considering the candlestick's peak and trough values.
A unique convergence of both types of divergence signals.
With this tool, traders are empowered to make informed decisions, anchored in precise divergence cues.
This indicator boasts the following capabilities:
Displays divergence based on closing price, highs/lows, as well as a unique combined criterion.
Highlights pivot points.
Denotes divergence spots on the RSI chart with lines.
Offers a background color representation instead of labels.

Double Relative Strength Index (Double RSI)# Double Relative Strength Index (Double RSI) Indicator
The Double Relative Strength Index (Double RSI) is a custom trading indicator for the TradingView platform. It provides traders with two Relative Strength Index (RSI) bands, a fast RSI, and a slow RSI, which can be helpful in identifying potential entry and exit points in the market.
## Features
- **Uses 2 RSI Bands:** The indicator displays two RSI lines on the chart, providing insights into the short-term and long-term strength of the asset's price movement.
- **Fast and Slow RSI:** The fast RSI uses a shorter length, while the slow RSI uses a longer length, allowing traders to observe different time frames of price momentum.
- **Smoothing:** To reduce noise and improve the readability of the RSI lines, the indicator offers multiple smoothing options such as RMA, SMA, EMA, WMA, and HMA.
- **Crossover and Crossunder Signals:** The indicator identifies potential trading signals when the fast RSI crosses above or below the slow RSI. These events are visually highlighted on the chart with color-coded candlesticks.
- **RSI Bands:** The indicator also includes colored bands that represent different RSI levels, such as 80%, 75%, 60%, 50%, 45%, 25%, and 20%. These bands help visualize the RSI's current position relative to overbought and oversold conditions.
## How to Use
1. Add the "Double RSI" indicator to your TradingView chart.
2. Customize the input parameters according to your preferences, such as the lengths of the fast and slow RSIs and the smoothing method.
3. The indicator will display two RSI lines on the chart, each with its own color.
4. Look for crossover events where the fast RSI line crosses above the slow RSI line, indicating a potential bullish signal.
5. Watch for crossunder events where the fast RSI line crosses below the slow RSI line, indicating a potential bearish signal.
6. The colored bands represent different RSI levels. When the RSI is in the overbought (high) or oversold (low) regions, it may suggest a potential reversal in price direction.
## Disclaimer
Please remember that the Double RSI indicator is provided for informational purposes only and should not be considered as financial advice or a standalone trading strategy. Always perform your own research, use additional tools and indicators, and consider risk management techniques before making any trading decisions.
**Note:** This code is subject to the terms of the Mozilla Public License 2.0. For more details, refer to the (mozilla.org).
RSI Supreme Multi-Method [MyTradingCoder]Introducing the "RSI Supreme Multi-Method" indicator, a powerful tool that combines the Relative Strength Index (RSI) with selectable manipulation methods to identify overbought and oversold conditions in the market, along with the ability to detect divergences for enhanced trading insights.
The indicator features four distinct manipulation methods for the RSI, each providing valuable insights into market conditions:
1. Standard RSI Method: The indicator uses the traditional RSI calculation to identify overbought and oversold areas.
2. Volatility Weighted RSI Method: This method applies a volatility formula to the RSI calculation, allowing for a more responsive indication of market conditions during periods of heightened volatility. Users can adjust the length of the volatility formula to fine-tune this method.
3. Smoothed RSI Method: The smoothed RSI method utilizes a smoothing algorithm to reduce noise in the RSI values, presenting a clearer representation of overbought and oversold conditions. The length of the smoothing can be adjusted to match your trading preferences.
4. Session Weighted RSI Method: With this innovative method, users can specify multipliers for different time sessions throughout the day to manipulate the base RSI. Each session can be customized with start and end times, enabling or disabling specific sessions, and specifying the multiplier for each session. This feature allows traders to adapt the RSI to different market sessions dynamically.
Additionally, the "RSI Supreme Multi-Method" indicator draws divergences on the oscillator, providing an extra layer of analysis for traders. Divergences occur when the direction of the RSI differs from the direction of the price movement, potentially signaling trend reversals.
Key Settings:
RSI Length: Adjust the length of the base RSI before applying any manipulation.
RSI Source: Determine the data source for the base RSI calculation.
Overbought Value: Set the RSI value at which overbought conditions are indicated.
Oversold Value: Set the RSI value at which oversold conditions are indicated.
RSI Type: Choose from four options: Standard, Smoothed, Volatility Manipulated, or Session Manipulated.
Volatility Manipulated Settings: Adjust the length of the volatility formula (applicable to Volatility Manipulated method).
Smoothed Settings: Adjust the length of the smoothing (applicable to Smoothed method).
Session Manipulated Settings: Customize six different time sessions with start and end times, enable or disable specific sessions, and specify multipliers for each session.
Divergence Color: Adjust the color of the drawn divergences to suit your chart's aesthetics.
Divergence Tuning: Fine-tune the sensitivity of the divergence detection for more accurate signals.
The "RSI Supreme Multi-Method" indicator is a versatile and comprehensive tool that can be used to identify overbought and oversold areas, as well as to spot potential trend reversals through divergences. However, like all technical analysis tools, it should be used in conjunction with other indicators and analysis methods to make well-informed trading decisions.
Enhance your trading insights with the "RSI Supreme Multi-Method" indicator and gain an edge in identifying critical market conditions and divergences with precision.

RSI Divergence Screener by zdmreThis screener tracks the following for up to 20 assets:
-All selected tickers will be screened in same timeframes (as in the chart).
-Values in table indicate that how many days passed after the last Bullish or Bearish of RSI Divergence.
For example, when BTCUSDT appears Bullish-Days Ago (15) , Bitcoin has switched to a Bullish Divergence signal 15 days ago.
Thanks to @QuantNomad and @MUQWISHI for building the base for this screener.
*Use it at your own risk
Note:
Screener shows the information about the RSI Divergence Scanner by zdmre with default settings.
Based indicator:

RSI MTF [Market Yogi]The Multi-Time Frame RSI with Money Flow Index and Average is a powerful trading indicator designed to help traders identify overbought and oversold conditions across multiple time frames. It combines the Relative Strength Index (RSI) with the Money Flow Index (MFI) and provides an average value for better accuracy.
The Relative Strength Index (RSI) is a popular momentum oscillator that measures the speed and change of price movements. It oscillates between 0 and 100 and is used to identify overbought and oversold conditions in an asset. By incorporating the RSI across multiple time frames, this indicator offers a broader perspective on market sentiment.
In addition to the RSI, this indicator also includes the Money Flow Index (MFI). The MFI is a volume-based oscillator that measures the inflow and outflow of money into an asset. It takes into account both price and volume, providing insights into the strength and direction of buying and selling pressure.
By combining the RSI and MFI across multiple time frames, traders gain a comprehensive understanding of market dynamics. The indicator allows for comparing the RSI and MFI values across different time frames, enabling traders to identify divergences and potential trend reversals.
Furthermore, this indicator provides an average value of the multi-time frame RSI, offering a consolidated signal that helps filter out noise and enhance the accuracy of trading decisions.
Key Features:
1. Multi-Time Frame RSI: Combines the RSI across different time frames to provide a comprehensive view of market sentiment.
2. Money Flow Index (MFI): Incorporates the MFI to gauge buying and selling pressure based on both price and volume.
3. Average Calculation: Computes the average value of the multi-time frame RSI to generate a consolidated trading signal.
4. Divergence Detection: Enables traders to spot divergences between the RSI and MFI values, indicating potential trend reversals.
5. Overbought and Oversold Levels: Highlights overbought and oversold levels on the RSI, aiding in timing entry and exit points.
The Multi-Time Frame RSI with Money Flow Index and Average is a versatile tool that can be applied to various trading strategies, including trend following, swing trading, and mean reversion. Traders can adjust the time frame settings to suit their preferences and trading style.
Note: It's important to use this indicator in conjunction with other technical analysis tools and indicators to validate signals and make informed trading decisions.

RSI Divergences on price chart - Open Source CodeHello Traders,
I have some exciting news to share with you all! Recently, I came across an incredible RSI divergences indicator developed by Socrate_FR. This indicator, in my opinion has an exceptional accuracy in detecting RSI divergences. However, during my exploration of other indicators in the TradingView library that display signals on the price chart, I found that many of them were often unreliable and missed out on important divergences.One such example is the Prices / RSI Divergences Detector by vtllr. Although vtllr did an amazing job with the indicator, I noticed that it didn't capture several relevant divergences accurately.
This observation inspired me to enhance the most accurate RSI divergences indicator available by showcasing the signals directly on the price chart. By doing so, I aimed to address the issue of unreliable and missed divergences in other price chart indicators. With this enhanced version, you can now effortlessly identify and track RSI regular divergences on the price chart itself:
-Regular bullish divergence occurs when the price forms lower lows while the RSI indicator forms higher lows. It suggests a potential bullish reversal (green line plot)
-Regular bearish divergence occurs when the price forms higher highs while the RSI indicator forms lower highs. It suggests a potential bearish reversal (red line plot)
Another key mofication:
This Indicator introduces a simpler approach compared to the original Socrate indicator. While Socrate differentiated divergences into eight types for both bullish and bearish scenarios, our enhanced version focuses on two distinct categories: small and big divergences. This decision was made to provide a clearer and more user-friendly experience. By condensing the divergence types into two groups, traders can easily identify and analyze the significance of the divergences without getting overwhelmed by excessive variations. The small divergences represent relatively minor divergences, while the big divergences indicate stronger and more significant signals.
-Small divergences represent relatively minor divergences (plotshape small circle)
-Big divergences indicate stronger signals (plotshape big circle)
I firmly believe that this enhanced RSI Divergences Indicator will be an invaluable tool for traders who rely on RSI analysis in their trading strategies. It combines the accuracy of Socrate_FR's original indicator with the enhanced visibility of signals on the price chart, ensuring you never miss any important divergences.
If you're interested in trying out this enhanced version of the indicator, please feel free to access the open-source code. If you want to visit and try the original version of the code visit Socrate_FR profile.
www.tradingview.com
Keep attention!
It is important to note that no trading indicator or strategy is foolproof, and there is always a risk of losses in trading. While this indicator may provide useful information for making conclusions, it should not be used as the sole basis for making trading decisions. Traders should always use proper risk management techniques and consider multiple factors when making trading decisions.
Support us:)
If you find this new indicator helpful in your trading analysis, I would greatly appreciate your support! Please consider to follow, giving it a like, leaving feedback, or sharing it with your trading network. Your engagement will not only help me improve this tool but will also help other traders discover it and benefit from its features. Thank you for your support!

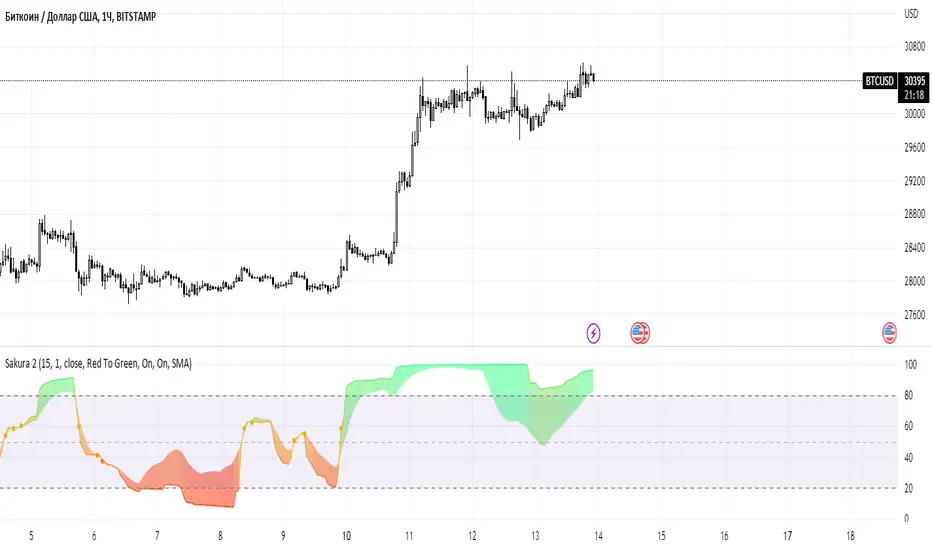
Sakura 2The oscillator uses an adaptive moving average as input to another RSI oscillator and is designed to provide a way to minimize the impact of corrections on the output of the oscillator without significant lag.
An additional trigger line is present in order to provide entry points from intersections between the oscillator and the trigger line.
I'll be working on the code to add and describe the privileges and the best settings
Settings
=Lengthy : period of the oscillator
=Power : controls the sensitivity of the oscillator to retracements, with higher values minimizing the sensitivity to retracements.
=Src : source input of the indicator
The indicator also includes the following graphical settings:
=Gradient : Determines the color mode to use for the gradient, options include "Red To Green", "Red To Blue" and "None", with "None" displaying no gradient.
=Color fill : Determines whether to fill the area between the oscillator and the trigger line or not, by default "On".
=Circles : Determines whether to show circles highlighting the crosses between the oscillator and the trigger line.
Divergence for Many [Dimkud - v5]Strategy is based on "Divergence for Many Indicators v4 ST" strategy by CannyTolany01
which is based on "Divergence for Many Indicator" indicator by LonesomeTheBlue
This strategy is searching for divergences on 18 indicators which you can select and optimise one by one.
Additionally you can connect any other External Indicator value. (just add this indicator the the chart and select option in settings)
To the original indicator/strategy I have added 9 additional indicators:
( Money Flow Index, Williams_Vix, Stochastic RSI , SMI Ergodic Oscillator, Volume Weighted MACD , Bull Bear Power, Balance of Power , Relative Volatility Index , Logistic Settings).
Converted strategy to v5 of Pine Script.
Added Static SL/TP in percents (%).
Added filters to filter enters:
1. Volume Weighted MACD - Multi-TimeFrame Filter
(It checks for histogram to falling or rising for a set periods of bars)
2. Money Flow Index - Multi-TimeFrame Filter
(It checks if MFI Oscillator is in the set diapason.
Also It checks if MFI is falling or rising for a set periods of bars )
3. ATR filter
(check changes in fast ATR to slow ATR )
Strategy shows good backtest results on many crypto tokens on 45m - 1h periods. (with parameters optimisation for every indicator)
To find best parameters - you can enable indicators one-by one, and optimise best parameters for each of them.
Then enable all indicators with successful results.
Optimise SL/TP.
Then try to enable and optimise filters (channels etc.)
The better is to optimise parameters separately for Short and Long trading. And run two separate bots (in settings enable only Long or only Short.)
Updates:
- Added visualisation for open trades (SL/TP)
- Added Volatility filter by ATR with many options for tests.
- Fixed some small bugs.
- Added second RSI filter (you can use two RSIs with different TF or settings)
- Updated ATR volatility and MFI filter. Removed non-effective options
- Added CCI filter
- Added option to Enable/Disable visualisation of TP/SL on chart
- Fixed one small quick bug. ("ATR filter short" was not working)
- Added Super Trend filter
- Added Momentum filter
- Added Volume Filter
- All "request.security" MultiTimeFrame calls changed to 100% non-repait function "f_security()"

RSIOMA with Volume Index ConfirmationThis indicator is called "RSIOMA with Volume Index Confirmation". It is a technical analysis tool that plots buy and sell signals on a chart based on the Relative Strength Index (RSI) and the Negative Volume Index (NVI) and Positive Volume Index (PVI) indicators.
The indicator has the following input parameters:
- RSI Length: determines the number of periods used to calculate the RSI. Default value is 14.
- Overbought Level: determines the RSI level at which a security is considered overbought. Default value is 70.
- Oversold Level: determines the RSI level at which a security is considered oversold. Default value is 30.
- NVI Length: determines the number of periods used to calculate the Negative Volume Index. Default value is 255.
- PVI Length: determines the number of periods used to calculate the Positive Volume Index. Default value is 255.
The indicator calculates the RSI using the RSI Length input parameter and the close price of the security. It also calculates the NVI and PVI by looping through the volume data and the close price data of the security over the specified periods.
The indicator then uses the RSI, NVI, and PVI to determine buy and sell signals. A bearish divergence signal is generated when the RSI from one period ago is greater than the Overbought Level, the current RSI is less than the Overbought Level, and the close price from one period ago is greater than the current close price. A bullish divergence signal is generated when the RSI from one period ago is less than the Oversold Level, the current RSI is greater than the Oversold Level, and the close price from one period ago is less than the current close price. A sell signal is generated when a bearish divergence signal occurs and the current NVI is less than the previous NVI value. A buy signal is generated when a bullish divergence signal occurs and the current PVI is greater than the previous PVI value.
The indicator plots the buy and sell signals on the chart as green and red triangles, respectively. The "overlay=true" parameter in the indicator function indicates that the signals are plotted on top of the security's price chart.

RSI TREND FILTERRSI TREND Filter on Chart
RSI scaled to fit on chart instead of oscillator, Trend Analysis is easy and Hidden Divergence is revealed using this indicator. This indicator is an aim to reduce confusing RSI Situations. The Oversold and Overbought lines help to determine the price conditions so its easy to avoid Traps.
Oversold and Overbought conditions are marked on Chart to make it useful to confirm a Buy or Sell Signals.
RSI 50 level is plotted with reference to EMA50 and Oversold and Overbought Conditions are calculated accordingly.
Uptrend: RSI Cloud / Candles above RSI 50 Level
Down Trend: RSI Cloud / Candles below RSI 50 Level
Sideways : Candles in the Gray Area above and below RSI 50 Level
Default RSI (14) : is the Candlestick pattern itself
Disclaimer: Use Solely at your own Risk.

RSI DivergenceWhat is "RSI Divergence"?
"RSI Divergence" is a indicator that find RSI divergence automatically.
What it does?
When it finds an RSI divergence, it draws a line on the indicator.
How it does it?
The lines are found using the least squares method. If the signs of the linear regression on the graph and the linear regression plotted on the RSI are different, this is considered divergence.
How to use it?
RSI lenght = RSI lenght
source = source of RSI
RSI Divergence Lenght = lenght of lines that draws on indicator
zoom = zoom
examples:

RSI Momentum Acceleration by TartigradiaPlots the momentum acceleration oscillators from price and RSI, rescaled and with areas above/below highlighted.
Usage: in a nutshell, when the background is yellow, it's bearish (RSI decelerates faster than price), whereas when the background is green, it's bullish (RSI accelerates faster than price). It appears to detect early some reversals that are otherwise difficult to detect.
Note: it supports using any other indicator's output as the second source input, instead of RSI. PineScript does not allow for more than one source to receive input from other indicators, all the others must only use price as an input.
This indicator uses the core routine to calculate Momentum Acceleration Oscillators by DGT:
This indicator is based on the idea of stinkbug : "RSI is a good momentum indicator showing how excited ppl are on a move, this is why divergences on it work so well. I would like to see the change accelerating or slowing on a move up or down.."

Yasir Hameed Advance RSI IndicatorRELATIVE STRENGTH INDEX ( RSI )
This is a tool that is widely used
Especially for Overbought and Oversold systems, but I have made some changes in this indicator,
How to use it...!
I have set it as the default setting
- RSI Length: 7
- Overbought: 70
- Oversold: 30
What is unique about this tool?
we can see 3 conditions:
1) RSI Overbought / Oversold with Bullish Engulfing / Bearish Engulfing
2) RSI Overbought / Oversold with Hammer and Shooting Star
3) RSI Overbought / Oversold with 2 Bullish Bars / 2 Bearish Bars
4) RSI Overbought / Oversold with All Patterns at the same time
When the RSI reaches its Oversold line, the code will wait for Bullish Engulfing pattren, when oversold and Bullish engulfing matched, This indicator will generate a buy signal when the condition is met,
and same as for Bear market, When the RSI reaches its Overbought line, the code will wait for Bearish Engulfing pattren, This indicator will generate a sell/exit signal when the condition is met,
2nd condition is that a Hammer candle will be waited for when RSI touches the Overbought line, for Bullish Move
and Shooting Star candle will be waited for when RSI touches the Overbought line, for Bullish Move, for Bearish Move
3rd Condition is also the same as Condition 1 and Condition 2,
When the RSI reaches its Oversold line, the code will wait for 2 Bullish Bars, when oversold and 2 Bullish Bars matched then this indicator will generate a buy signal, and same as for Bear market,
When the RSI reaches its Overbought line, the code will wait for 2 Bearish Bars, when overbought and 2 Bearish Bars matched then this indicator will generate a Sell signal,
4th Condition is that we can use All Conditions at the same time,
- Bullish Engulfing / Bearish Engulfing
- Hammer and Shooting Star
- 2 Bullish Bars / 2 Bearish Bars

RSI Potential Divergence - FontiramisuIndicator showing potential momentum divergences on RSI Momentum.
The problem with the classic divergence is that when the signal appears, it is sometimes too late to enter a trade.
The potential divergence corrects this problem by signaling the beginning of a potential divergence.
RSI is a momentum indicator that offers relevant insights with divergences.
Potential divergences are indicated with the letter B and a red color for Bearish Div or Green color for Bullish Div .
Potential divergence is confirmed when the line and the label "Bear"' or "Bull" appear.

Ultimate RSI With Some Spices★彡 𝓤𝓵𝓽𝓲𝓶𝓪𝓽𝓮 𝓡𝓢𝓘 𝓦𝓲𝓽𝓱 𝓢𝓸𝓶𝓮 𝓢𝓹𝓲𝓬𝓮𝓼 彡★
* Hi everybody here's the ★彡 𝓤𝓵𝓽𝓲𝓶𝓪𝓽𝓮 𝓡𝓢𝓘 𝓦𝓲𝓽𝓱 𝓢𝓸𝓶𝓮 𝓢𝓹𝓲𝓬𝓮𝓼 彡★ indicator and how to use it :
彡彡彡彡彡彡彡彡彡彡彡彡彡彡彡彡彡彡彡彡彡彡彡彡彡彡彡彡彡
First we have that red : green {RSI EMA Line}line in the indicator which show the current symbol situation \
𝐒𝐢𝐦𝐩𝐥𝐲 : 𝐢𝐟 𝐭𝐡𝐞 𝐥𝐢𝐧𝐞 𝐜𝐥𝐨𝐬𝐞 𝐰𝐢𝐭𝐡 𝐠𝐫𝐞𝐞𝐧 𝐜𝐨𝐥𝐨𝐫 𝐲𝐨𝐮 𝐜𝐚𝐧 𝐨𝐩𝐞𝐧 𝐚 𝐥𝐨𝐧𝐠 𝐭𝐫𝐚𝐝𝐞 𝐚𝐧𝐝 𝐞𝐱𝐢𝐭 𝐰𝐡𝐞𝐧 𝐭𝐡𝐞 𝐫𝐞𝐝 𝐜𝐨𝐥𝐨𝐫 𝐚𝐩𝐩𝐞𝐚𝐫𝐬
I𝐧 𝐭𝐡𝐞 𝐬𝐚𝐦𝐞 𝐭𝐢𝐦𝐞 𝐰𝐞 𝐡𝐚𝐯𝐞 𝐨𝐭𝐡𝐞𝐫 𝐭𝐡𝐢𝐧𝐠𝐬 𝐭𝐨 𝐮𝐬𝐞 𝐰𝐢𝐭𝐡 𝐭𝐡𝐚𝐭 𝐰𝐨𝐮𝐥𝐝 𝐡𝐞𝐥𝐩 𝐮𝐬 𝐭𝐨 𝐦𝐚𝐤𝐞 𝐚 𝐠𝐨𝐨𝐝 𝐨𝐫𝐝𝐞𝐫
Like The 𝐂𝐲𝐜𝐥𝐞𝐫 𝐬𝐢𝐭𝐮𝐚𝐭𝐢𝐨𝐧 𝐚𝐧𝐝 𝐟𝐢𝐛𝐨𝐧𝐚𝐜𝐜𝐢 𝐥𝐞𝐯𝐞𝐥𝐬
We have the 𝐧𝐞𝐱𝐭 𝐟𝐢𝐛𝐨𝐧𝐚𝐜𝐜𝐢 𝐥𝐞𝐯𝐞𝐥𝐬 𝟐𝟎 ,𝟑𝟎 ,𝟓𝟎 ,𝟔𝟏.𝟖 ,𝟖𝟎 { 61.8 𝐢𝐬 𝐭𝐡𝐞 𝐭𝐡𝐞 𝐟𝐢𝐛𝐨𝐧𝐚𝐜𝐜𝐢 𝐠𝐨𝐥𝐝𝐞𝐧 𝐫𝐚𝐭𝐢𝐨 }
About The 𝐂𝐲𝐜𝐥𝐞𝐫 you can use it to know where is the current symbol go { UP : Green ,| Down : Red ,| White : Where the symbol movement is in a slight fluctuation without any significant up or down }
░▒▓█ 𝐍𝐨𝐭𝐞 : 𝐓𝐡𝐞 𝐂𝐲𝐜𝐥𝐞𝐫 𝐥𝐢𝐧𝐞 𝐢𝐬 𝐭𝐡𝐞 𝐬𝐚𝐦𝐞 𝐟𝐢𝐛𝐨𝐧𝐚𝐜𝐜𝐢 𝐥𝐞𝐯𝐞𝐥 ' 𝐫𝐚𝐭𝐢𝐨 𝟓𝟎 ' █▓▒░
𝐡𝐞𝐫𝐞'𝐬 𝐚 𝐟𝐚𝐬𝐭 𝐩𝐡𝐨𝐭𝐨 𝐭𝐡𝐚𝐭 𝐬𝐡𝐨𝐰 𝐞𝐯𝐞𝐫𝐲𝐭𝐡𝐢𝐧𝐠
When the RSI EMA Line reach the purple 𝐟𝐢𝐛𝐨𝐧𝐚𝐜𝐜𝐢 level its a very good entry point where the RSI is over sold and ready to g oup again
When the RSI EMA Line reach the Golden 𝐟𝐢𝐛𝐨𝐧𝐚𝐜𝐜𝐢 level its a very important area in the line crossover it then it's a very amazing entry time but if the RSI EMA line crossunder this line then the price w'll drop down
❤❤❤❤ 𝐟𝐢𝐧𝐚𝐥𝐥𝐲 𝐇𝐚𝐯𝐞 𝐚 𝐠𝐨𝐨𝐝 𝐭𝐢𝐦𝐞 ❤❤❤❤
RSI - S&P Sector ETFsThe script displays RSI of each S&P SPDR Sector ETF
XLB - Materials
XLC - Communications
XLE - Energy
XLF - Financials
XLI - Industrials
XLK - Technology
XLP - Consumer Staples
XLRE - Real Estate
XLU - Utilities
XLV - Healthcare
XLY - Consumer Discretionary
It is meant to identify changes in sector rotation, compare oversold/overbought signals of each sector, and/or any price momentum trading strategy applicable to a trader.

RSI Divergence Scanner by zdmreDivergence is when the price of an asset is moving in the opposite direction of a technical indicator, such as an oscillator, or is moving contrary to other data. Divergence warns that the current price trend may be weakening, and in some cases may lead to the price changing direction.
If the stock is rising and making new highs, ideally the RSI is reaching new highs as well. If the stock is making new highs, but the RSI starts making lower highs, this warns the price uptrend may be weakening. This is negative divergence.
Positive divergence is the opposite situation. Imagine the price of a stock is making new lows while the RSI makes higher lows with each swing in the stock price. Investors may conclude that the lower lows in the stock price are losing their downward momentum and a trend reversal may soon follow.
Divergence is one of the common uses of many technical indicators, primarily the oscillators.
Use it at your own risk

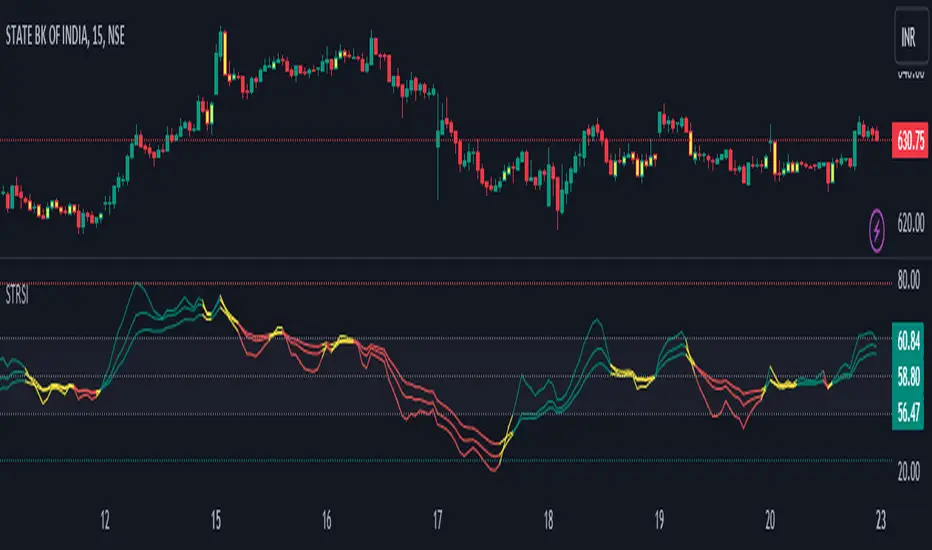
RSI Scalping & Swing Signals With AlertsThis RSI indicator shows a green or red ribbon when the smoothed RSI is bullish or bearish. It also includes a long moving average for overall trend confirmation. Wait until the ribbon holds above or below the long moving average and take positions in that direction.
To get an easier to read RSI indicator, I smoothed the RSI out and paired it next to a short term RMA. These two together form the ribbon that will show you early reversals and trend direction. The long moving average is used as an overall trend detector and confirmation for longer term trends.
***HOW TO USE***
Scalping: Enter longs when the ribbon turns green and enter shorts when the ribbon turns red. Exit positions when the ribbon turns the opposite color or crosses the long moving average.
Swing Trading: When the ribbon holds above the long moving average or breaks out and retests it, look for long positions and exit when the ribbon turns red or crosses the long moving average. When the ribbon holds below the long moving average or breaks down and retests it, look for short positions and exit when the ribbon turns green or crosses the long moving average.
***DETAILS***
This indicator gives early reversal signals very well and waiting for the RSI ribbon to cross the long moving average helps to get you into positions when the market is ready to really move while filtering out some of the noise.
The ribbon and background will change to green or red depending on whether it is currently bullish or bearish.
There is also a label that changes colors and tells you if RSI is bullish or bearish and also whether the RSI ribbon is above or below the long moving average.
Green or red circles will appear on the indicator when there is a bullish or bearish cross of the RSI ribbon and the long moving average.
It also has alerts that trigger when RSI is turning bullish/bearish or when the RSI ribbon is crossing the long moving average.
***CUSTOMIZATION***
Each piece of this indicator can be customized to suit your preferences including the RSI source, length, smoothing length, short moving average length and long moving average length. You can also turn off the labels, signals and long moving average. All of these settings can be managed within the indicator settings input tab.
***MARKETS***
This indicator can be used as a signal on all markets, including stocks, crypto, futures and forex.
***TIMEFRAMES***
This RSI Scalping & Swing Signals indicator can be used on all timeframes.
***TIPS***
Try using numerous indicators of ours on your chart so you can instantly see the bullish or bearish trend of multiple indicators in real time without having to analyze the data. Some of our favorites are Trend Friend Scalp & Swing Trade Signals, Volume Spike Scanner, Buy & Sell Pressure Volume Profile, and Momentum Scalper in combination with this RSI indicator. They all have real time Bullish and Bearish labels as well so you can immediately understand each indicator's trend.

Bogdan Ciocoiu - CoordinatorDescription
The Coordinator is an indicator developed on the back of the RSI algorithm, modified substantially to form a cloud. In addition, the Coordinator uses EMA/SMA to compare the location of the RSI cloud with the chosen moving averages (EMA vs SMA).
This indicator is helpful as it confirms when a trader should enter a position or exit based on the proximity of the RSI cloud to the relevant MA.
Uniqueness
The Coordinator provides unique benefits, including:
It shows the strength of the RSI in the shape of the RSI cloud, using two sets of dimensions (one more long term and one more short-term oriented).
It indicates the positioning of the RSI cloud in conjunction with the relevant moving averages to help traders remain in positions for longer.
It shows the RSI 14 (useful when spotting divergences aligned with the price action).
Open-source
The Coordinator uses the following open-source scripts:
www.tradingview.com

Bogdan Ciocoiu - LitigatorDescription
The Litigator is an indicator that encapsulates the value delivered by the Relative Strength Index, Ultimate Oscillator, Stochastic and Money Flow Index algorithms to produce signals enabling users to enter positions in ideal market conditions. The Litigator integrates the value delivered by the above four algorithms into one script.
This indicator is handy when trading continuation/reversal divergence strategies in conjunction with price action.
Uniqueness
The Litigator's uniqueness stands from integrating the above algorithms into the same visual area and leveraging preconfigured parameters suitable for short term scalping (1-5 minutes).
In addition, the Litigator allows configuring the above four algorithms in such a way to coordinate signals by colour-coding or shape thickness to aid the user with identifying any emerging patterns quicker.
Furthermore, Moonshot's uniqueness is also reflected in the way it has standardised the outputs of each algorithm to look and feel the same, and in doing so, enabling users to plug them in/out as needed. This also includes ensuring the ratios of the shapes are similar (applicable to the same scale).
Open-source
The indicator uses the following open-source scripts/algorithms:
www.tradingview.com
www.tradingview.com
www.tradingview.com
www.tradingview.com

MFI + RSI + MOM With Bull & Bear Trend LabelMOMENTUM + MONEY FLOW INDEX + RELATIVE STRENGTH INDEX WITH BULL & BEAR LABELS
This is a combination of 3 popular indicators. Momentum(MOM), Money Flow Index(MFI) and Relative Strength Index(RSI) along with color changing labels that tell you each indicator's current trend.
The middle white line shows the level that each indicator needs to stay above to be bullish and below for bearish. Watch for all three indicators to cross and hold above or below the mid line for big moves.
It is important to note that these indicators do not need to be going up to be bullish or down to be bearish. They just need to hold above or below the mid line to understand the overall trend.
The momentum indicator is the most relevant in my opinion. If it is holding above the mid line steadily, usually the overall trend will continue upwards so look to buy the dips if the momentum cloud is staying above the white line and vice versa.
It is also important to note that the default settings for this indicator are the 100 period as I find it to be super relevant across most charts but these numbers can be changed in the indicator settings.
Since momentum swings wildly past the normal 0-100 range, it is important to note that the momentum line has been “normalized” to stay within this same range as the rsi and mfi. So if you look at a normal momentum indicator side by side with this indicator it will not look the same however, I find it to be a very good indicator of overall direction so I know the current market sentiment even when price is diverging from the indicator directions.
All of the colors, sources and lengths can be easily customized in the indicator settings input tab.
***HOW TO USE***
When Momentum is above the mid line, it is bullish. When Momentum is below the mid line, it is bearish.
A label on the right side will update in real time to tell you if momentum is Bullish or Bearish for faster recognition of the trend.
When RSI is above the mid line, it is bullish. When Momentum is below the mid line it is bearish.
A label on the right side will update in real time to tell you if RSI is Bullish or Bearish for faster recognition of the trend.
When MFI is above the mid line, it is bullish. When MFI is below the mid line it is bearish.
A label on the right side will update in real time to tell you if MFI is Bullish or Bearish for faster recognition of the trend.
This indicator was built to help you quickly identify the Bullish or Bearish nature of the current trend with a live color changing label so you can glance at the label and understand it's direction without analyzing the indicator data.
***MARKETS***
This indicator can be used as a signal on all markets, including stocks, crypto, futures and forex.
***TIMEFRAMES***
This mom + mfi + rsi indicator can be used on all timeframes.
***TIPS***
Try using numerous indicators of ours on your chart so you can instantly see the bullish or bearish trend of multiple indicators in real time without having to analyze the data. Some of our favorites are our Auto Fibonacci, Directional Movement Index, Volume Profile, Auto Support And Resistance and Money Flow Index in combination with this indicator. They all have real time Bullish and Bearish labels as well so you can immediately understand each indicator's trend.
