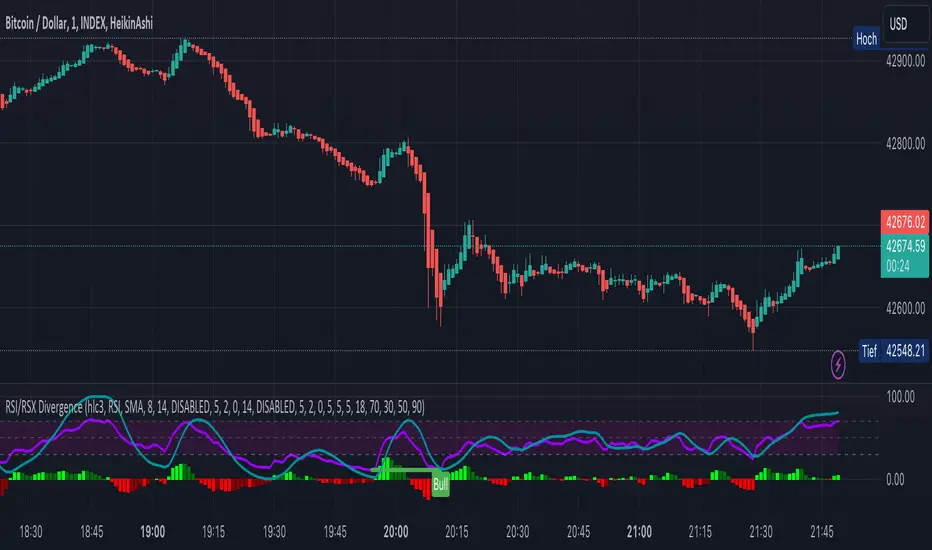
KINSKI RSI/RSX DivergenceThe Relative Strength Index (RSI) is a momentum indicator that measures the magnitude of recent price changes to analyse overbought or oversold conditions. RSI values range from 0 to 100.
The Relative Strength Index (RSI) is calculated using the following formula: RSI = 100 - 100 / (1 + RS) Where RS = average gain of upward phases during the specified time frame / average loss of downward phases during the specified time frame.
An asset price is considered overbought (due for a correction) if the RSI is above 70 and oversold (due for a recovery) if it is below 30. More extreme values (80/20) are also used to avoid false readings.
In a strong uptrend, the RSI often reaches 70 and above for long periods, and downtrends can remain at 30 or below for long periods.
Divergence detection in RSI is one of the important functions of this indicator. The reason is that an RSI divergence is a more reliable signal than the overbought and oversold indicators themselves. You will get overbought and oversold signals all the time. However, the divergence is a rare event.
In general, RSI divergence means that the RSI indicator is moving in the opposite direction compared to the price. So while the price is moving, the RSI is telling us in advance to expect a change in direction.
Positive RSI divergence
A positive RSI divergence is when the price trend has lower lows and lower highs, while the RSI indicator does the opposite - higher highs and higher lows. The price continues to fall while the RSI indicator begins to rise.
Negative RSI divergence
Negative RSI divergence is the opposite of positive divergence. It applies to uptrends where the price reaches higher highs and higher lows. However, the RSI shows lower highs and lower lows - the price goes up but the RSI goes down. The price closes with higher highs and higher lows, while the RSI indicator does the opposite - lower lows and lower highs, confirming a negative divergence. As a result, there is a sharp decline in the price.
RSX Indicator - Base script: SharkCIA by Jaggedsoft (Linked in the source code)
The RSX is the noise-free variant of the more popular RSI oscillator. Typically, any indicator can be smoothed by applying a moving average. However, a major disadvantage of such a method is that there is a time lag between the indicator and the price. RSX Indicator attempts to do this without signal delay.
What distinguishes this indicator from others of this type?
Display of RSI indicator together/alone with RSX and RSI smoothed
display of the RSI indicator (option: "RSI: On/Off")
display of the RSX indicator (option: "RSX: On/Off")
display of the RSI indicator as smoothed version (option: "RSI Smoothed: On/Off")
offers the possibility to choose between different view variants
many settings for additional information, layout and divergence identification
enables completely new comparison possibilities and insights with the additional RSI variants
Rsidivergence
Relative Volume Strength Index (MZ RVSI)INTRODUCTION
Volume always plays a role of key indication for price movements and momentum and I always found the same problem with all available volume oscillators and indicators which is that their data is always in compounded form that can’t be easily used in raw form as a parameter in many strategies.
This indicator uses raw volume data from one of following oscillators:
TFS Volume Oscillator
On Balance Volume
Klinger Volume Oscillator
Cumulative Volume Oscillator
Volume Zone Oscillator
Then this data goes through the following process of noise filtration:
Hull Moving Average of input data to reduce noise
Relative Strength Index of HMA
Hull Moving Average of RSI to reduce noise for finalized RVSI
ADDITIONAL FEATURES
Heiken-Ashi: Heiken-Ashi values are optional to use in calculations and I’ve set them to default as I found good results with them.
Slope for Trend Detection: Slope of finalized RVSI is calculated in order to check volume trend direction. Another additional feature of Volume breakouts is also added which is used in dynamic coloring of RVSI. Dynamic color indications are as follows.
Green Color:
Strong Volume Uptrend above volume breakout point
Fuchsia Color:
Weak Volume Uptrend below volume breakout point but slope supported
Red Color:
Strong Volume Downtrend below volume breakout point
Gray Color:
Weak Volume Downtrend above volume breakout point but slope supported
Yellow Color:
Possible trend reversal as slope is flat.
DEFAULTS SETTINGS
Volume length is 30 (Better for timeframes higher than 1H)
Hull Moving Average and RSI length is set to 14
ADDITIONAL APPLICATIONS
This indicator can be used as divergence detection tool for volume same way as RSI is used for price divergence. I’ll soon add divergence signals inside the code and this code can be used in multiple ways as volume breakout indication in strategies for better results.

RSI DINGUE - 3³ DivergenceThis is the updated version for PineScript V5
3x RSI indicator into 1. You can turn on or off all of them.
Each RSI has 2 individual Moving Averages that can also be changed to be "Full RSI" in the settings.
This makes 3x3 = 9 indicators on screen at the same time. (you can turn them on or off)
It has Bullish and Bearish divergence and hidden divergence as well.
Several visual options to show crosses between RSIs and or MAs fill in colors, background colors, midline. Overbought and Oversold levels with signals when entry and exit.
---------------------
In closing, no indicator can give perfect signals, you need to use them in conjunction with other information to make better decisions.
I hope you like my indicators and that they help your trading.
If you have any questions please ask.
Thank you.

EMA Cross + Divergence strategy (Div. signals by The Divergent)A sample strategy demonstrating the usage of The Divergent divergence indicator and The Divergent Library .
The Divergent is an advanced divergence indicator which you can easily incorporate into your own strategies.
In order to use this strategy (and to use the signals in your own strategy), you need to have the Pro version of The Divergent applied to your chart.
For more information, please see the comments inlined in the code.

The Divergent LibraryLibrary "TheDivergentLibrary"
The Divergent Library is only useful when combined with the Pro version of The Divergent - Advanced divergence indicator . This is because the Basic (free) version of The Divergent does not expose the "Divergence Signal" value.
Usage instructions:
1. Create a new chart
2. Add The Divergent (Pro) indicator to your chart
3. Create a new strategy, import this library, add a "source" input, link it to "The Divergent: Divergence Signal", and use the library to decode the divergence signals from The Divergent (You can find example strategy code published in our profile)
4. Act on the divergences signalled by The Divergent
---
isRegularBullishEnabled(context) Returns a boolean value indicating whether Regular Bullish divergence detection is enabled in The Divergent.
Parameters:
context : The context of The Divergent Library.
Returns: A boolean value indicating whether Regular Bullish divergence detection is enabled in The Divergent.
isHiddenBullishEnabled(context) Returns a boolean value indicating whether Hidden Bullish divergence detection is enabled in The Divergent.
Parameters:
context : The context of The Divergent Library.
Returns: A boolean value indicating whether Hidden Bullish divergence detection is enabled in The Divergent.
isRegularBearishEnabled(context) Returns a boolean value indicating whether Regular Bearish divergence detection is enabled in The Divergent.
Parameters:
context : The context of The Divergent Library.
Returns: A boolean value indicating whether Regular Bearish divergence detection is enabled in The Divergent.
isHiddenBearishEnabled(context) Returns a boolean value indicating whether Hidden Bearish divergence detection is enabled in The Divergent.
Parameters:
context : The context of The Divergent Library.
Returns: A boolean value indicating whether Hidden Bearish divergence detection is enabled in The Divergent.
getPivotDetectionSource(context) Returns the 'Pivot Detection Source' setting of The Divergent. The returned value can be either "Oscillator" or "Price".
Parameters:
context : The context of The Divergent Library.
Returns: One of the following string values: "Oscillator" or "Price".
getPivotDetectionMode(context) Returns the 'Pivot Detection Mode' setting of The Divergent. The returned value can be either "Bodies" or "Wicks".
Parameters:
context : The context of The Divergent Library.
Returns: One of the following string values: "Bodies" or "Wicks".
isLinked(context) Returns a boolean value indicating the link status to The Divergent indicator.
Parameters:
context : The context of The Divergent Library.
Returns: A boolean value indicating the link status to The Divergent indicator.
init(firstBarSignal, displayLinkStatus, debug) Initialises The Divergent Library's context with the signal produced by The Divergent on the first bar. The value returned from this function is called the "context of The Divergent Library". Some of the other functions of this library requires you to pass in this context.
Parameters:
firstBarSignal : The signal from The Divergent indicator on the first bar.
displayLinkStatus : A boolean value indicating whether the Link Status window should be displayed in the bottom left corner of the chart. Defaults to true.
debug : A boolean value indicating whether the Link Status window should display debug information. Defaults to false.
Returns: A bool array containing the context of The Divergent Library.
processSignal(signal) Processes a signal from The Divergent and returns a 5-tuple with the decoded signal: [ int divergenceType, int priceBarIndexStart, int priceBarIndexEnd, int oscillatorBarIndexStart, int oscillatorBarIndexEnd]. `divergenceType` can be one of the following values: na → No divergence was detected, 1 → Regular Bullish, 2 → Regular Bullish early, 3 → Hidden Bullish, 4 → Hidden Bullish early, 5 → Regular Bearish, 6 → Regular Bearish early, 7 → Hidden Bearish, 8 → Hidden Bearish early.
Parameters:
signal : The signal from The Divergent indicator.
Returns: A 5-tuple with the following values: [ int divergenceType, int priceBarIndexStart, int priceBarIndexEnd, int oscillatorBarIndexStart, int oscillatorBarIndexEnd].

Favorite Signals w/EMA FilterThe script combines my favorite signals then filters them with three EMAs.
Via the Style tab, you can choose to either have the signals color the bar and/or plot a shape above/below.
All signals can be turned off via the Inputs tab, which will remove the bar color and/or shape (if not already off in the Style tab) as well as remove the pattern from the alerts function.
Remember when using TV alerts, if you change the script settngs, you must create a new alert if you wish to be alerted for the changes you've made.
LONG/SHORT SIGNALS INCLUDED FOR:
- TD8s
- TD9s
- Hammer
- Shooting Star
- Bullish Harami
- Bearish Harami
- RSI Divergences
EMA FILTER LOGIC LONGS:
- Price < Fast EMA & Med EMA > Slow EMA = Possible Long Entry
- Price > Fast EMA & Med EMA > Slow EMA = Possible Reversal, Tighten Stop or Reduce Position
EMA FILTER LOGIC SHORTS:
- Price > Fast EMA & Med EMA < Slow EMA = Possible Short Entry
- Price < Fast EMA & Med EMA < Slow EMA = Possible Reversal, Tighten Stop/Reduce Position
Big up to @spdoinkal, @HPotter, @LonesomeTheBlue, for writing the originals scripts for the signals above.
Enjoy!
RSI Overbought Oversold Divergence Strategy w/ Buy/Sell SignalsThis indicator is a copy of my RSI Overbought/Oversold Divergence Indicator with-Alerts
Only difference is that the alerts are disabled, instead it uses tradingviews strategy tester signals
If you want alerts just use the other indicator

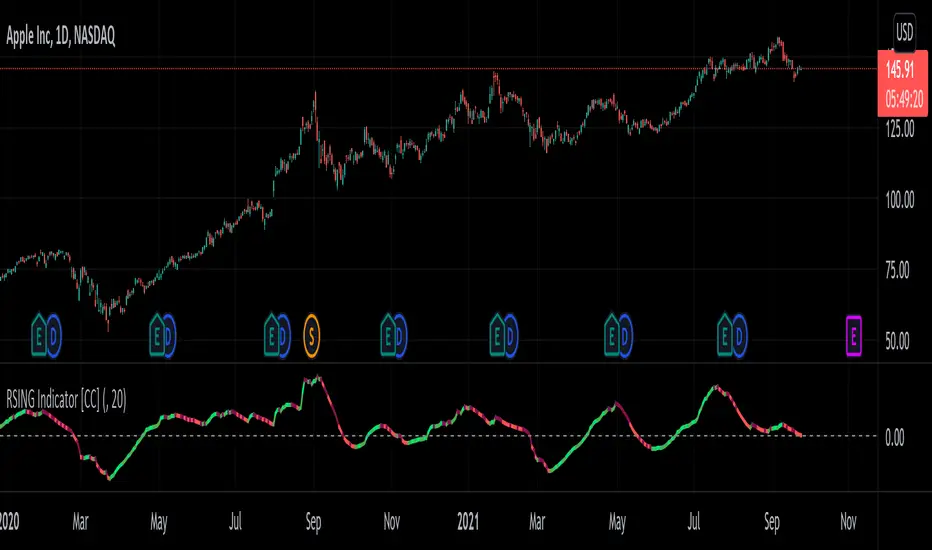
RSING Indicator [CC]The RSING indicator was created by Alon Horesh (Stocks & Commodities March 2021 pg 11) and this aims to be a better version of rsi that adapts to volume as well as a focus on overall strength. This is trying to fix the issues with the traditional RSI with a lack of volume and the issue where you could have the indicator stay in overbought or oversold territory but the upward or downward momentum continues. This indicator takes ratios of the current volume to it's moving average, the overall momentum of the stock, and the current range in comparison to the std deviation of it's past range and multiplies them all together to create this new indicator. I smooth it with a moving average for easier to read buy and sell signals. I have included strong buy and sell signals as darker colors and normal buy and sell signals as lighter colors. Buy when the line turns green and sell when it turns red.
Let me know if there are any other indicators you would like to see me publish!
RSI Signals by HBRELATIVE STRENGTH INDEX (RSI)
This is a tool that is widely used
Especially for Overbought and Oversold systems, but I have made some changes in this indicator,
How to use it...!
I have set it as the default setting
- RSI Length: 7
- Overbought: 70
- Oversold: 30
What is unique about this tool?
we can see 3 conditions:
1) RSI Overbought / Oversold with Bullish Engulfing / Bearish Engulfing
2) RSI Overbought / Oversold with Hammer and Shooting Star
3) RSI Overbought / Oversold with 2 Bullish Bars / 2 Bearish Bars
4) RSI Overbought / Oversold with All Patterns at the same time
When the RSI reaches its Oversold line, the code will wait for Bullish Engulfing pattren , when oversold and Bullish engulfing matched, This indicator will generate a buy signal when the condition is met,
and same as for Bear market, When the RSI reaches its Overbought line, the code will wait for Bearish Engulfing pattren , This indicator will generate a sell/exit signal when the condition is met,
2nd condition is that a Hammer candle will be waited for when RSI touches the Overbought line, for Bullish Move
and Shooting Star candle will be waited for when RSI touches the Overbought line, for Bullish Move, for Bearish Move
3rd Condition is also the same as Condition 1 and Condition 2,
When the RSI reaches its Oversold line, the code will wait for 2 Bullish Bars , when oversold and 2 Bullish Bars matched then this indicator will generate a buy signal, and same as for Bear market,
When the RSI reaches its Overbought line, the code will wait for 2 Bearish Bars , when overbought and 2 Bearish Bars matched then this indicator will generate a Sell signal,
4th Condition is that we can use All Conditions at the same time,
- Bullish Engulfing / Bearish Engulfing
- Hammer and Shooting Star
- 2 Bullish Bars / 2 Bearish Bars

RSI Div at Daily VWAP StDevMean Reversion indicator based on RSI Divergences at Overbought/Oversold conditions with Price above/below a Standard Deviation from Daily VWAP. Useful for intra-day trading.
Signal criteria:
1. RSI is at Overbought/Oversold
2. RSI Divergence present (not hidden)
3. RSI has not reached Neutral level (i.e. 50)
4. Price has crossed above/below a Standard Deviation from Daily VWAP
Config Options:
- RSI length (default:14)
- Divergence Lookback Period (default:14)
- RSI Oversold/Overbought tresholds (default: 70/30)
- RSI Reset Level (default: 55/45)
- Use VWAP Std Dev (default: yes)
- Standard Deviation from Daily VWAP (default: 1.51)
Use with discretion.

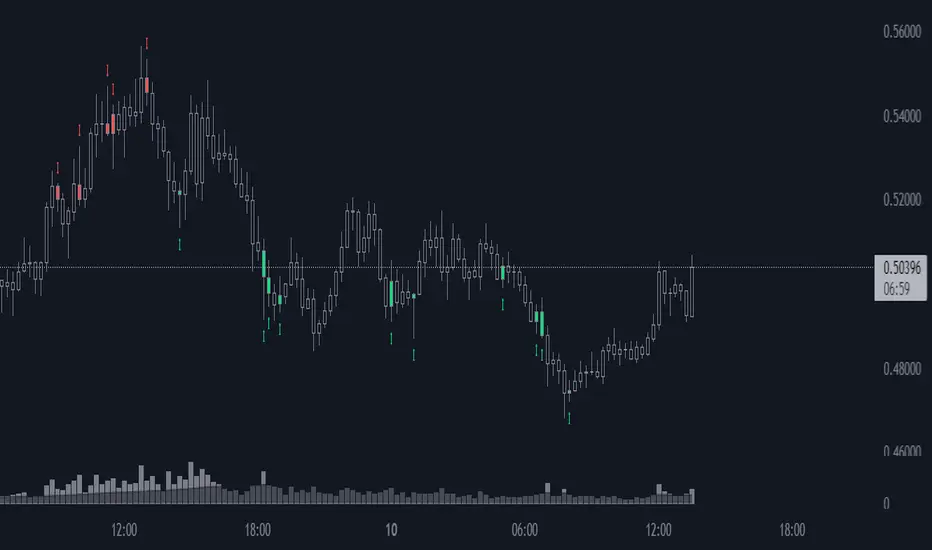
RSI Divergence 2.0RSI Divergence script will paint green or red lines depending on which way the asset is moving. The code is accessible and can be viewed. I have added alerts and the ability to change the source for slow and fast RSI values.
I have yielded better results using OHLC4 rather than the regular closing candles. As you can see it is working well with COINBASE:BTCUSD and works on all timeframes.
Best of luck!

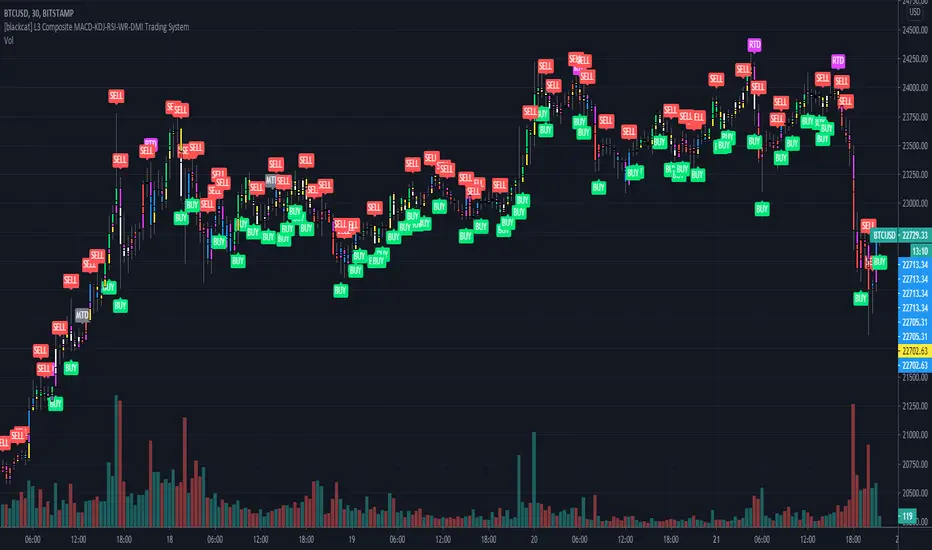
[blackcat] L3 Composite MACD-KDJ-RSI-WR-DMI Trading SystemLevel: 3
Background
The moving average convergence / divergence (MACD) indicator is a pulse oscillator that is mainly used to trade trends. Although it is an oscillator, it is not typically used to identify overbought or oversold conditions. It appears in the diagram as two lines that oscillate without limits. The crossing of the two lines provides trading signals similar to a system with two moving averages.
The KDJ indicator is a technical indicator used to analyze and predict changes in stock performance and the price patterns of a traded asset. The KDJ indicator is also known as the random index. It is a very useful technical indicator that is most commonly used in short term stock market trend analysis. KDJ is a derived form of the Stochastic Oscillator Indicator with the only difference that an additional line is called the J-line. Values of% K and% D indicate whether the security is overbought (over 80) or oversold (under 20). The moments when% K exceeds% D are the moments to sell or buy. The J line represents the deviation of the% D value from% K. The value of J can exceed for the% K and% D lines on the graph.
The Relative Strength Index (RSI) developed by J. Welles Wilder is a pulse oscillator that measures the speed and change of price movements. The RSI hovers between zero and 100. Traditionally, the RSI is considered overbought when it is above 70 and oversold when below 30. Signals can be generated by looking for divergences and error fluctuations.
Williams% R, also known as the Williams Percent Range, is a type of momentum indicator that moves between 0 and -100 and measures overbought and oversold levels. The Williams% R can be used to find entry and exit points in the market. The indicator is very similar to the stochastic oscillator and is used in the same way.
The Directional Movement Index (DMI) is an indicator developed by J. Welles Wilder in 1978 to determine in which direction asset prices are moving. The indicator does this by comparing previous highs and lows and drawing two lines: a positive movement line (+DI) and a negative movement line (-DI). The optional third line is called "Directional Movement (DX)" and it shows the difference between the two lines. When +DI is higher than -DI, the upward pressure on the price is greater than the downward pressure. If -DI is higher than +DI, the price will have greater downward pressure. This indicator can help traders assess the trend direction. Crosses between lines are sometimes used as buying and selling signals.
Function
L3 Composite MACD-KDJ-RSI-WR-DMI Trading System is a simple trading system composed of MACD-KDJ-RSI-WR-DMI together. It can produce 6 types of long entries and 3 types of short entries. It utilizes divergence effect from MACD, KDJ and RSI to detect trend reversal. 6 types of Bottom and top divergence labels are displayed in the chart together with "BUY" and "SELL".
NOTE:In order to make the actual label of the chart more clear, this script does not add stop loss and take profit functions and according labels.
Signal
b1~b3 ---> MACD, KDJ, RSI bottom divergence signal respectively, which hint bull trend may start soon.
d1~d3 ---> MACD, KDJ, RSI top divergence signal respectively, which hint bear trend may start soon.
longentry1~6 ---> with composite indicators together, 6 types of long entry signal are produced.
shortentry1~3 ---> with composite indicators together, 3 types of short entry signal are produced.
Pros and Cons
Pros:
1. excellent open-close, long-short entry signal generation with multiple powerful indicators
2. indicator resonance can help to promote the confidence level of signal and divergence alerts
Cons:
1. integration of multiple indicators is not deeply optimized. fake signal may be produced without filtering schemes
2. no range filter is added
Remarks
To celebrate number of followers exceeds 100. This is my first L3 script published.
Readme
In real life, I am a prolific inventor. I have successfully applied for more than 60 international and regional patents in the past 12 years. But in the past two years or so, I have tried to transfer my creativity to the development of trading strategies. Tradingview is the ideal platform for me. I am selecting and contributing some of the hundreds of scripts to publish in Tradingview community. Welcome everyone to interact with me to discuss these interesting pine scripts.
The scripts posted are categorized into 5 levels according to my efforts or manhours put into these works.
Level 1 : interesting script snippets or distinctive improvement from classic indicators or strategy. Level 1 scripts can usually appear in more complex indicators as a function module or element.
Level 2 : composite indicator/strategy. By selecting or combining several independent or dependent functions or sub indicators in proper way, the composite script exhibits a resonance phenomenon which can filter out noise or fake trading signal to enhance trading confidence level.
Level 3 : comprehensive indicator/strategy. They are simple trading systems based on my strategies. They are commonly containing several or all of entry signal, close signal, stop loss, take profit, re-entry, risk management, and position sizing techniques. Even some interesting fundamental and mass psychological aspects are incorporated.
Level 4 : script snippets or functions that do not disclose source code. Interesting element that can reveal market laws and work as raw material for indicators and strategies. If you find Level 1~2 scripts are helpful, Level 4 is a private version that took me far more efforts to develop.
Level 5 : indicator/strategy that do not disclose source code. private version of Level 3 script with my accumulated script processing skills or a large number of custom functions. I had a private function library built in past two years. Level 5 scripts use many of them to achieve private trading strategy.
RSI with Self-Adjusting Linear Regression Bands (Expo)RSI with Self-Adjusting Linear Regression Bands (Expo) makes use of RSI and Linear Regression to create an RSI that follows the current trend. The indicator has an upper and lower self-adjusting Linear Regression Band that act as RSI boundaries.
HOW TO USE
The indicator can be used in multiple ways, for instance, to find overbought and oversold areas. Or to identify trends as well as pullbacks in trends.
INDICATOR IN ACTION
This indicator is a modification of RafaelZioni's work "Linear Regression Trend bands"
Credit to: RafaelZioni
I hope you find this indicator useful , and please comment or contact me if you like the script or have any questions/suggestions for future improvements. Thanks!
I will continually work on this indicator, so please share your experience and feedback as it will enable me to make even better improvements. Thanks to everyone that has already contacted me regarding my scripts. Your feedback is valuable for future developments!
-----------------
Disclaimer
Copyright by Zeiierman.
The information contained in my scripts/indicators/ideas does not constitute financial advice or a solicitation to buy or sell any securities of any type. I will not accept liability for any loss or damage, including without limitation any loss of profit, which may arise directly or indirectly from the use of or reliance on such information.
All investments involve risk, and the past performance of a security, industry, sector, market, financial product, trading strategy, or individual’s trading does not guarantee future results or returns. Investors are fully responsible for any investment decisions they make. Such decisions should be based solely on an evaluation of their financial circumstances, investment objectives, risk tolerance, and liquidity needs.
My scripts/indicators/ideas are only for educational purposes!

Multi Oscillator Divergence IndicatorTradingview Built-in Divergence Indicator with RSI is extended for Price Divergence with
- RSI
- MACD
- Sochastic
- Money Flow
- Demand Index
- Chaikin Money Flow
Thanks to tradingview for providing this unique indicator.

Stoch+RSI With Color Combination. Hello Everyone This Indicater Base on (RSI and Stoch) COMBINATION With Color Combination.
You Can also use for
1-Divergence.
2-Overbought.
3-Oversold.
4-Breakout.
5-Support & Resistance Zones.

VWAP Relative Strength Index [CC]This is a custom indicator of mine that uses the volume weighted average price instead of the close price as the source for calculations of the relative strength index. Buy when the indicator line is green and sell when it is red.
This was a custom request so let me know if there are any other scripts you would like to see me do or if you want something custom done!

Double Smoothed Relative Strength IndexThe Double Smoothed RSI Indicator was created by William Blau (Stocks & Commodities V. 9:5 (202-205)) and is a variation of the classic RSI using his Momenta Indicator and his Momenta RSI formula. I have color coded everything to make it very easy to determine buy and sell signals.
Let me know if you would like to see me write scripts for other indicators!

Momenta Relative Strength IndexThe Momenta RSI Indicator was created by William Blau (Stocks & Commodities V. 9:5 (202-205)) and is a variation of the classic RSI using his Momenta Indicator formula. I have color coded everything to make it very easy to determine buy and sell signals.
Let me know if you would like to see me write scripts for other indicators!

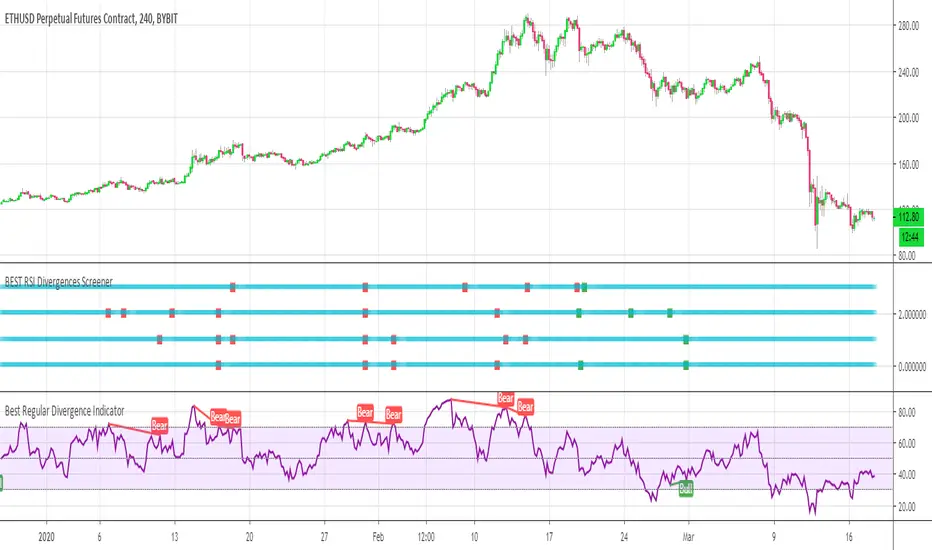
BEST RSI Divergences ScreenerHello traders
I hope you're all hanging on at home with what's going on these days...
The good news is.... it gives us more time to trade ^^.... #positive #attitude
I - Concept
This screener detects whether the regular RSI divergences based on the TradingView Divergence built-in indicator (made by the gentleman @everget I believe)
With this screener, you can see in 1 view which of your favorite cryptos/stocks/forex pairs/etc. showing strong divergences
The gentlemen (and demoiselles) traders can play with the lookback/ranges inputs to adjust the divergences based on what they think is best of their trading/timeframe/instrument/life
On that script screenshot, I'm showing the BYBIT:BTCUSD part of the screener matching with the divergences on the chart
II - How did I set the screener
The visual signals are as follow:
- square: whenever a divergence is detected
Then the colors are:
- green when there is bullish regular divergence
- red when there is bearish regular divergence
Best regards
Dave
RSI Divergence (Pine v4)Summary
Script highlights the divergences in RSI worth taking notice of. By comparing current envionment to relative sample we can see more than
the standard divergences that many catch through analysis. This framework aims to remove the bias or noise many see when looking for any supporting
evidence to their given emotion on a market.
Step-by-Step Walkthrough
Calculates RSI
Sets Divergence Framework
-------> a. Defining variable values, mandatory in Pine 4)
-------> b. Identify Divergences --> "If bar with lowest / highest is current bar, use it's value"
Compare high of current bar being examined with previous bar's high --> "If curr bar high is higher than the max bar high in the lookback window range"
Finds pivot point with at least 2 right candles with lower value
Finds pivot point with at least 2 right candles with lower value
Plot
Set Alerts
This RSI Script is intended for public use and can be shared / implemented as needed
Questions? I do not monitor my TradingView inbox. See email address in signature at the bottom of this page for contact information.

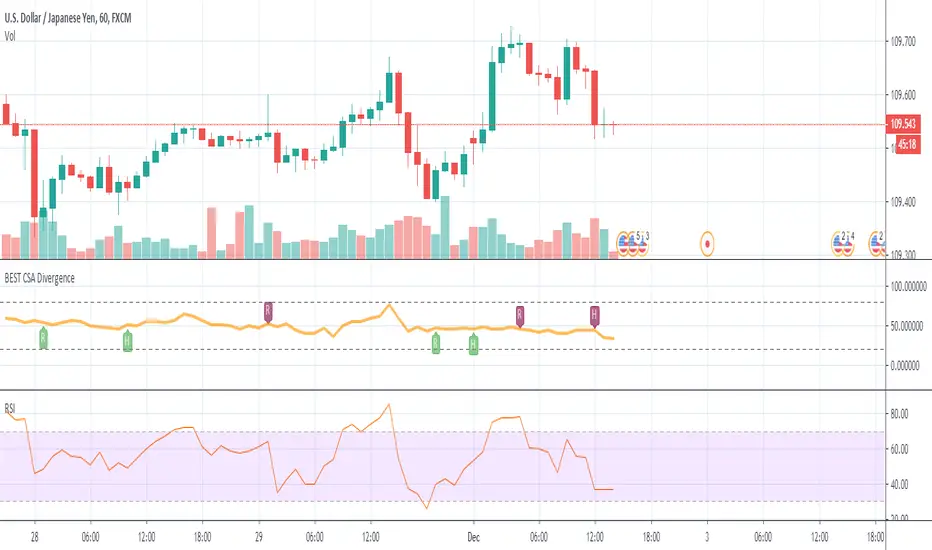
BEST Currency Strength Indicator DivergenceHello traders
Hope you had a great Thanksgiving
Now it's my turn to give and all I ask in return is you to be thankful (did I get the "Thanksgiving" thing right?)
The Currency Strength Indicator plots an average of the selected FX pairs in the indicator.
Someone asked me if I could develop an alternative of that script adding a divergence component.
The script evaluates the divergences between the average of the selected RSI(FOREX pairs) and the RSI(FOREX pair) displayed on the chart.
This version includes new features such as:
- the RSI length can now be selected
- we can select the 6 pairs used for the divergence calculations
All the BEST my aspiring traders and quants
See you tomorrow for another script
Dave
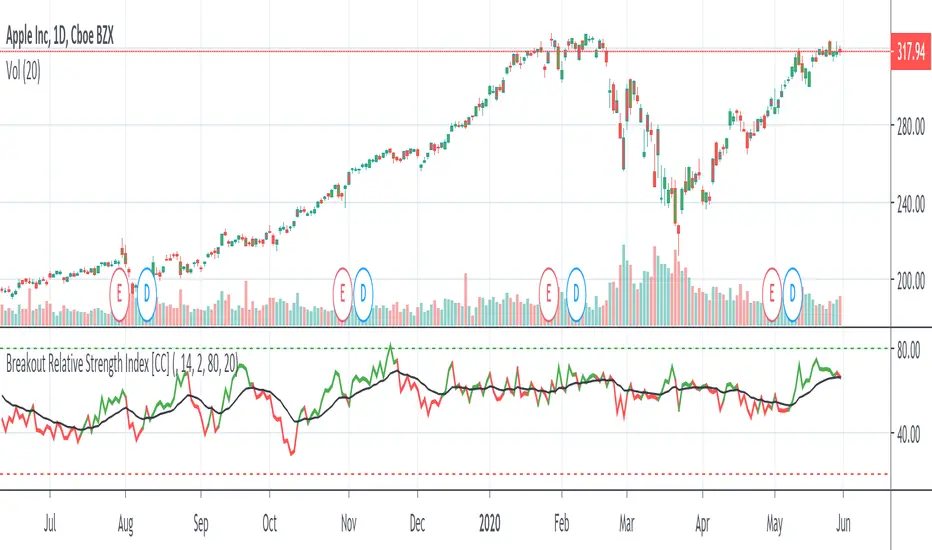
Breakout Relative Strength IndexIt isn't easy to determine if the price of a stock is about to break out. Here’s one way you can determine the relative strength of a breakout, enabling you to act early and realize higher profits.
This indicator was originally developed by Howard Wang Stocks & Commodities V. 33:09 (60–62)
MG - Real time RSI divergenceShows RSI divergences in real time (as soon as bar closes in divergence instead of waiting for an RSI pivot).
There are alerts included on these events so you are immediately made aware of divergence.
Adjustement:
It works by detecting a break of a previous high or low and then comparing the RSI value at the last break to the current break. Therefore, by decreasing the adjacent candles required for a pivot, you increase the number of divergence checks and therefore divergence readings. As with many indicators, with higher the values, you get less but more significant signals. (This can be visualized with the plot pivot lines option)
RSI period can be adjusted
