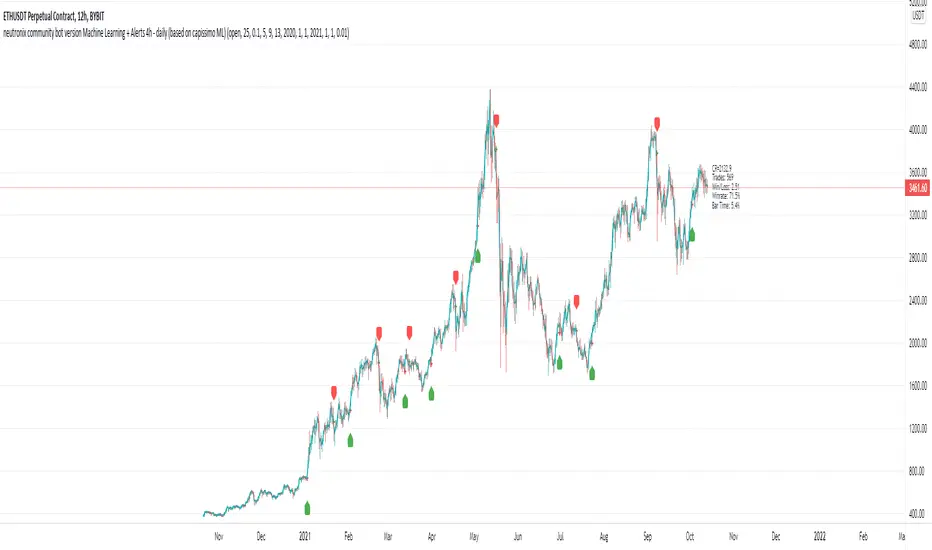
neutronix community bot ML + Alerts 4h-daily (mod. capissimo)Gm traders,
i have been a python programmer for some years studying artificial intelligence for general purpose; after some time i finally decided to have a look at some finance related stuff and scripts.
Moved by curiosity i've decided to make some but decisive modifications to a script i tried to use initially but without success: the LVQ machine learning strategy.
So after studying the charts and indicators, i have rewritten this script made by Capissimo and added heavy filtering thanks to vwap and vwma, then fixed repaint and other issues.
I hope you enjoy it and that it could increase your possibilities of success in trading.
HOW TO USE THE SCRIPT
Add the script to 3h+ charts like for example BTC 4h, 6h, 8h, 12h, daily. (In order for it to work on shorter timeframes charts you can try to change to lookback window but i dont advise it).
Change only rsi and volfilter(volume filtering) settings to try to find the best winrate. Leave dataset to open. Fyi the winrate isn't 100% accurate but can give you a raw vision of final results.
Use alerts included for trading and and in options click on 'Once per bar'. If you have checked 'Reverse Signals' in the control panel you have got more 'risky' signals so be advised if trading futures and stocks.
Exit trade signals not provided, so it is recommended the use of take profits and stop loss (1.5:1 ratio)
As always, the script is for study purposes. Do not risk more than you can spend!
Original LVQ-based strategy made by capissimo
Modified by gravisxv 13/10/2021
在腳本中搜尋"宁德时代2021年净利润+资产负债率"
CAGR Custom Range█ OVERVIEW
This script calculates an annualized Compound Annual Growth Rate from two points in time which you can select on the chart. It previews an upcoming feature where Pine scripts will be able to provide users with interactive inputs for time and price values.
👉🏼 We are looking for feedback on our first take of this feature.
Please comment in this publication's "Comments" section if you have suggestions for improvement.
█ HOW TO USE IT
When you first load this script on a chart, you will enter the new interactive selection mode. At that point, the script is waiting for you to pick two points in time on your chart by clicking on the chart. Once you select the two points, the script will find the close value for each of the two selected bars, and calculate the CAGR value from them. It will then display a line between the two points, and the CAGR value above or below the last point in time.
If the CAGR value is positive, the line and label will display in their "up" color (see the "🠅" color in the script's "Settings/Inputs" tab), otherwise they appear in their "down" color (the "🠇" color in the inputs). You can also control the line's width from the inputs.
You have the option of comparing the chart's CAGR value with that of another symbol, which you specify in the "Compare to" input. When a comparison is made, the label's background color will be dependent on the result of the comparison. The line's color will still be determined by the chart's value.
Once time points have been selected on the chart and the script is displaying the line, you can change the time points by clicking on the script's name on the chart. A small, blue rectangular handle will then appear for each point, which you can then grab and move. If you reset the inputs using the "Defaults/Reset Settings" button in the script's inputs, the two time points will reset to the beginning of September and October 2021, respectively.
█ CONCEPTS
The CAGR is a notional, annualized growth rate that assumes all profits are reinvested. It calculates from the close value of the two end points. It does not account for drawdowns, so it does not calculate risk. It can be used as a yardstick to compare the performance of two instruments. Because it annualizes values, the function requires a minimum of one day between the two end points (annualizing returns over smaller periods of times doesn't produce very meaningful figures).
█ LIMITATIONS
• The two selected points must be distant from a minimum of one day. A runtime error will occur otherwise.
• There is currently no way to restart the interactive mode from scratch without re-adding the script to the chart.
• The points in time you select on one chart may map quite differently on other charts,
depending on their constituent bars (e.g., intraday charts for 24x7 and conventional markets).
█ FOR PINE CODERS
• Our script uses the most recent version of Pine, as the `//@version=5` compiler directive indicates.
• Interactive inputs were a long-standing and highly-requested feature by our beloved community of Pine coders.
We hope you find this first step promising, as it opens up entirely new possibilities for both Pine coders and script users.
You can, for example, use interactive inputs to draw shapes with your scripts, or support and resistance levels, etc.
We're sure you'll come up with more creative uses of the feature than we could ever dream up )
• Interactive inputs are implemented for input.time() and input.price() , the specialized input functions now available in v5.
See the User Manual's new page on inputs for more information about them.
You can also create one interactive input for both time and price values
by using the same `inline` argument in a pair of input.time() and input.price() function calls.
• Our min/max filtering when initializing `entryTime` and `exitTime` will handle cases where
the script user inverts the two points on the chart.
• The script uses the new runtime.error() function to throw an error in the `if days < 1` conditional structure.
• We use the `cagr()` function from our recently-published ta Pine library .
Pine libraries — not to be confused with the Public Library showcasing scripts published by our community of Pine coders —
are one of the new features available with the recent Pine v5.
• Note that our `strRightOf()` function cannot be used to generate ticker identifier strings for use in `request.*()` functions.
This is because it produces results of "series" form while the functions require
arguments of "simple" form for their `symbol` or `ticker` parameters.
Have a look at our new User Manual page on Pine's Type system if you need to brush up on Pine forms and types.
• We use a simple, repainting request.security() call because our calculations are not used to generate orders or alerts.
• We document our user-defined functions using the same compiler directives used in exported functions in libraries.
It will make conversion of those functions to library format easier if we ever choose to do so.
• We use two Unicode hair spaces (U+200A) to push the "%" sign slightly away from values in our str.format() calls.
While the impact is minimal, it increases readability.
• Note the `priceIsHigh` logic used to determine if we place the label above or below bars.
When price is higher than recent prices, we place the label above the bar, otherwise we place it below.
It's not foolproof but it provides optimal positioning most of the time.
• The point of the complicated "bool" expression initializing `displayCAGR` is to ensure that we only draw the line and labels once.
When no comparison with another symbol is made, this occurs the first time we encounter a non- na value from the `cagr()` function.
When a comparison is required, it occurs the first time both values are not na .
• Before all mentions of "CAGR" in our description, we use a Unicode zero-width space (U+200B)
to prevent the auto-linking feature to kick in for the term.
This prevents the dashed underscore and a link like this (CAGR) from appearing every time "CAGR" is mentioned.
• With Pine v5, the `study()` declaration statement was renamed to indicator() .
Accordingly, we will be eliminating the use of the "study" term from documentation and the UI.
The generic "script" term will continue to designate Pine code that can be an indicator, a strategy or a library, when applicable.
• We followed our new Style guide recommendations to write our script.
• We used the techniques explained in the How We Write and Format Script Descriptions publication by PineCoders.
• That's it! We've covered all the new features and tricks we used. We sincerely hope you enjoy the new interactive inputs,
and please remember to comment here if you have suggestions for improvement. 💙
Look first. Then leap.

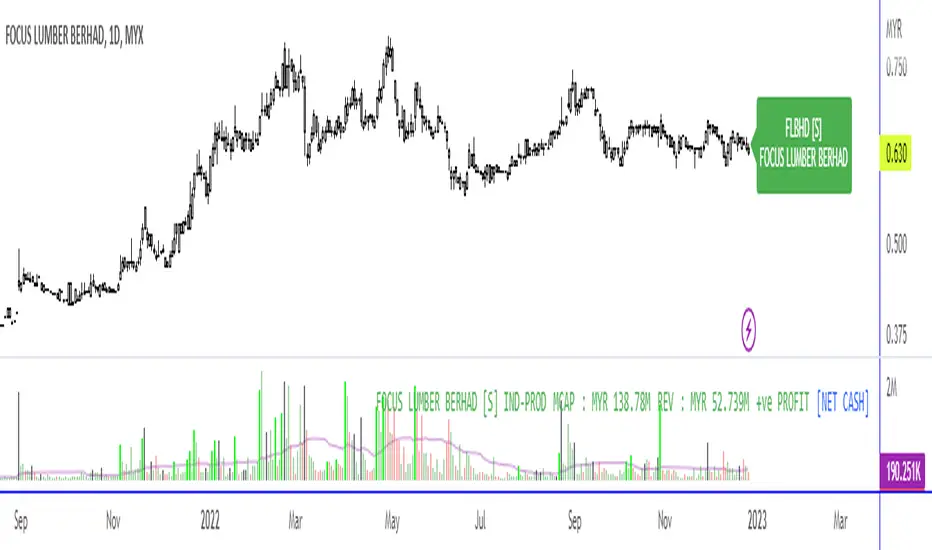
Bursa_SectorLibrary "Bursa_Sector"
: List of stocks classified by sector in Bursa Malaysia (As of Oct 2021)
getSector()
This function will get the sector of current stock that listed in Bursa Malaysia

bursamalaysianonshariahLibrary "bursamalaysianonshariah"
List of non-Shariah stock for Bursa Malaysia as of Oct 2021
No parameter required
status() will return 1 if ticker in the list, 0 if ticker not in the list and 2 if ticker not from Bursa Malaysia
Example usage :
//@version=5
indicator("My Script", overlay = true)
import BURSATRENDBANDCHART/bursamalaysianonshariah/1 as b
bgcolor(status() == 1 ? color.new(color.red, 90) : status() == 0 ? color.new(color.green, 90) : color.new(color.blue, 90))
Special thanks to
wmsafwan
RozaniGhani-RG
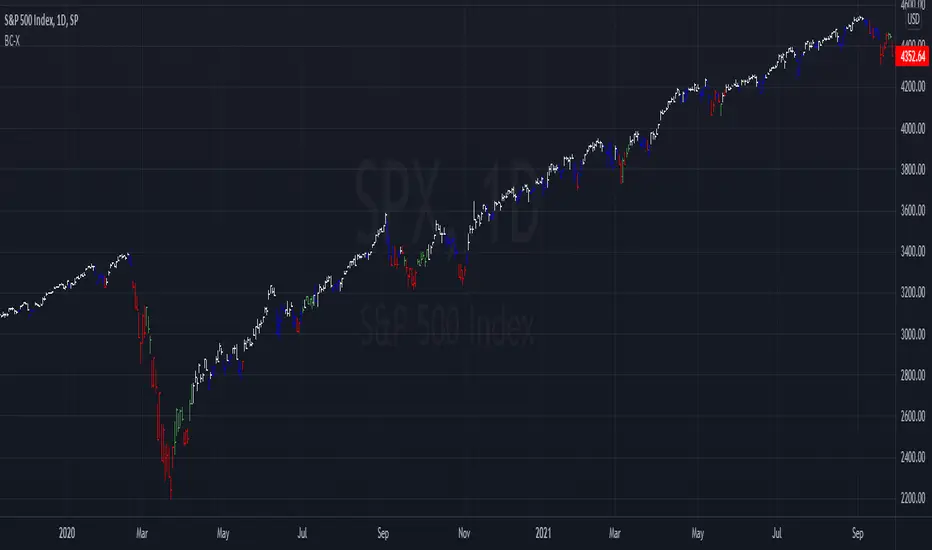
Barcolor X 2021-9-28This barcolor setting adds dimension to whether it's above or below where it was X bars ago by adding a longer term argument to filter out sideways price action. For example, the white price bars show when the price stayed above where it was five bars ago AND twenty bars ago. Adjust the lookback values to suit your needs. As usual, the settings I come up with work best when used on multiple time frames!
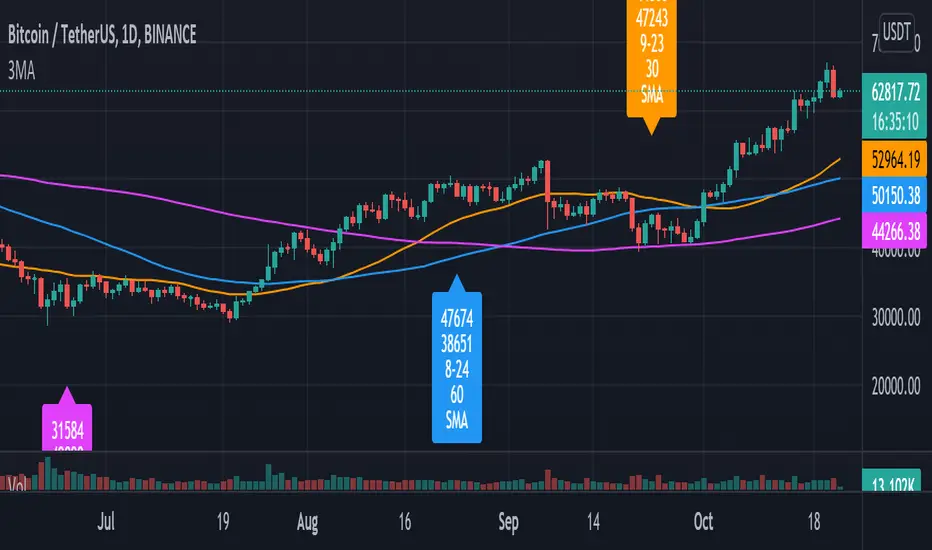
Pulu's 3 Moving Averages
Pulu's 3 Moving Averages
Release version 1, date 2021-09-28
This script allows you to customize three sets of moving averages, turn on/off, set color and parameters. It also tags the start date of the last set of moving average if there is. This, release version 1, supports eight moving average algorithms:
ALMA, Arnaud Legoux Moving Average
EMA, Exponential Moving Average
RMA, Adjusted exponential moving average (aka Wilder’s EMA)
SMA, Simple Moving Average
SWMA, Symmetrically-Weighted Moving Average
VWAP, Volume-Weighted Average Price
VWMA, Volume-Weighted Moving Average
WMA, Weighted Moving Average
The availability and function parameters
Func. Availability Parameters
ALMA
MA1, MA2, MA3
source
length
offset
sigma
EMA
RMA
SMA
VWMA
WMA
MA1, MA2, MA3
source
length
SWMA
VWAP
MA1
source
Parameters
Parameter Description
source the series of values to process. The default is to use the closing price to calculate the moving average.
length an integer value that defines the number of bars to calculate the moving average on. The SWMA and VWAP do not use this parameter.
ALMA offset a floating-point value that controls the tradeoff between smoothness (with a value closer to 1) and responsiveness (with a value closer to 0). This parameter is only used by ALMA.
ALMA sigma a floating-point value that specifies the ALMA’s smoothness. The larger this value, the smoother the moving average is. This parameter is only used by ALMA.
I'm not sure if it is needed, so I do not let the three Moving Averages of the script to have indivial algorithm setting. Because that will involve much complicated condition testing and use up more TradingView script lines limit. If you need to combine different algorithms in the three sets of moving averages, or have other ideas, leave a message to let me know; maybe I will try it in the next update.
我不確定是否需要,所以我沒有讓腳本的三組移動平均線有各別的算法設置。因為這將涉及更多複雜的條件測試,並使用更多 TradingView 腳本列數限制。如果您需要在三組均線中組合不同的算法,或者有其他想法,請留言告訴我;也許我會在下一次更新中嘗試。
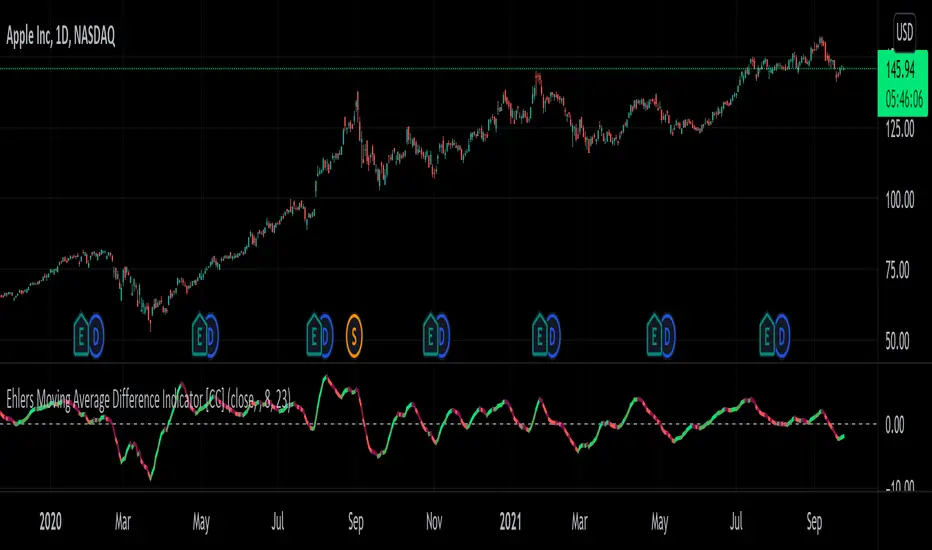
Ehlers Moving Average Difference Indicator [CC]The Moving Average Difference Indicator was created by John Ehlers (Stocks and Commodities Oct 2021 pg 23) and this is essentially his version of the famous MACD indicator. He calls this indicator the "thinking mans" MACD because his thought process for creating the lengths is based on half of the period of the dominant cycle. These are the default lengths that he created but feel free to test it out with your own variations and please let me know if you come up with a better one. I'm sorry for my long delay from TV. Sometimes I just need to step away and collect my thoughts before I burn myself out with the many scripts I keep publishing daily. I will try to get back into publishing daily again because I have a personal backlog of over 50 scripts ready to go that I haven't published yet. As always I have included strong buy and sell signals in addition to normal ones so darker colors are strong and lighter colors are normal. Buy when the line turns green and sell when it turns red.
Let me know if there are any other scripts you would like to see me publish!
Zendog Bar PercentageThis script will add text to bars showing the price change of the bar as a percentage, both for open/close and high/low.
It can be used together with Rate of Change to better get an idea of how the price moved at a previous point in time.
Script uses labels for text, as there is a maximum limit of 500 labels if you want to study price movement for a specific timeframe, you can limit the timeframe from the script settings. Keep in mind that labels are applied to the last 500 candles of any timeframe.
Script also displays statistics for max changes in the selected time period, for both green and red candles both as percentage and base currency absolute value.
Uses:
- Study the behavior of an asset under previous market conditions, black swan events a.s.o.
- Calculate leverage position risk versus extreme price movements
Example: ZENUSDT pumped ~35% on 15 Sep 2021 in the first seconds after the news on getting listed on Coinbase so shorts with 3x leverage would have been liquidated.

Saham Syariah Indonesia| The Most Liquid Sharia Stocks IndonesiaA simple indicator to show the most liquid Sharia stocks in the Indonesian market based on Index JII , JII70 , and IDX-MES BUMN 17
-----------------------------------------------------------------------------------------------------------------------------------------------
Stocks included in the index are shown in light green (lime),
while the rest will be red
Information based on Indonesia Stock Exchange - Major Evaluation August 2021
-----------------------------------------------------------------------------------------------------------------------------------------------

Gap RiderThis Indicator allows you to make statistics on the performance of any underlying on the days in which an opening gap occurs.
Specifically, the indicator was designed for "0 dte" options trades. In fact, it is possible to find parameters that give a good statistical advantage by opening a spread in the direction of the gap, creating a trade that has a risk-return ratio of 1: 1.
The indicator shows flags on the graph (green in case of gap up, red in case of gap down) and colored boxes (green in case the stock closed in the direction of the gap, red in case the stock closed in the opposite direction to the gap, yellow in the event that the stock closed at a distance that did not allow the spread in options to close in maximum loss or maximum profit, and therefore in breakeven)
The statistics panel, on the other hand, contains all the information necessary to search for parameters that give the trader a good statistical advantage.
In the settings you can filter the days of the week, only gap up or only gap down, ATR thresholds (volatility), points or minimum percentage for which a gap is taken into account, measure of the breakeven (which for options traders should represent the half the width of the spread to open), large gaps filter that takes into consideration only gaps that open out of range compared to the previous session. The Lookback parameter of course is used to set how many bars to take into account for the statistics.
Parameters and recommended strategy:
TODAY 31/08/2021 - Lookback 500 bars (2 years)
UNDERLYING: SPX
FILTERS: only Monday and Wednesday, only gap up, only gap> 0.01%
STRATEGY: exactly at opening, cover an ATM spread in the direction of the gap (example: gap up, I open a long call spread) that has the opening price as a break even, with a risk-return ratio of 1: 1 and leave it open until closing session, or set take profit at 90-95%. It is advisable to take into consideration the SPX statistics but to operate on the ES future so as to be able to open the spread a couple of minutes before the opening of the cash session and prevent the trade from "running away" due to too sudden movements of the opening. .
RESULTS:
124 Trade
70% profitable trades
30% losing trades
Max drawdown 3 trades
So assuming a spread on ES 10 points wide, each trade would gain or lose $ 250, applying the described strategy we would have in two years, investing only $ 250, a profit of $ 12500, with a max drawdown of $ 750. We would therefore have a profit of 5000%, or rather 2500% per year on the invested capital, with a drawdown of a much lower proportion of the profit ($ 750 compared to $ 6250 of annual profit).
The strategy is infinitely scalable by increasing the options contracts used and the impact of the commissions is almost zero.
MONEY MANAGEMENT: Example on a 50K account, with a spread that earns or loses $ 500, in two years it earns $ 25,000, therefore about 12500 per year, with a max drawdown of $ 1500, therefore 25% per year on the ENTIRE ACCOUNT with a maximum drawdown of 3%.
Note: the test was performed without a break even parameter, so the actual result will be more moderate, but of the same explosive nature.
** BUG STILL LOOKING FOR SOLUTION **
only in case the filters are set to take into account ONLY the gap down, the drawdown count in the statistics panel shows an incorrect result "

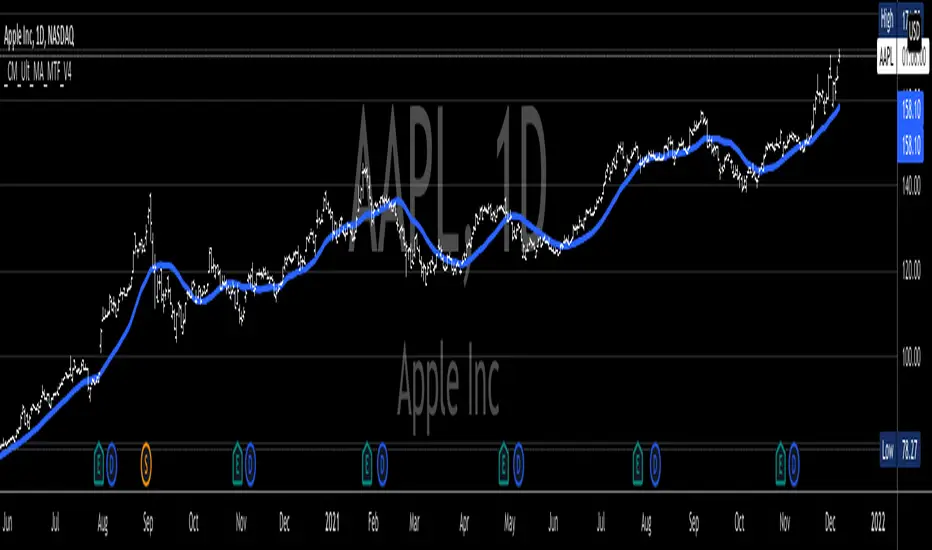
_CM_Ultimate_MA_MTF_V4***For a Detailed Video Overview Showing all of the Settings...
Click HERE to View Video
New _CM_Ultimate_MA_MTF_V4 - Update - 08-24-2021
Thanks to @SKTennis for help with code
Added Ability to Plot 1 or 2 Moving Averages - Fast MA & Slow MA
Added Ability to Plot Fast MA with Multi TimeFrame
Added Ability to Plot Slow MA with Multi TimeFrame
Added Ability to Color Fast MA Based on Slope of MA
Added Ability to Color Fast MA based on being Above/Below Slow MA
Added Ability to Plot 8 Types of Moving Averages
Simple, Exponential, Weighted, Hull, VWMA, RMA, TEMA, & Tilson T3
Added Ability to Set Alerts Based on:
Slope Change in the Fast MA Or Fast MA Crossing Above/Below Slow MA.
Added Ability to Plot "Fill" if Both Moving Averages are Turned ON
Added Ability to control Transparency of Fill
Added Alerts to Settings Pane.
Customized how Alerts work. Must keep Checked in Settings Pane, and When you go to Alerts Panel, Change Symbol to Indicator (_CM_Ultimate_MA_MTF_V4)
Customized Alerts to Show Symbol, TimeFrame, Closing Price, & Moving Average Signal Name in Alert
Alerts are Pre-Set to only Alert on Bar Close
See Video for Detailed Overview
New Updates Coming Soon!!!
***Please Post Feedback and Any Feature Requests in the Comments Section Below***
Ehlers Simple Window Indicator [CC]The Simple Window Indicator was created by John Ehlers (Stocks and Commodities Sep 2021) and this is the last of the 4 new indicators that he published in the latest issue of Stocks & Commodities. Since these are all part of a series, the idea behind each indicator is the exact same. The only difference is of course the calculation for each indicator. This script is different mostly because it is extremely noisy in comparison so I had to smooth it twice to provide clear buy and sell signals. Window functions are used in digital signal processing to filter out noise and the end result is an oscillator that centers around the 0 line. The easy way to understand these indicators that I will be publishing and those are that when they are above 0, it usually means an uptrend and below 0 then a downtrend. For more immediate signals, I have included both normal and strong buy and sell signals so darker colors for strong signals and lighter colors for normal signals. Buy when the line turns green and sell when it turns red.
Let me know if there are any other indicators you would like me to publish!

PI_GRM Bitcoin Golden Ratio Multipier [wozdux]Golden Ratio Multiplier
Formula GRM=MA350(BTC USD) * (1.6;2;3;5;8;13;21)
The multiplier examines medium-and long-term time cycles.
For this, a multiple of 350 MA is used to determine the areas of potential resistance.
Additionally, fibo levels from the main line.
version 2021 year modification

Ehlers Triangle Window Indicator [CC]The Triangle Window Indicator was created by John Ehlers (Stocks and Commodities Sep 2021) and this is one of 4 new indicators that he published in the latest issue of Stocks & Commodities and I will be publishing the last one tomorrow. Since these are all part of a series, the idea behind each indicator is the exact same. The only difference is of course the calculation for each indicator. Window functions are used in digital signal processing to filter out noise and the end result is an oscillator that centers around the 0 line. The easy way to understand these indicators that I will be publishing and those are that when they are above 0, it usually means an uptrend and below 0 then a downtrend. For more immediate signals, I have included both normal and strong buy and sell signals so darker colors for strong signals and lighter colors for normal signals. Buy when the line turns green and sell when it turns red.
Let me know if there are any other indicators you would like me to publish!

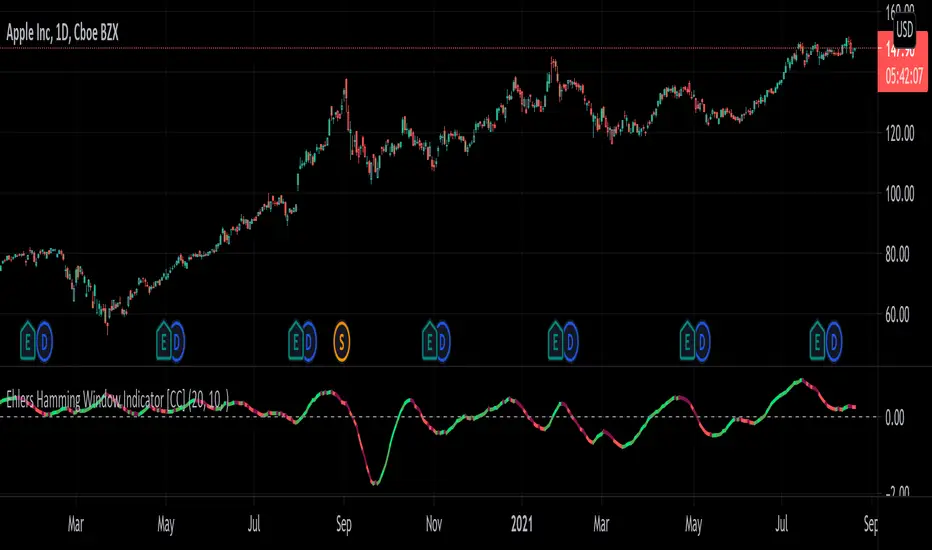
Ehlers Hamming Window Indicator [CC]The Hamming Window Indicator was created by John Ehlers (Stocks and Commodities Sep 2021) and this is one of 4 new indicators that he published in the latest issue of Stocks & Commodities and I will be publishing the other 2 in the next few days. Since these are all part of a series, the idea behind each indicator is the exact same. The only difference is of course the calculation for each indicator. Window functions are used in digital signal processing to filter out noise and the end result is an oscillator that centers around the 0 line. The easy way to understand these indicators that I will be publishing and those are that when they are above 0, it usually means an uptrend and below 0 then a downtrend. For more immediate signals, I have included both normal and strong buy and sell signals so darker colors for strong signals and lighter colors for normal signals. Buy when the line turns green and sell when it turns red.
Let me know if there are any other indicators you would like me to publish!
Ehlers Hann Window Indicator [CC]The Hann Window Indicator was created by John Ehlers (Stocks & Commodities Sep 2021) and this is one of 4 new indicators that he published in the latest issue of Stocks & Commodities and I will be publishing the other 3 in the next few days. Since these are all part of a series, the idea behind each indicator is the exact same. The only difference is of course the calculation for each indicator. Window functions are used in digital signal processing to filter out noise and the end result is an oscillator that centers around the 0 line. The easy way to understand these indicators that I will be publishing and those are that when they are above 0, it usually means an uptrend and below 0 then a downtrend. For more immediate signals, I have included both normal and strong buy and sell signals so darker colors for strong signals and lighter colors for normal signals. Buy when the line turns green and sell when it turns red.
Let me know if there are any other indicators you would like me to publish!

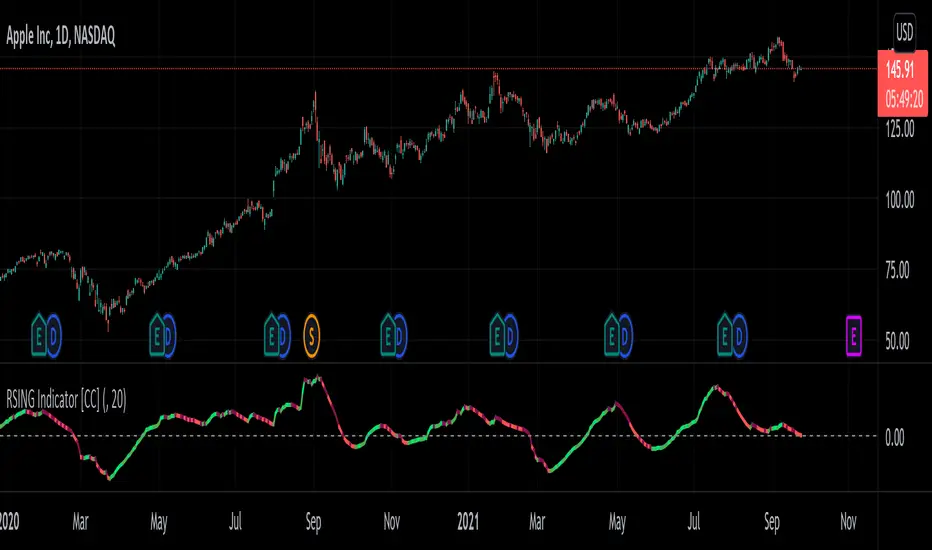
RSING Indicator [CC]The RSING indicator was created by Alon Horesh (Stocks & Commodities March 2021 pg 11) and this aims to be a better version of rsi that adapts to volume as well as a focus on overall strength. This is trying to fix the issues with the traditional RSI with a lack of volume and the issue where you could have the indicator stay in overbought or oversold territory but the upward or downward momentum continues. This indicator takes ratios of the current volume to it's moving average, the overall momentum of the stock, and the current range in comparison to the std deviation of it's past range and multiplies them all together to create this new indicator. I smooth it with a moving average for easier to read buy and sell signals. I have included strong buy and sell signals as darker colors and normal buy and sell signals as lighter colors. Buy when the line turns green and sell when it turns red.
Let me know if there are any other indicators you would like to see me publish!
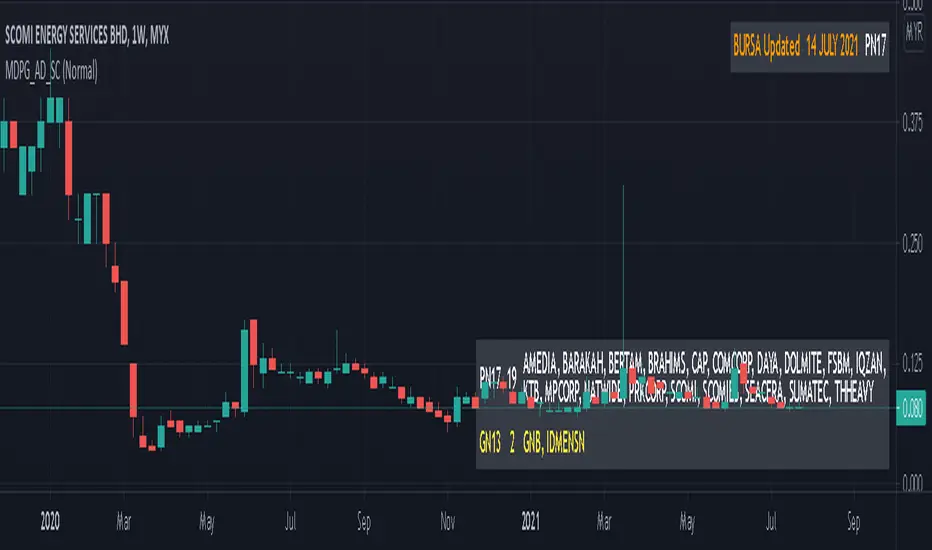
MYX Delisted PN17 GN13 Auto Detect (Source Code)This indicator intended for Malaysia Market only for auto detect delisted companies (PN17, GN13) refer to Bursa Malaysia
Indikator ini adalah untuk pasaran Malaysia sahaja untuk automatik mengenalpasti senarai syarikat terkeluar rujuk kepada Bursa Malaysia
Indicator features :
1. Able to detect stock and warrant.
2. List similar symbol or counter including total.
3. Font size small for mobile app and font size normal for desktop.
4. Show date updated by Bursa Malaysia.
Kemampuan indikator :
1. Boleh mengenal pasti saham dan waran.
2. Senarai simbol atau kaunter yang terlibat termasuk jumlah.
3. Saiz font kecil untuk mobile app dan saiz size normal untuk desktop.
4. Memaparkan tarikh kemaskini oleh Bursa Malaysia.
Date Updated / Tarikh Kemaskini : 14/7/2021
FAQ
1. Credits / Kredit
LucF & PineCoders
2. Code Usage / Penggunaan Kod
Free to use for personal usage but credits are most welcomed.
Not for business / comercial usage, any damage or lialibity are not my resposibility.
Bebas untuk kegunaan peribadi tetapi kredit adalah amat dialu-alukan.
Bukan untuk kegunaan perniagaan / komersil, sebarang kerosakan atau liability adalah di luar tanggungjawab saya.
3. Update Frequency / Frekuensi
Anytime after official update by Bursa Malaysia.
Bila-bila masa selepas kemaskini rasmi oleh Bursa Malaysia
4. Symbol/Counter not showing / Simbol/kaunter tiada
Symbol/counter not longer exist or not yet updated.
Simbol/kaunter telah tersenarai keluar atau belum dikemaskini.
Single layout with font size normal
Satu layout dengan saiz font normal
Double layout with small font size (Left : Stock, Right : Warrant)
Dua layout dengan font saiz normal (Kiri : Saham, Kanan : Waran)
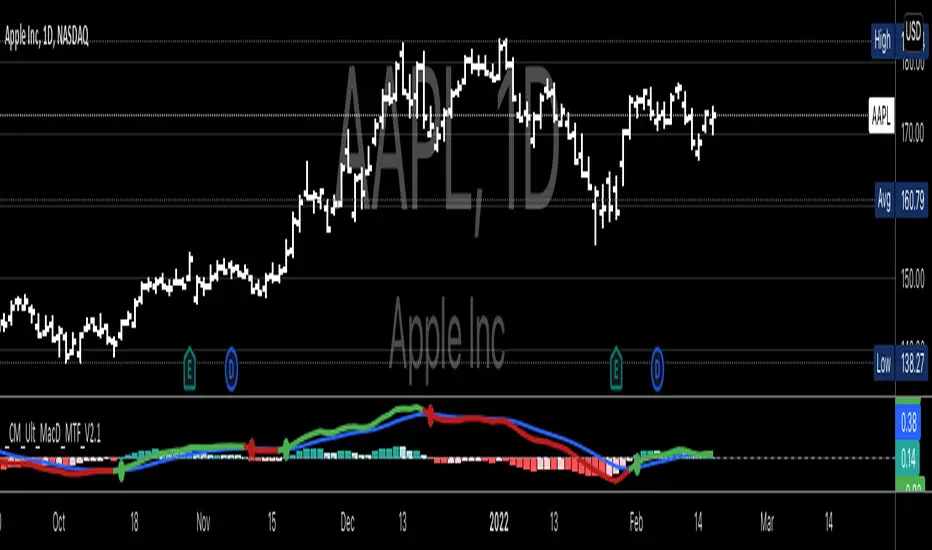
CM MACD Custom Indicator - Multiple Time Frame - V2***For a Detailed Video Overview Showing all of the Settings...
Click HERE to View Video
New _CM_MacD_Ult_MTF _V2 Update 07-28-2021
Thanks to @SKTennis for help in Updating code to V2
Added Groups to Settings Pane.
Added Color Plots to Settings Pane
Switched MTF Logic to turn ON/OFF automatically w/ TradingView's Built in Feature
Updated Color Transparency plots to work in future update
Added Ability to Turn ON/OFF Show MacD & Signal Line
Added Ability to Turn ON/OFF Show Histogram
Added Ability to Change MACD Line Colors Based on Trend
Added Ability to Highlight Price Bars Based on Trend
Added Alerts to Settings Pane.
Customized how Alerts work. Must keep Checked in Settings Pane, and When you go to Alerts Panel, Change Symbol to Indicator (CM_Ult_MacD_MTF_V2)
Customized Alerts to Show Symbol, TimeFrame, Closing Price, MACD Crosses Up & MACD Crosses Down Signals in Alert
Alerts are Pre-Set to only Alert on Bar Close
See Video for Detailed Overview
New Updates Coming Soon!!!
***Please Post Feedback and Any Feature Requests in the Comments Section Below***
Financial Astrology Vesta LongitudeVesta is one of the largest objects in the asteroid belt between Mars and Jupiter, the orbit duration is 3.63 years and seems to be very relevant celestial object in financial astrology. The experienced financial astrologer "Bill Meridian" indicates that this asteroid rules the security business, and paper securities such as bonds and stocks. We have confirmed through statistical research that adding this asteroid to astrology machine learning models provides an increase in daily trend predictions accuracy for crypto-currencies sector.
Our statistical analysis of Vesta zodiac sign location concluded that when is transiting the signs of Aries, Gemini, Cancer, Leo and Libra the daily trend is 59% or more of the days bullish. When Vesta is located at Capricorn is very bearish with 60% of the daily trend going in downward direction. In the other zodiac signs the daily trend was neutral showing most of the time a sideways pattern.
Is very interesting to note that the exact date July 21, 2021, when Vesta entered in Libra BTCUSD started the last bullish wave that finally broke the congestion zone of the 30K-35K and started a new bullish optimism. Pay attention on what happened in the previous cycle when Vesta was located in Libra and do your conclusions.
Note: Vesta longitude indicator is based on an ephemeris array that covers years 2010 to 2030, prior or after this years the data is not available, this daily ephemeris are based on UTC time so in order to align properly with the price bars times you should set UTC as your chart timezone.

Moving Average Band Width [CC]The Moving Average Band Width was created by Vitali Apirine (Stocks and Commodities Aug 2021 pg 25) and this is of course an extension based on my previous Moving Average Bands script. For those of you that aren't aware, the Band Width indicator is an indicator that tells you how close the upper and lower bands are to each other which is a great determination of how volatility is increasing or decreasing. This acts as both a trend indicator and a volatility indicator. I have included strong buy and sell signals in addition to normal ones so stronger signals are darker in color and normal ones are lighter. A great buy signal is when you are in an uptrend (so the line is green already) and the indicator line is moving up which means strong underlying volatility.
Let me know if there are any other indicators or scripts you would like to see me publish!

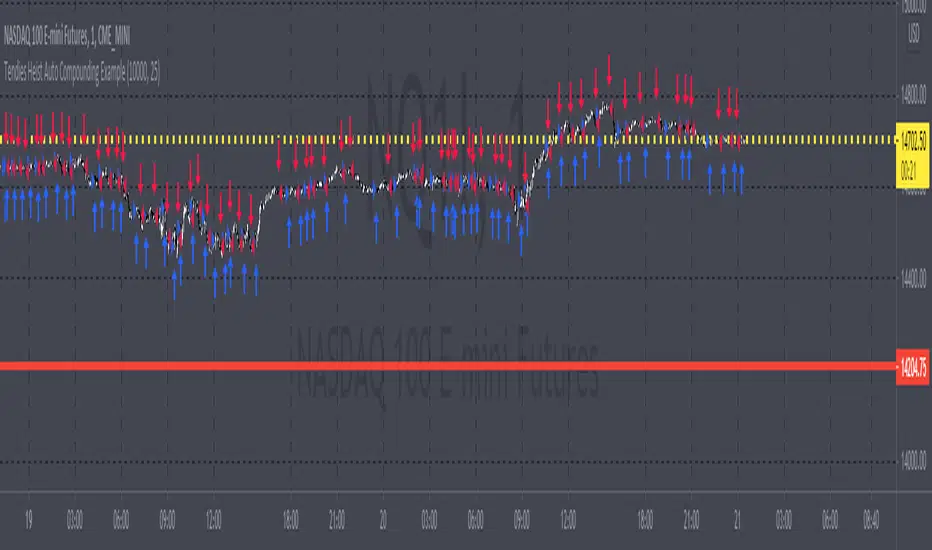
Tendies Heist Auto Compounding ExampleThis is an example of how we can use compounding to control our position size. This example shows how we can automatically add and reduce position size based on account equity. The "initial capital" in properties is the starting account equity. At default its set to 100,000. If our max position size is set to 25 then the very first position that's taken has a position size of 10, IF our leverage is set to 10,000. Account equity divided by leverage equals position size. So in that example 100,000 divided by 10,000 in leverage gives us a max position size of 10. However the max position size was set to 25 meaning we would need 250k in equity for it to open a position size of 25 with the leverage set at 10k. Now if the initial capital was set to 100,000 and the max position size was set to 5 and leverage remained at 10,000, all though 100,000 divided by 10,000 equals 10 it will ONLY open a position size of 5, because the max position size in this example was set at 5. Since this works for strategies you may look through the trade log on the posted back test and check out the position size, you can see in this back test the default 100k is used for the initial capital and the default 10k was used for the leverage. You will be able to see as this logic loses money it takes contracts away and as it gains money it adds contracts. I'm using trading view's basic strategy logic example to provide an example of how the compounding logic works.
Note, don't forget to add the syntax below to your strategy.entry call for this logic to work.
qty = size
Tendies Heist LLC 2021
KINSKI Volume Regression TrendRegression trends are typically used to determine when a price is unusually far from its baseline. The script calculates the linear regression of volume and price to determine the trend direction and strength. This can be used to determine the volume support for upward/downward trends.
As a special feature, this indicator allows you to choose from three (as of 07/20/2021) templates with special presets.
The following templates are available:
"Precise" (Period: 4, Smoothing Factor Type: "DISABLED", Smoothing Factor Length = 1).
"Smooth" (Period: 4, Smoothing Factor Type: "RMA", Smoothing Factor Length = 2)
"Long Term (Period: 20, Smoothing Factor Type: "DISABLED", Smoothing Factor Length = 1)
In the selection for templates, the option "DISABLED" can also be selected. Then the user-defined settings selectable under it take effect. There are the following setting options.
"Length": Adjustable period
"Smoothing Factor: Type": Type of moving average
"Smoothing Factor: Length": Adjustable period
Other setting options are:
Color codes: The color codes are explained in the settings
Display types: "Columns", "Histogram", "Area", "Line", "Stepline"
