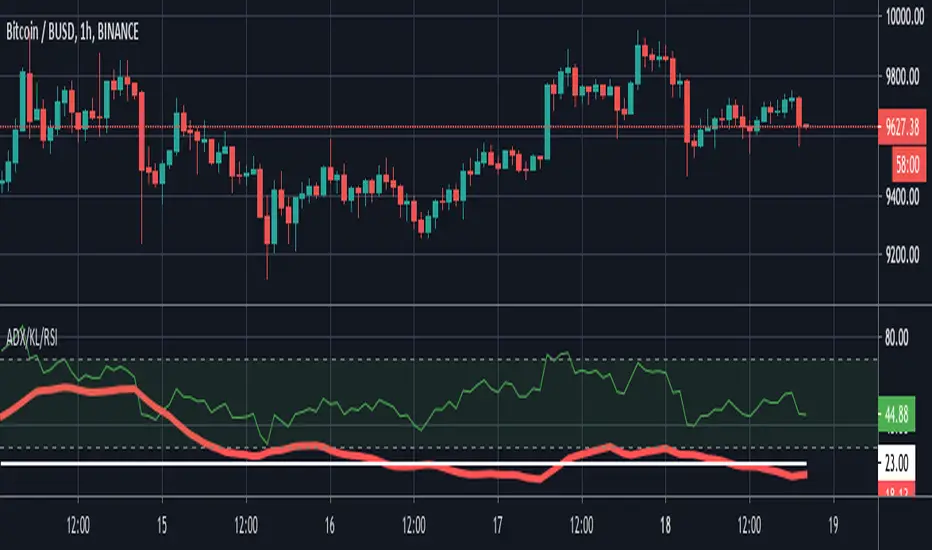
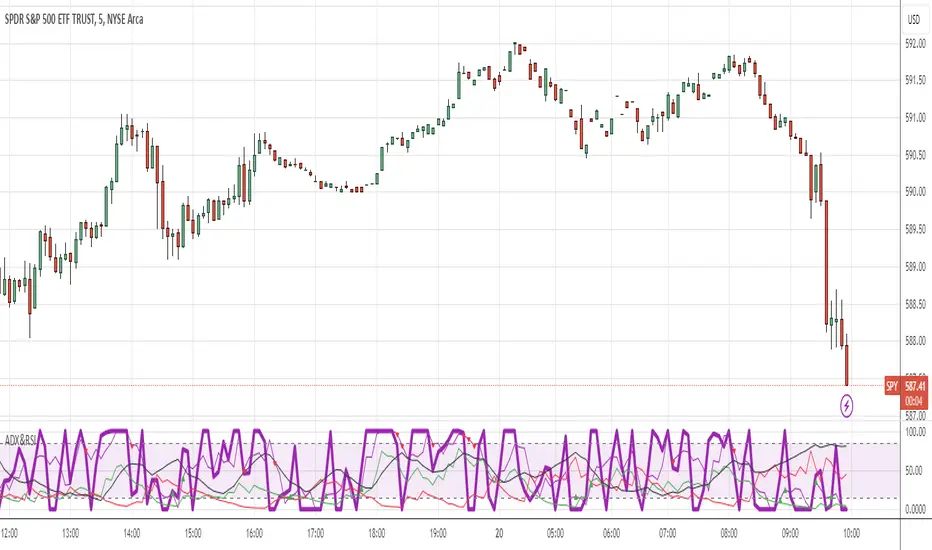
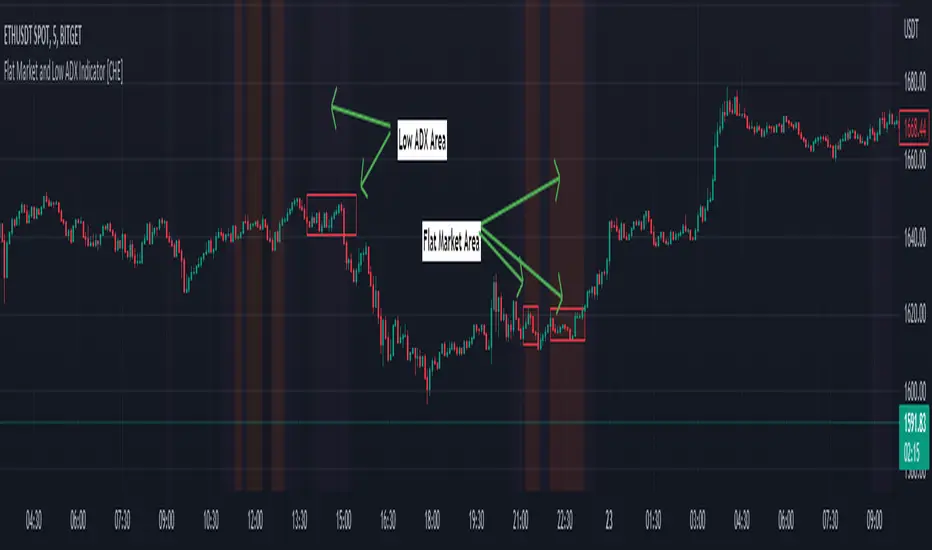
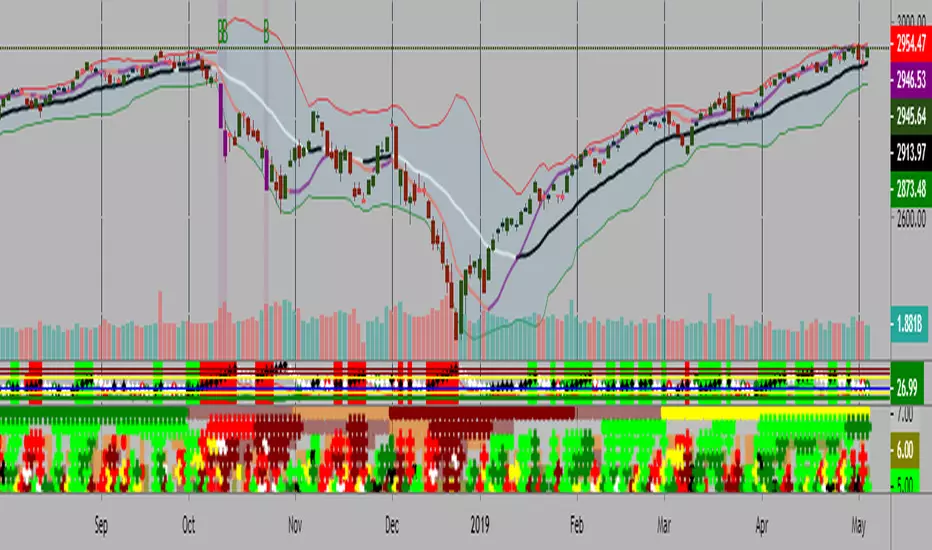
在腳本中搜尋"adx"
ADX coded with DIAn easier to read implementation of ADX and DI, with colour indicating direction of trend, oscillator indicating strength of trend, and below threshold shown with a lack of colour (black).
ADX and RSI ComboThis indicator combines two separate Simple RSI indicators so you can show different periods together, as well as an ADX indicator with DI+ and DI-. I prefer to use one indicator to show the whole thing, instead of stacking the individual indicators.
Bollinger Band and ADX Retrace Alert v0.1 by JustUncleLThis script is an implementation of a well known Bollinger band + ADX retracement strategy for 1min to 15min charts. This variation uses my own settings, a market direction filter and has an alert that can be added to your trading alarms.
Rob Booker - ADX Breakout updated to pinescript V5Rob Booker - ADX Breakout. The strategy remains unchanged but the code has been updated to pinescript V5. This enables compatibility with all new Tradingview features. Additonally, indicators have been made more easily visible, default cash settings as well as input descriptions have been added.
Rob Booker - ADX Breakout: (Directly taken from the official Tradingview V1 version of the script)
Definition
Rob Booker’s Average Directional Index (ADX) Breakout is a trend strength indicator that affirms the belief that trading in the direction of a trend and continuing to follow its pull is more profitable for traders, while simultaneously reducing risk.
History
ADX was traditionally used and developed to determine a price’s trend strength. It is commonly known as a tool from the arsenal of Rob Booker, experienced entrepreneur and currency trader.
Calculations
Calculations for the ADX Breakout indicator are based on a moving average of price range expansion over a specific period of time. By default, the setting rests at 14 bars, this however is not mandatory, as other periods are routinely used for analysis as well.
Takeaways
The ADX line is used to measure and determine the strength of a trend, and so the direction of this line and its interpretation are crucial in a trader’s analysis. As the ADX line rises, a trend increases in strength and price moves in the trend’s direction. Similarly, if the ADX line is falling, a trend decreases in strength and price then enters a period of consolidation, or retracement.
Traditionally, the ADX is plotted on the chart as a single line that consists of values that range from 0-100. The line is non-directional, meaning that it always measures trend strength regardless of the position of a price’s trend (up or down). Essentially, ADX quantifies trend strength by presenting in both uptrends and downtrends of the line.
What to look for
The values associated with the ADX line help traders determine the most profitable trades and where risk lies in the current trend. It is important to know how to quantify trend strength and distinguish between the varying values in order to understand the differences in trending vs. non-trending conditions. Let’s take a look at ADX values and what they mean for trend strength.
ADX Value:
0-25: Signifies an absent of weak trend
25-50: Signifies a strong trend
50-75: Signifies a very strong trend
75-100: Signifies an extremely strong trend
To delve into this a bit further, let’s assess the meaning of ADX if it is valued below 25. If the ADX line remains below 25 for more than 30 or so bars, price then enters range conditions, making price patterns more distinguishable and visible to traders. Price will move up and down between resistance and support in order to determine selling and buying interest and may then eventually break out into a trend or pattern.
The way in which ADX peaks, ebs, and flows is also a signifier of its overall pattern and trend momentum. The line can clearly indicate to the trader when trend strength is strong versus when it is weak. When ADX peaks are pictured as higher, it points towards an increase in trend momentum. If ADX peaks are pictured as lower - you guessed it - it points towards a decrease in trend momentum. A trend of lower ADX peaks could be a warning for traders to watch prices and manage and assess risk before a trade gets out of hand. Similarly, whenever there is a sudden move that seems out of place or a change in trend character that goes against what you’ve seen before, this should be a clear sign to watch prices and assess risk.
Summary
The ADX Breakout indicator is a trend strength indicator that analyzes price movements relative to trend strength to signal a user when is best for a trade and when is best to manage risk and assess patterns. As long as a trader recognizes strong trends and assesses the risk of each trade properly, they should have no problem using this indicator and utilizing it to work in their favor. In addition, the ADX helps identify trending conditions, but while doing so, also aids traders in finding strong trends to trade. The indicator can even alert traders to specific changes in trend momentum, allowing them to be primed for risk management.
Dynamic ADX - [The Pine Guru]Dynamic ADX by The Pine Guru
What is the Dynamic ADX?
The Dynamic ADX is an indicator created using the regular ADX, Line, and additional ADX Moving Average. This MA allows the script to calculate the ADX differently to the original ADX, providing greater input and accessibility to the user. As the ADX is a volatility indicator, it is communicates to trend strength in the markets. The Dynamic ADX displays these trending Periods through user controlled visualizers like Fills, Background Color, and Bar Color.
How do I use the Dynamic ADX?
This indicator has 4 different "versions" or "conditions" in which it displays trend strength. These are achieved by checking and unchecking ADX, ADX MA and Line. Different combinations of these 3 inputs will result in a change of true condition that the script outputs.
Dynamic ADX Achieved by checking the ADX and ADX MA, results in an ADX similar to an MA Crossover, with the ADX being over the MA indicating a true or strong trend condition.
Regular ADX Achieved by Checking the ADX and Line. Results in the regular calculation of the ADX.
Mixture Achieved by Checking all three sections, which results in the calculation a normal ADX as well as the MA. Provides and extra condition or confluence into the ADX.
MA and Line Achieved by checking the ADX MA and Line. Results in a similar calculation to an original ADX but with a smoother MA.
Recommendations
This indicator will work typically in all markets with high volume and volatility. It is recommended that it is used as a confluence in a trading system, and not as an outright indicator. As always do your own testing before live use with this indicator. Do your own Research and refinements.
Please Leave a like if you enjoy this Indicator
Adv EMA Cloud v6 (ADX, Alerts)Summary:
This indicator provides a multi-faceted view of market trends using Exponential Moving Averages (EMAs) arranged in visually intuitive clouds, enhanced with an optional ADX-based range filter and configurable alerts for key market conditions. It aims to help traders quickly gauge trend alignment across short, medium, and long timeframes while filtering signals during potentially choppy market conditions.
Key Features:
Multiple EMAs: Displays 10-period (Fast), 20-period (Mid), and 50-period (Slow) EMAs.
Long-Term Trend Filter: Includes a 200-period EMA to provide context for the overall dominant trend direction.
Dual EMA Clouds:
Fast/Mid Cloud (10/20 EMA): Fills the area between the 10 and 20 EMAs. Defaults to Green when 10 > 20 (bullish short-term momentum) and Red when 10 < 20 (bearish short-term momentum).
Mid/Slow Cloud (20/50 EMA): Fills the area between the 20 and 50 EMAs. Defaults to Aqua when 20 > 50 (bullish mid-term trend) and Fuchsia when 20 < 50 (bearish mid-term trend).
Optional ADX Range Filter: Uses the Average Directional Index (ADX) to identify potentially non-trending or choppy markets. When enabled and ADX falls below a user-defined threshold, the EMA clouds will turn grey, visually warning that trend-following signals may be less reliable.
Configurable Alerts: Provides several built-in alert conditions using Pine Script's alertcondition function:
Confluence Condition: Triggers when a 10/20 EMA crossover occurs while both EMA clouds show alignment (both bullish/green/aqua or both bearish/red/fuchsia) and price respects the 200 EMA filter and the ADX filter indicates a trend (if filters are enabled).
MA Filter Cross: Triggers when price crosses above or below the 200 EMA filter line.
Full Alignment Start: Triggers on the first bar where full bullish or bearish alignment occurs (both clouds aligned + MA filter respected + ADX trending, if filters are enabled).
How It Works:
EMA Calculation: Standard Exponential Moving Averages are calculated for the 10, 20, 50, and 200 periods based on the closing price.
Cloud Creation: The fill() function visually shades the area between the 10 & 20 EMAs and the 20 & 50 EMAs.
Cloud Coloring: The color of each cloud is determined by the relationship between the two EMAs that define it (e.g., if EMA 10 is above EMA 20, the first cloud is bullish-colored).
ADX Filter Logic: The script calculates the ADX value. If the "Use ADX Trend Filter?" input is checked and the calculated ADX is below the specified "ADX Trend Threshold", the script considers the market potentially ranging.
ADX Visual Effect: During detected ranging periods (if the ADX filter is active), the plotCloud12Color and plotCloud23Color variables are assigned a neutral grey color instead of their normal bullish/bearish colors before being passed to the fill() function.
Alert Logic: Boolean variables track the specific conditions (crossovers, cloud alignment, filter positions, ADX state). The alertcondition() function creates triggerable alerts based on these pre-defined conditions.
Potential Interpretation (Not Financial Advice):
Trend Alignment: When both clouds share the same directional color (e.g., both bullish - Green & Aqua) and price is on the corresponding side of the 200 EMA filter, it may suggest a stronger, more aligned trend. Conversely, conflicting cloud colors may indicate indecision or transition.
Dynamic Support/Resistance: The EMA lines themselves (especially the 20, 50, and 200) can sometimes act as dynamic levels where price might react.
Range Warning: Greyed-out clouds (when ADX filter is enabled) serve as a visual warning that trend-based strategies might face increased difficulty or whipsaws.
Confluence Alerts: The specific confluence alerts signal moments where multiple conditions align (crossover + cloud agreement + filters), which some traders might view as higher-probability setups.
Customization:
All EMA lengths (10, 20, 50, 200) are adjustable via the Inputs menu.
The ADX length and threshold are configurable.
The MA Trend Filter and ADX Trend Filter can be independently enabled or disabled.
Disclaimer:
This indicator is provided for informational and educational purposes only. Trading financial markets involves significant risk. Past performance is not indicative of future results. Always conduct your own thorough analysis and consider your risk tolerance before making any trading decisions. This indicator should be used in conjunction with other analysis methods and tools. Do not trade based solely on the signals or visuals provided by this indicator.
Flat Market and Low ADX Indicator [CHE]Why use the Flat Market and Low ADX Indicator ?
Flat markets, where prices remain within a narrow range for an extended period, can be both critical and dangerous for traders. In a flat market, the price action becomes less predictable, and traders may struggle to find profitable trading opportunities. As a result, many traders may decide to take a break from the market until a clear trend emerges.
However, flat markets can also be dangerous for traders who continue to trade despite the lack of clear trends. In the absence of a clear direction, traders may be tempted to take larger risks or make impulsive trades in an attempt to capture small profits. Such behavior can quickly lead to significant losses, especially if the market suddenly breaks out of its flat range, causing traders to experience large drawdowns.
Therefore, it is essential to approach flat markets with caution and to have a clear trading plan that incorporates strategies for both trending and flat markets. Traders may also use technical indicators, such as the Flat Market and Low ADX Indicator, to help identify flat markets and determine when it is appropriate to enter or exit a position.
The confluence between flat markets and low ADX readings can further increase the risk of trading during these periods. The ADX (Average Directional Index) is a technical indicator used to measure the strength of a trend. A low ADX reading indicates that the market is in a consolidation phase, which can coincide with a flat market. When a flat market occurs during a period of low ADX, traders should be even more cautious, as there is little to no directional bias in the market. In this situation, traders may want to consider waiting for a clear trend to emerge or using range-bound trading strategies to avoid taking excessive risks.
Introduction:
Pine Script is a programming language used for developing custom technical analysis indicators and trading strategies in TradingView. This particular script is an indicator designed to identify flat markets and low ADX conditions. In this description, we will delve deeper into the functionality of this script and how it can be used to improve trading decisions.
Description:
The first input in the script is the length of the moving average used for calculating the center line. This moving average is used to define the high and low range of the market. The script then calculates the middle value of the range by taking the double exponential moving average (EMA) of the high, low, and close prices.
The script then determines whether the market is flat by comparing the middle value of the range with the high and low values. If the middle value is greater than the high value or less than the low value, the market is not flat. If the middle value is within the high and low range, the script considers the market to be flat. The script also uses RSI filter settings to further confirm if the market is flat or not. If the RSI value is between the RSI min and max values, then the market is considered flat. If the RSI value is outside this range, the market is not considered flat.
The script also calculates the ADX (Average Directional Index) to determine whether it's in a low area. ADX is a technical indicator used to measure the strength of a trend. The script uses the ADX filter settings to define the ADX threshold value. If the ADX value is below the threshold value, the script considers the market to be in a low ADX area.
The script provides various input options to customize the display settings, including the option to show the flat market and low ADX areas. Users can choose their preferred colors for the flat market and low ADX areas and adjust the transparency levels to suit their needs.
Conclusion:
In conclusion, this Pine Script indicator is designed to identify flat market and low ADX conditions, which can help traders make informed trading decisions. The script uses a range of inputs and calculations to determine the market direction, RSI filter, and ADX filter. By customizing the display settings, users can adjust the indicator to suit their preferences and improve their trading strategies. Overall, this script can be a valuable tool for traders looking to gain an edge in the markets.
Acknowledgments:
Thanks to the Pine Script™ v5 User Manual www.tradingview.com
Kal’s MTF ADX Rangoli RollerKaly MTF ADX Rangoli Roller is a method/study for finding trending stocks, indexes and cryptocurrencies using two different data periods (10, 5) of ADX Overlap over different time-frames (10m, 1H, 4H, 1D, 1W, 1M). In the study, I used 5-Period ADX for all mentioned time-frames. You may use 10-Period ADX for lower time-frames especially 10m and 1H.
Sample Image of the pinescript code(at the end of this post) in Tradingview looks as follows:
Note: Kal's MTF ADX Rangoli Roller is the lower Plot. The upper plot is KAL’s ADX Overlap Technical Study with MACD Filter( )
Description:
----------------
In the study plot, the lowest row is 10m, row above is 1H, row above is 4H, then 1D, then 1W and highest row is 1M
Lime(Bright Green) dot implies Trending Uptrend for that time-frame (first phase)
Green dot implies Trending Uptrend for that time-frame (second phase near exhaustion)
Red dot implies Trending Downward for that time-frame (first phase)
Maroon dot implies Trending Downward for that time-frame (second phase near exhaustion)
Lime cross implies Strong Trending Uptrend for that time-frame (first phase)
Green cross implies Strong Trending Uptrend for that time-frame (second phase near exhaustion)
Red cross implies Trending Strong Downward for that time-frame (first phase)
Maroon cross implies Trending Strong Downward for that time-frame (second phase near exhaustion)
Yellow is ‘Squeeze On’ setting. During the squeeze period, the ADX signals are almost always ineffective. One may wait and watch over during this time. Once the Squeeze is released (i.e. no longer yellow), the trend corresponds to the color of the dots and crosses.
Black is CRSI Overbought condition for that time-frame. It’s best to wait and research for possibility of trend reversal because
1. Profit-booking/trimming happens after CRSI Overbought condition.
2. Large Short-sellers may take huge positions during this time pushing the stock prices up.
White is CRSI Oversold condition for that time-frame. It’s best to wait and research for possibility of trend reversal because
1. Profit-booking/trimming happens after CRSI Oversold conditions.
2. Large buyers may take huge positions during this time pushing the stock prices down.
I am a disabled man. Therefore, I am not able to write in detail here today. More Details will follow as time permits. Please let me know if I am missing anything…
Legal Disclaimer: I published here so I get replies from fellow viewers to educate myself and for my daily expenses. Hence, if anyone uses this script for making their decisions, I am not responsible for any failures incurred.
Safe Trading!
Kal Gandikota
PS: If you found this script interesting and edifying please follow and upvote.
PS2: Please kindly donate for my daily expenses (atleast as you would on streets) at the following addresses:
BTC Wallet: 1NeDC1GvpFa49DFLuT1v28ohFjqtoWXNQ5
ETH Wallet: 0x35e557F39A998e7d35dD27c6720C3553e1c65053
NEO Wallet: AUdiNJDW7boeUyYYNhX86p2T8eWwuELSGr
PS3: For more information on ADX and CRSI, please 'Google' or search here yourself.
PS4: This study is intended for research in creating automated Python Trading Systems using Pandas( steemit.com ).
Screenshots of the pinescript code looks as follows:
10minute Screenshot of Kal's MTF ADX Rangoli Roller (Above)
1 Hour Screenshot of Kal's MTF ADX Rangoli Roller (Above)
4 Hour Screenshot of Kal's MTF ADX Rangoli Roller (Above)
1 Day Screenshot of Kal's MTF ADX Rangoli Roller (Above)
1 Week Screenshot of Kal's MTF ADX Rangoli Roller (Above)
1 Month Screenshot of Kal's MTF ADX Rangoli Roller (Above)
ADX and DI - Trader FelipeADX and DI - Trader Felipe
This indicator combines the Average Directional Index (ADX) and the Directional Indicators (DI+ and DI-) to help traders assess market trends and their strength. It is designed to provide a clear view of whether the market is in a trending phase (either bullish or bearish) and helps identify potential entry and exit points.
What is ADX and DI?
DI+ (Green Line):
DI+ measures the strength of upward (bullish) price movements. When DI+ is above DI-, it signals that the market is experiencing upward momentum.
DI- (Red Line):
DI- measures the strength of downward (bearish) price movements. When DI- is above DI+, it suggests that the market is in a bearish phase, with downward momentum.
ADX (Blue Line):
ADX quantifies the strength of the trend, irrespective of whether it is bullish or bearish. The higher the ADX, the stronger the trend:
ADX > 20: Indicates a trending market (either up or down).
ADX < 20: Indicates a weak or sideways market with no clear trend.
Threshold Line (Gray Line):
This horizontal line, typically set at 20, represents the threshold for identifying whether the market is trending or not. If ADX is above 20, the market is considered to be in a trend. If ADX is below 20, it suggests that the market is not trending and is likely in a consolidation phase.
Summary of How to Use the Indicator:
Trend Confirmation: Use ADX > 20 to confirm a trending market. If ADX is below 20, avoid trading.
Long Entry: Enter a long position when DI+ > DI- and ADX > 20.
Short Entry: Enter a short position when DI- > DI+ and ADX > 20.
Avoid Sideways Markets: Do not trade when ADX is below 20. Look for other strategies for consolidation phases.
Exit Strategy: Exit the trade if ADX starts to decline or if the DI lines cross in the opposite direction.
Combine with Other Indicators: Use additional indicators like RSI, moving averages, or support/resistance to filter and confirm signals.
Adaptive Fusion ADX VortexIntroduction
The Adaptive Fusion ADX DI Vortex Indicator is a powerful tool designed to help traders identify trend strength and potential trend reversals in the market. This indicator uses a combination of technical analysis (TA) and mathematical concepts to provide accurate and reliable signals.
Features
The Adaptive Fusion ADX DI Vortex Indicator has several features that make it a powerful tool for traders. The Fusion Mode combines the Vortex Indicator and the ADX DI indicator to provide a more accurate picture of the market. The Hurst Exponent Filter helps to filter out choppy markets (inspired by balipour). Additionally, the indicator can be customized with various inputs and settings to suit individual trading strategies.
Signals
The enterLong signal is generated when the algorithm detects that it's a good time to buy a stock or other asset. This signal is based on certain conditions such as the values of technical indicators like ADX, Vortex, and Fusion. For example, if the ADX value is above a certain threshold and there is a crossover between the plus and minus lines of the ADX indicator, then the algorithm will generate an enterLong signal.
Similarly, the enterShort signal is generated when the algorithm detects that it's a good time to sell a stock or other asset. This signal is also based on certain conditions such as the values of technical indicators like ADX, Vortex, and Fusion. For example, if the ADX value is above a certain threshold and there is a crossunder between the plus and minus lines of the ADX indicator, then the algorithm will generate an enterShort signal.
The exitLong and exitShort signals are generated when the algorithm detects that it's a good time to close a long or short position, respectively. These signals are also based on certain conditions such as the values of technical indicators like ADX, Vortex, and Fusion. For example, if the ADX value crosses above a certain threshold or there is a crossover between the minus and plus lines of the ADX indicator, then the algorithm will generate an exitLong signal.
Usage
Traders can use this indicator in a variety of ways, depending on their trading strategy and style. Short-term traders may use it to identify short-term trends and potential trade opportunities, while long-term traders may use it to identify long-term trends and potential investment opportunities. The indicator can also be used to confirm other technical indicators or trading signals. Personally, I prefer to use it for short-term trades.
Strengths
One of the strengths of the Adaptive Fusion ADX DI Vortex Indicator is its accuracy and reliability. The indicator uses a combination of TA and mathematical concepts to provide accurate and reliable signals, helping traders make informed trading decisions. It is also versatile and can be used in a variety of trading strategies.
Weaknesses
While this indicator has many strengths, it also has some weaknesses. One of the weaknesses is that it can generate false signals in choppy or sideways markets. Additionally, the indicator may lag behind the market, making it less effective in fast-moving markets. That's a reason why I included the Hurst Exponent Filter and special smoothing.
Concepts
The Adaptive ADX DI Vortex Indicator with Fusion Mode and Hurst Filter is based on several key concepts. The Average Directional Index (ADX) is used to measure trend strength, while the Vortex Indicator is used to identify trend reversals. The Hurst Exponent is used to filter out noise and provide a more accurate picture of the market.
In conclusion, the Adaptive Fusion ADX DI Vortex Indicator is a versatile and powerful tool for traders. By combining technical analysis and mathematical concepts, this indicator provides accurate and reliable signals for identifying trend strength and potential trend reversals. While it has some weaknesses, its many strengths and features make it a valuable addition to any trader's toolbox.
---
Credits to:
▪️@cheatcountry – Hann Window Smoohing
▪️@loxx – VHF and T3
▪️@balipour – Hurst Exponent Filter
MM SIGMA STC+ADXThe Schaff Trend Cycle (STC) is a charting indicator that is commonly used to identify market trends and provide buy and sell signals to traders. Developed in 1999 by noted currency trader Doug Schaff, STC is a type of oscillator and is based on the assumption that, regardless of time frame, currency trends accelerate and decelerate in cyclical patterns.12
How STC Works
Many traders are familiar with the moving average convergence/divergence (MACD) charting tool, which is an indicator that is used to forecast price action and is notorious for lagging due to its slow responsive signal line . By contrast, STC’s signal line enables it to detect trends sooner. In fact, it typically identifies up and downtrends long before MACD indicator.
While STC is computed using the same exponential moving averages as MACD, it adds a novel cycle component to improve accuracy and reliability. While MACD is simply computed using a series of moving average, the cycle aspect of STC is based on time (e.g., number of days).
It should also be noted that, although STC was developed primarily for fast currency markets, it may be effectively employed across all markets, just like MACD. It can be applied to intraday charts, such as five minutes or one-hour charts, as well as daily, weekly, or monthly time frames.
Introduction to ADX
ADX is used to quantify trend strength. ADX calculations are based on a moving average of price range expansion over a given period of time. The default setting is 14 bars, although other time periods can be used.1 ADX can be used on any trading vehicle such as stocks, mutual funds, exchange-traded funds and futures.
ADX is plotted as a single line with values ranging from a low of zero to a high of 100. ADX is non-directional; it registers trend strength whether price is trending up or down.2 The indicator is usually plotted in the same window as the two directional movement indicator (DMI) lines, from which ADX is derived (shown below).Quantifying Trend Strength
ADX values help traders identify the strongest and most profitable trends to trade. The values are also important for distinguishing between trending and non-trending conditions. Many traders will use ADX readings above 25 to suggest that the trend is strong enough for trend-trading strategies. Conversely, when ADX is below 25, many will avoid trend-trading strategies.
ADX Value Trend Strength
0-25 Absent or Weak Trend
25-50 Strong Trend
50-75 Very Strong Trend
75-100 Extremely Strong Trend
Low ADX is usually a sign of accumulation or distribution. When ADX is below 25 for more than 30 bars, price enters range conditions, and price patterns are often easier to identify. Price then moves up and down between resistance and support to find selling and buying interest, respectively. From low ADX conditions, price will eventually break out into a trend. Below, the price moves from a low ADX price channel to an uptrend with strong ADX.
Added Buy/Sell alerts
ADX filters based on the threshold you put in the settings.
great for trend and trade confirmation
[SM-042] EMA 5-8-13 with ADX FilterWhat is the strategy?
The strategy combines three exponential moving averages (EMAs) — 5, 8, and 13 periods — with an optional ADX (Average Directional Index) filter. It is designed to enter long or short positions based on EMA crossovers and to exit positions when the price crosses a specific EMA. The ADX filter, if enabled, adds a condition that only allows trades when the ADX value is above a certain threshold, indicating trend strength.
Who is it for?
This strategy is for traders leveraging EMAs and trend strength indicators to make trade decisions. It can be used by anyone looking for a simple trend-following strategy, with the flexibility to adjust for trend strength using the ADX filter.
When is it used?
- **Long trades**: When the 5-period EMA crosses above the 8-period EMA, with an optional ADX condition (if enabled) that requires the ADX value to be above a specified threshold.
- **Short trades**: When the 5-period EMA crosses below the 8-period EMA, with the ADX filter again optional.
- **Exits**: The strategy exits a long position when the price falls below the 13-period EMA and exits a short position when the price rises above the 13-period EMA.
Where is it applied?
This strategy is applied on a chart with any asset on TradingView, with the EMAs and ADX plotted for visual reference. The strategy uses `strategy.entry` to open positions and `strategy.close` to close them based on the set conditions.
Why is it useful?
This strategy helps traders identify trending conditions and filter out potential false signals by using both EMAs (to capture short-term price movements) and the ADX (to confirm the strength of the trend). The ADX filter can be turned off if not desired, making the strategy flexible for both trending and range-bound markets.
How does it work?
- **EMA Crossover**: The strategy enters a long position when the 5-period EMA crosses above the 8-period EMA, and enters a short position when the 5-period EMA crosses below the 8-period EMA.
- **ADX Filter**: If enabled, the strategy checks whether the ADX value is above a set threshold (default is 20) before allowing a trade.
- **Exit Conditions**: Long positions are closed when the price falls below the 13-period EMA, and short positions are closed when the price rises above the 13-period EMA.
- **Plotting**: The strategy plots the three EMAs and the ADX value on the chart for visualization. It also displays a horizontal line at the ADX threshold.
This setup allows for clear decision-making based on the interaction between different time-frame EMAs and trend strength as indicated by ADX.
ADX Divergence and Gap Monitor [theUltimator5]ADX Divergence and Gap Monitor is a custom technical analysis tool designed to visualize momentum imbalances and sudden shifts in trend participation using the ADX system. It combines traditional ADX, DI+ and DI− calculations with dynamic filtering and visual highlighting to help identify key moments of directional acceleration or weakening.
🔍 What It Does:
This indicator builds on the Average Directional Index (ADX) system to detect conditions where market trend strength diverges significantly from directional input (DI) activity. It includes two major visual signals:
Highlight Backgrounds
These appear when the indicator detects a “gap” or sudden acceleration in DI values while ADX remains low, suggesting early-stage momentum bursts or signal noise spikes.
The trigger threshold for DI change can be adjusted using the Gap Trigger Level input.
A background highlight is shown when DI+ or DI− increases sharply, either from a low-ADX environment or from a rapid standalone spike.
GAP Markers
Optional yellow label markers display the word "GAP" just below the lowest line (ADX, DI+, or DI−) whenever a gap condition is triggered. These provide a more noticeable visual cue without crowding the chart.
You can enable or disable the markers with the Show GAP Markers toggle.
🧠 Advanced Divergence Detection:
The script also scans for dominant ADX divergence events, where ADX is significantly higher than DI+ or DI−, indicating strong trend force with weak directional participation. When these conditions are met:
Red or green background fills appear depending on whether DI+ or DI− is being overpowered.
These conditions are based on customizable moving averages and DI strength relationships.
⚙️ Key Inputs:
ADX Length: Period for ADX calculation
DI Moving Average: Smoothing length for directional index signals
Gap Trigger Level: Minimum DI change needed to trigger a GAP highlight
Show Highlight Backgrounds: Toggle to display or hide background signals
Show GAP Markers: Toggle to show or hide text-based GAP labels
🧪 Use Cases:
Spot early breakouts or reversals when DI activity spikes while ADX is still low
Identify periods of trend exhaustion or false breakouts using divergence logic
Confirm trade entry points when ADX begins to rise after a GAP event
jlmora ADX IndicatorThe ADX also informs us of the prevailing market trend through the positive / negative movement indicators. Being able to determine the existence of a trend in the market and its strength is fundamental, since not all indicators or systems work correctly in different types of markets.
1. Operate only from long positions when the positive directional line is above the negative. Trade only from short positions when the negative directional line is above the positive. The best time to trade is when the ADX is on the rise, showing that the dominant group is strengthening.
2. When the ADX falls, it shows that the market is becoming less discretionary. There are likely to be a few unexpected turns. When the ADX points down, it is preferable not to use trend tracking methods.
3. When the ADX falls below both directional lines, this identifies a flat and sleepy market. Do not use a trend tracking system, but be prepared to trade as major trends emerge from such calm periods.
4. The best individual directional signal is given after the ADX falls below both directional lines. The longer it stays there, the stronger the base of the next move will be. When the ADX rebounds from below both directional lines, it shows that the market is waking up from a calm period. When the ADX grows four or more steps (for example, 9 to 13) from its lowest point below both directional lines, it is "ringing the bell" on a new trend. It shows that a new bull or bear market is emerging, depending on which directional line is above it. When the ADX rebounds above both directional lines, it is identifying an overheated market. When the ADX crosses both directional lines down, it shows that a major trend has entered. It is a good time to collect benefits in a directional operation. If you trade from long positions, you will definitely want to pick up partial gains. Market indicators give strong signals and weak signals. For example, when a moving average changes direction, it is a strong signal. A downward inflection of the ADX is a weak signal. Once you see that the ADX has been turned down, you should be very careful adding to open positions. You should start to collect profits, reduce positions and try to exit.
[kai]ADXIt is an indicator that makes it easy to understand the change of ADX by adding a moving average to the famous indicator ADX.
Since ADX and DI have a part where the calculation formula of DI + and DI- is fixed to one bar, there was a problem that it does not make much sense to increase the length.
The biggest feature of this indicator is that it allows you to calculate multiple bars by increasing the multipler option.
For example, by setting multipler = 4 in the 1-hour time frame, it is possible to resemble the calculation result of the 4-hour bar in a multi-time frame.
How to use this Inge is the same as how to use ADX and DI
When ADX (orange) GX (blue circle), take a position in the direction of DI (green zone, red zone),
I think the payment is good when ADX (blue) is DX (orange circle)
when DI +(green), DI-(red) is 35 or more, contrarian is dangerous.
有名なインジケーターのADXに移動平均を付けてADXの変化をわかりやすくしたインジケーターです
ADXとDIはDI+,DI-の計算式がバー一本固定の部分があるので、lengthを増やしてもあまり意味がない問題がありました
このインジではmultiplerオプションを増やすことによって、複数のバーを計算できるようにしたのが最大の特徴になります
例えば1時間足でmultipler=4にすることでかなりマルチタイムフレームの4時間足の計算結果に似せることができます
このインジの使い方は、ADX、DIの使い方と同じです
ADX(オレンジ)がGX(青丸)した時にDI(緑塗り、赤塗り)の方向にポジションを取って、
ADX(青)がDX(オレンジ丸)した時に、決済がよいと思います
DI+(緑),DI-(赤)が35以上の時に逆張りは危険です
RiverFlow ADX ScreenerRiverFlow ADX Screener, Scans ADX and Donchian Trend values across various Timeframes. This screener provides support to the Riverflow indicator. Riverflow concept is based on Two indicators. Donchian Channel and ADX or DMI.
How to implement?
1.Donchian Channel with period 20
2. ADX / DMI 14,14 threshold 20
Entry / Exit:
1. Buy/Sell Signal from ADX Crossovers.
2. Trend Confirmation Donchian Channel.
3. Major Trend EMA 200
Buy/Sell:
After a buy/sell is generated by ADX Crossover, Check for Donchian Trend. it has to be in same direction as trend. for FTT trades take 2x limit. for Forex and Stocks take 1:1.5, SL must be placed below recent swing. One can use Riverflow indicator for better results.
ADX Indicator is plotted with
Plus: Green line
Minus: Red Line
ADX strength: plotted as Background area.
TREND: Trend is represented by Green and Red Area around Threshold line
Table:
red indicates down trend
green indicates up trend
grey indicates sideways
Weak ADX levels are treated sideways and a channel is plotted on ADX and PLUS and MINUS lines . NO TRADES are to be TAKEN on within the SIDEWAYS region.
Settings are not required as it purely works on Default settings. However Donchian Length can be changed from settings.
Timeframes below 1Day are screened. Riverflow strategy works on timeframe 5M and above timeframe. so option is not provided for lower timeframes.
Best suits for INTRADAY and LONG TERM Trading
Crypto Directional Movement Index DMI/ADXCrypto ADX + DMI
This indicator is a customised version of the ADX + DMI by J. Welles Wilder in 1978, with default settings optimal for cryptocurrencies.
What is the DMI (ADX) Indicator?
According to Investopedia:
DMI (ADX) consists of three indicators that measure a trend’s strength and direction. Three lines compose the Direction Movement Index (DMI): ADX (black line), DI+ (green line), and DI- (red line). The Average Directional Index (ADX) line shows the strength of the trend. The higher the ADX value, the stronger the trend. The color of the lines can be altered, but black, green, and red are the default in most software.
The Plus Direction Indicator (DI+) and Minus Direction Indicator (DI-) show the current price direction. When the DI+ is above DI-, the current price momentum is up. When the DI- is above DI+, the current price momentum is down.
This Version
The ADX default value has been changed to from 14 to 2 (optimal for cryptocurrencies). The background flashes red when the –DMI goes above the HZ1 threshold and green when the +DMI does the same. There is an option to change it so that it’ll only flash when the ADX and the DMI are both above the threshold. The ADX changes color when above HZ1.
Red and green plotshapes appear at DMI crossovers and three horizontal lines have also been added.
Any suggestions are most welcome
NSDT MA+ADXThis script combines Moving Averages with ADX Strength, but with an added bonus. Rather than having the Moving Average line always plot on the chart, it will reference the ADX strength based on the settings by the trader.
This way, the Moving Average will not show on the chart unless there is also a strong direction in the trend. This may potentially be used to help with entries when trend trading due to adding the ADX for trend strength.
In the examples below, the ADX settings in the MA+ADX indicator are matched with the settings of a standalone ADX indicator at the bottom of the chart (not included, just for reference).
MA+ADX
prnt.sc
ADX Only
prnt.sc
You will see how the MA only plots when the ADX is over the threshold, currently set at 25. (arrows drawn to indicate confluence)
Excellent ADXThe Average Directional movement indeX (ADX) is an indicator that helps you determine the trend direction, pivot points, and much more else! But it looks not so easy as other famous indicators. It seems strange or even terrible, but don't be afraid. Let's understand how it works and get its power into your analysis tactics.
In the beginning, imagine a drunk man goes through a ladder: step by step. Up, up, down, up, down, down, up...
How can we understand which direction he goes? Exactly! We can count the number of steps in each direction. In the above example, in the upward – 4, in the downward – 3. So, it looks like he goes in an upward direction.
The ADX indicator counts the same steps, but for price. The size of each step equals 1 ATR for "DI Length" candles. On the indicator chart, we have the green and red lines. The green line represents a number of steps upward. The red line shows one downward. When the red line upper green, then the price goes below, then the trend is directed down. Later the green line comes above the red one, and then the trend changes the direction to upward. Wow? After that, you can easy detect the trend direction on the market!
But it is still not the end. On the chart, we also have the fat blue line. This is the ADX line, and it represents the power of the trend. It is calculated from a distance between the green and red curves. The ADX line value grows if the distance is increased. If the movement is really powerful, then a number of steps into a direction much more prominent than one in an opposed direction. Then the blue line grows faster. But if the growth has stopped and the blue line turns back or already had changed self-direction, then it is a signal that the trend has ended too. It's an excellent sign to close the position (but not always). Easy? Not quite. Thresholds help you there. The indicator has two additional parameters: upper and lower thresholds to evaluate the trend-over signal strength. An u-turn of the ADX line above the upper threshold sends a strong signal. If one occurs between both thresholds, it is a bit weak signal. But if the blue line goes below the lower threshold, it looks like there is no trend, and the price goes side. We can also say that the price goes side when the ADX value gradually falls down.
The Excellent ADX indicator helps you catch pivot/pullback signals based on green, red, and blue lines. Each such signal is highlighted as a green (buy) or red (sell) dot on the plot. The size of the dot represents the strength of the signal. You can also check the position of green and red lines from each other to determine the trend direction and the place where it has been changed. The Excellent ADX indicator helps you there too. It highlights the trend direction by the background-color, so you'll never miss it! The Excellent ADX good compliance with the Price Channel indicator built for the same length. You can use them together to be on a trend wave always!
[ALERTS] ADX and DIThe average directional index (ADX) is a technical analysis metric. Analysts use it to determine the relative strength of a trend, with the direction of the trend either upwards or downwards.
The Average Directional Index (ADX) along with the Negative Directional Indicator (-DI) and the Positive Directional Indicator (+DI) are momentum strength indicators that evolved for use in stock trading. Commodities trader J. Welles Wilder pioneered their use. Technical traders who use charting techniques want to know when first spotting a shifting trend how strong that trend is and how likely it is to sustain itself over time. The ADX helps investors determine trend strength as they plan their investment strategies.
Confirmation on a chart and other momentum indicators help investors spot trend reversals. But some trends are more potent than others and investors want to better understand the strength of a trend. The ADX identifies a strong positive trend when the ADX is over 25 and a weak trend when the ADX is below 20. Investors can determine directional movement by analyzing the difference between two consecutive low prices and their correlated highs. The movement is +DM when the current high price, less the previous high price, is greater than the previous low price less the current low. The opposite applies in determining the negative or –DI.
When analyzing charts, stock price is the single most important variable to follow. ADX and other indicators are supplementary to price movements in providing additional directional information and support. For example, some of the best trends come about from price range consolidation. It is those tugs of war between buying and selling volumes that lead to breakouts and other trading opportunities.
The Inventor of the Average Directional Index
J. Welles Wilder, Jr. is a former American engineer and real estate developer who went on to revolutionize trading analysis by applying mathematical systems to the world of investing. In addition to developing the ADX, Wilder is also responsible for several other commonly used technical analysis tools including the Average True Range (ATR), the Relative Strength Index (RSI) and the Parabolic SAR.
www.investopedia.com
This script has alerts and includes the filter for markets with no trend defined.
Green Alert --> Long
Red Alert --> Short
Yellow Area --> Weak trend. ADX below threshold
Green candles --> Bullish Market
Red Candles --> Bearish Market
Orange candles --> No defined trend
Enjoy!
Directional Movement Indicator (DMI and ADX) - TartigradiaDirection Movement Indicator (DMI) is a trend indicator invented by Welles Wilder, who also authored RSI.
DMI+ and DMI- respectively indicate pressure towards bullish or bearish trends.
ADX is the average directional movement, which indicates whether the market is currently trending (high values above 25) or ranging (below 20) or undecided (between 20 and 25).
DMX is the non smoothed ADX, which allows to detect transitions from trending to ranging markets and inversely with zero lag, but at the expense of having much more noise.
This is an extended indicator, from the original one by BeikabuOyaji, please show them some love if you appreciate this indicator:
Usage: To use this indicator for entry: when DMI+ crosses over DMI-, there is a bullish sentiment, however ADX also needs to be above 25 to be significant, otherwise the move is not necessarily sustainable.
Inversely, when DMI+ crosses under DMI- and ADX is above 25, then the sentiment is significantly bearish, but if ADX is below 20, the signal should be disregarded.
This indicator automatically highlights the background in green when ADX is above 25, and in red when ADX is below 20, to ease interpretation.
Also, arrows can be activated in the Style menu to automatically show when the two conditions described above are met, or these can be used in a strategy.