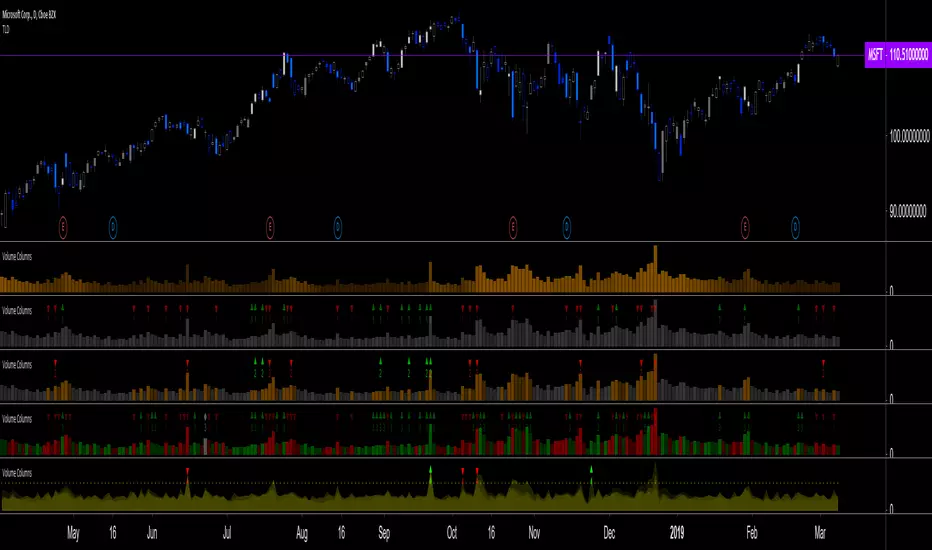
Volume Columns w. Alerts (V) [LucF]These are volume columns on steroids, for serious volume users. You can use the indicator to show volume columns or relative volume. You can define alerts using numerous conditions in both column and relative modes simultaneously. Multiple coloring schemes allow you to reveal volume columns in a much more useful light than the two-color standard.
Features
Seven Color Schemes
Plain gray.
Different color for columns above average MA.
Standard green and red.
Color gradient using the relative position of MA (default mode).
The first 3 schemes allow for highlighting increasing volume columns.
A gray column in an otherwise colored scheme indicates no change in price.
Two Modes
Column Mode: In this mode you can show the volume MA and mask the columns under it. The standard is an EMA because I think it better suits volume’s quick changes, but you can change it to the usual simple MA, as well as define its length.
Relative Volume: Calculations have been kept rudimentary. Current volume is simply compared to the previous bar’s volume. In order to compensate for this, a multiple area mode also compares current volume to 5, 15, 50 and 200 periods MAs. You can choose to view only the main relative volume value. Relative volume is capped in order to prevent the loss of detail caused by wild increases. The default cap is 10, but you can define your own. Spikes that are capped show a dot at their top. A separate threshold (its default value is the standard 2) is included for relative volume; it is used to generate relative volume markers.
Four Markers
Bumps (marker 1): A bump occurs when an increasing volume column is above its MA and the candle’s close is above/below the previous close.
Double Bumps (marker 2): A double bump occurs when 2 bumps are present in the last 3 bars.
Volume Over MA (marker 3): Triggers whenever volume is above MA. This is the noisiest of the markers.
Relative Volume (marker 4): This event occurs when relative volume crosses the pre-defined threshold.
You can choose to only show long or short markers.
Two Backgrounds
You can choose to highlight the background on bumps and double bumps.
Alerts
You can define alerts on any combination of markers you configure. After defining the markers you want the alert to trigger on, make sure you are on the interval you want the alert to be monitoring at, then create the alert, select V, use the default “Configured Markers” alert condition and choose your triggering window (usually “Once Per Bar Close”). Once the alert is created, you can change the indicator's inputs with no effect on the alert.
No worthwhile price movement exists without volume. It thus makes sense to define alerts on volume if you want to monitor markets. I use the markers to define two types of alerts. For general market scanning, I use markers 2 and 4 on high time frames. When I have identified a good opportunity for entry and am waiting for confirmation, I will often setup a custom alert for that market at a shorter time interval using markers 1 and 4.
Notes
Until we have access to delta volume information on TradingView, this indicator tries to get the most out of volume columns without using security calls at inside intervals to get more resolution on volume, because it slows things down considerably.
The chart shows different combinations of color schemes and markers, along with my TLD indicator on the chart.
在腳本中搜尋"alert"
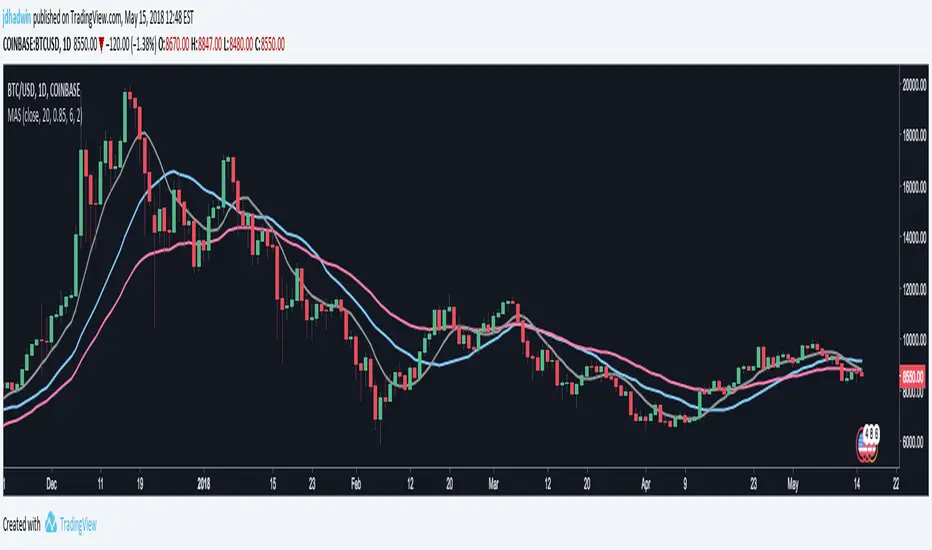
Moving Average SelectorEvery type of Moving Average (MA) that is built into TradingView, rolled into one color-coded Moving Average Selector (MAS). Mix-n-match and compare all seven: 1) Simple Moving Average (SMA), 2) Exponential Moving Average (EMA), 3) Running Moving Average (RMA), 4) Symmetrically Weighted Moving Average (SWMΑ), 5) Volume-Weighted Moving Average (VWMA), 6) Weighted Moving Average (WMA), and/or 7) Arnaud Legoux Moving Average (ALMA).
View any or all 7 averages together for comparison, or average one or more together into your own custom Averaged Moving Average! Better still, each Moving Average comes complete with independent Crossover and/or Crossunder Alerts, and an option in Settings to Require Candle Confirmation prior to alert-firing.
All seven moving averages averaged together into a new moving average (build your own):
Easily control the line-width of all your averages at once, and enjoy clearly labeled style tab in MAS Settings:
If you'd like to see more Moving Averages added to MAS, write your requests in the comments below.
PLEASE NOTE:
When using Alerts on TradingView, the alerts you create will retain the settings that were set at the time you created the alert, and will not update as you change the indicator settings later, after you created the alert. This is true of all custom tradingView alerts. For example, if "Require Candle Confirmation for Crossover Alerts" is unchecked in MAS Settings, and then you create an alert for "ALMA Crossunder", and then later decide to go to MAS Settings and check "Require Candle Confirmation for Crossover Alerts", the alerts you created beforehand will not respect your settings changes, but will continue to operate without requiring candle confirmations. Currently, TradingView policy is that the alert should be created anew, and the original alert should either be "Stopped" or "Deleted".
ICT Unicorn Breaker + FVG Alert📌 How to Use the ICT Breaker Block Indicator
The ICT Breaker Block Indicator helps you spot potential trade opportunities by setting up alerts. Here’s how to get started:
1️⃣ Draw Your Breaker Block
First, find a Bullish or Bearish Breaker Block on your chart.
Bullish Breaker Block: This forms when a bearish order block doesn't hold, and price breaks through to the upside. This indicates a shift from a bearish to a bullish market, with the previous bearish order block now acting as support.
Bearish Breaker Block: This forms when a bullish order block fails to hold, and price breaks through to the downside. This indicates a shift from a bullish to a bearish market, with the previous bullish order block now acting as resistance.
Use the drawing tool to mark the Breaker Block on your chart.
2️⃣ Set Your Entry & Stop Levels
Entry: For a bullish trade, enter at the top of the Breaker Block; for a bearish trade, enter at the bottom.
Stop Loss: Place this on the opposite side of the Breaker Block.
3️⃣ Choose Your Trade Direction
Bullish setup: Choose Buy for a bullish Breaker Block (upward break).
Bearish setup: Choose Sell for a bearish Breaker Block (downward break).
4️⃣ Create Two Alerts
You’ll need to set up the following two alerts in order:
✅ Unicorn Alert (Once Per Bar Close): Set this alert first for your selected Breaker Block (Bullish or Bearish). It triggers when price closes above the entry level (for a bullish setup) or below the entry level (for a bearish setup), and checks for bullish or bearish unmitigated Fair Value Gaps (FVGs) that overlap within the Breaker Block.
✅ Terminus Alert (Triggered Once): Once the Unicorn alert has been triggered, change the alert to a Terminus Alert. This alert is activated once the TP (terminus) is hit before the limit order fills from the Unicorn alert signal.
5️⃣ Automate with Webhook (Optional)
Want to automate your trades? Simply enter your Trader Post Webhook URL in the alert settings to send signals directly to your trading bot! 🤖

Boom Hunter X AlertsThis is a supplementary tool for Boom Hunter X. It has two main purposes. Firstly it handles setting alerts for all 3 Boom Hunter X presets with the convenience of only using one alert. The second purpose is as a chart assistance to display pivots and first pullbacks directly on your chart. By default the script is set to only show the last few bars but this can be modified in the settings up to 20000 to show all bars, this is handy for backtesting.
Signals are only lightly filtered and are designed to get you looking at the charts are the right times.
There are alerts for all 3 presets including:
- Pivots: HL, LH, HH, LL, 1st HL, 1st LH, Reversal up, Reversal down.
- Median crossings
- Kernel Regression crossing (kreg)
- First pullbacks
To use simply tick all the signals you wish to be alerted for in the settings.
Choose the frequency of the alerts in the settings to either on bar close or once per bar.
Click the create alert button, find BHX Alerts and select Any alert() function call.

FVG / Imbalance MTF Pro (4 HTFs + Alerts) - (@JP7FX)FVG / Imbalance MTF Pro (@JP7FX)
This indicator finds and plots Fair Value Gaps across up to four higher timeframes on a single chart. It shows them as lines, zones, 50 percent levels and labels, and can fire alerts when new gaps form or when price mitigates them.
Core logic
The script detects bullish and bearish FVGs using the classic three candle logic:
• Bullish FVG when high is below the current low.
• Bearish FVG when low is above the current high.
All logic runs on the selected higher timeframes through request.security, then projects the zones down onto your current chart timeframe. The script also checks that your chart timeframe is equal to or lower than the selected HTFs so the plots stay meaningful.
Multi timeframe control
You can configure up to four separate FVG layers: TF1, TF2, TF3 and TF4.
For each TF you can choose:
• Timeframe (or link it to the chart).
• Display mode, Lines and Zones, Zones Only, Lines Only, or Disable.
• Whether to show the 50 percent line.
• Whether to show a label with the TF name next to each FVG.
Inputs also convert the timeframe into minutes and hours so labels can show clear tags such as “15m”, “1h” and so on.
Visuals per timeframe
For every timeframe you can set:
• Entry and stop FVG line colours.
• 50 percent line colour and line style.
• Bullish and bearish zone fill colours.
• Separate colours for mitigated bullish and mitigated bearish zones.
• Label text colours for demand and supply.
Each FVG can draw:
• Two lines for the “entry” and “stop” edges of the gap.
• An optional 50 percent line through the zone.
• A shaded box that tracks the zone as price trades into it.
• A label that shows the originating timeframe.
Line and zone behaviour
Global settings let you control:
• Maximum number of FVG lines and zones kept on the chart.
• Line style for FVG edges and 50 percent lines.
• Whether lines and zones extend to the right.
• Whether zones update with price movement as price trades deeper.
• Whether the zone colour changes once the FVG has been mitigated.
• Label offset so you can push the TF labels to the right of price.
• An option to avoid overlapping zones per timeframe by checking for box overlap.
The script uses arrays of lines, boxes and labels for each TF and for demand and supply separately. It removes the oldest objects once the max count is hit and deletes or recolours zones when price reaches them.
Bar colouring
You can optionally colour the bar that creates the chart timeframe FVG.
• Bullish FVG origin bar can show as green.
• Bearish FVG origin bar can show as red.
Alerts
The indicator exposes alertcondition signals for both creation and mitigation. For each timeframe it supports:
• FVG zone created, bullish or bearish.
• Bullish FVG mitigated.
• Bearish FVG mitigated.
You choose the alert pack per TF through the inputs, then set the alert from the chart by right clicking the indicator and adding an alert.
Use case
This tool is for traders who map and trade Fair Value Gaps across multiple higher timeframes and want clean, configurable MTF FVG zones with clear labels, mitigation behaviour and alerts all in one script.

EMA Position AlertDescription
EMA Position Alert is a comprehensive trend analysis tool designed to help traders instantly identify the market's direction and strength relative to key Exponential Moving Averages (EMAs). By combining visual trend lines with a real-time data dashboard, this indicator provides a clear snapshot of the current price action across short, medium, and long-term horizons.
Whether you are a scalper looking for short-term momentum or a swing trader identifying major trend reversals, this tool simplifies the complex relationship between price and moving averages.
Key Features
1. Multi-EMA System The indicator plots four essential EMAs commonly used by institutional and retail traders:
EMA 21: Short-term trend/momentum.
EMA 55: Medium-term trend.
EMA 100: Major support/resistance level.
EMA 200: Long-term trend filter.
Visual Aid: The EMA lines change transparency automatically. They appear brighter/solid when the price is above them (bullish) and more transparent/faded when the price is below them (bearish).
2. Real-Time Information Dashboard A customizable table (displayed in the top-right corner) provides live data for the current bar:
Status: Clearly indicates if the price is "Above ▲" (Bullish) or "Below ▼" (Bearish) for each specific EMA.
Distance (%): Calculates the percentage distance between the current closing price and each EMA. This is crucial for identifying overextended moves (mean reversion opportunities) or tight consolidation.
Overall Trend Summary:
Strong ★★: Price is above all EMAs (21, 55, 100, 200).
Building ★: Price is above the long-term EMAs (55, 100, 200) but may be testing the short-term trend.
Weak ▼: Price is below all EMAs.
Ranging: Mixed signals (price is sandwiched between EMAs).
3. Custom Alerts Never miss a move. The script comes with built-in alert conditions compatible with TradingView's alert system:
Breakout Alerts: Trigger an alert when price crosses above specific EMAs (21, 55, 100, or 200).
Strong Trend Alert: Trigger an alert when the price successfully holds above all EMAs, signaling a strong bullish phase.
Settings
Show Status Table: Toggle the dashboard on or off.
Table Transparency: Adjust the background opacity of the dashboard to fit your chart theme.
Line Width: Adjust the thickness of the EMA lines for better visibility.
How to Use
Trend Following: Look for the "Strong ★★" status in the dashboard. When the price is above all EMAs and the EMAs are fanning out, it indicates a strong uptrend.
Pullbacks: If the trend is "Strong" but the price drops to test the EMA 21 or EMA 55, look for support bounces.
Mean Reversion: Watch the Distance %. If the distance becomes historically large, the price may be overextended and due for a correction back to the mean.
Consolidation: When the status shows "Ranging" and the Distance % is very low (near 0.00%), a breakout move is likely imminent.

Gerchik Auto Levels Simple v2 (multi TF + alerts)📘 Описание индикатора: Gerchik Auto Levels Simple
Индикатор автоматически строит ключевые уровни поддержки и сопротивления по выбранному таймфрейму и отслеживает взаимодействие цены с этими уровнями в режиме реального времени.
🧩 1. Как работает индикатор
Индикатор берёт данные с одного выбранного таймфрейма:
5 минут
15 минут
1 час
4 часа
День
На этом таймфрейме он анализирует ключевые сигналы, которые формируют важные уровни:
✓ Пивоты (Pivot High / Pivot Low)
Изломы рынка, где цена сделала значимый локальный максимум или минимум.
✓ Ложные пробои (False Breakout / ЛП)
Ситуации, когда цена обновила хай/лоу, но закрылась обратно — классика Герчика.
✓ Паранормальные бары (PB)
Сильные импульсные бары с хвостом и расширенным диапазоном:
хвост больше тела wickFactor раз
диапазон больше ATR atrFactor
🎯 2. Построение уровней
Для каждого найденного сигнала индикатор создаёт уровень:
уровни, расположенные близко друг к другу, объединяются в один (clustering)
используется параметр mergeTicks — допустимое расстояние в тиках
у каждого уровня есть сила (score): пивот > ложный пробой > паранормал
максимальное количество уровней регулируется параметром maxLevels
Если уровней больше лимита:
удаляется самый слабый
вместо него добавляется новый
🎨 3. Отображение уровней
Уровни автоматически окрашиваются:
красный — сопротивление (уровень выше текущей цены)
зелёный — поддержка (уровень ниже текущей цены)
Линии тянутся вправо на весь график (extend.both).
🚨 4. Типы алертов
Индикатор отслеживает каждое взаимодействие цены с уровнями и генерирует 5 типов сигналов:
1) Касание уровня (Touch)
Цена касается уровня тенями (low <= lvl <= high).
2) Подход к уровню (Near)
Цена приближается к уровню на расстояние X% (параметр alertNearPct).
3) Пробой вверх (Breakout Up)
Бар закрывается выше уровня.
4) Пробой вниз (Breakout Down)
Бар закрывается ниже уровня.
5) Ретест после пробоя (Retest)
Классический ретест Герчика:
сначала пробой вверх/вниз;
затем касание уровня;
затем закрытие в сторону пробоя.
Каждый тип можно выбрать отдельно в настройках алертов TradingView.
⚙️ 5. Основные параметры
srcTf — таймфрейм анализа уровней
leftBars / rightBars — жёсткость пивотов
mergeTicks — объединение уровней
maxLevels — максимальное количество уровней
atrLen / atrFactor — параметры паранормалов
wickFactor — чувствительность хвоста
alertNearPct — чувствительность подхода к уровню
resColor / supColor — цвета уровней
🧠 6. Для чего нужен индикатор
Этот инструмент полностью автоматизирует подход Герчика:
Находит только те уровни, которые действительно значимы
Очищает рынок от “шума” слабых экстремумов
Постоянно обновляется по мере формирования новых уровней
Даёт моментальные сигналы о взаимодействии цены с уровнями
Работает на любом инструменте (форекс, крипта, акции, фьючи).
📘 Indicator Description: Gerchik Auto Levels Simple
The indicator automatically identifies and plots key support and resistance levels based on a selected timeframe, combining several professional market signals commonly used in price-action and Gerchik-style trading.
🧩 1. How the Indicator Works
The indicator analyzes one selected timeframe:
5 minutes
15 minutes
1 hour
4 hours
1 day
On this timeframe it detects major structural events that create meaningful market levels:
✓ Pivot High / Pivot Low
Significant swing points where price forms a local top or bottom.
✓ False Breakouts (Fakeouts / FB / LP)
When price breaks the previous high/low but closes back inside.
This is one of the core concepts in Alexander Gerchik's methodology.
✓ Paranormal Bars (PB)
Strong impulse bars with extended wicks and unusually large range:
wick > body × wickFactor
range > ATR × atrFactor
🎯 2. Level Creation Logic
For each detected signal, the indicator generates a level:
close levels are automatically clustered into one using mergeTicks
each level has a strength score:
pivot > false breakout > paranormal bar
levels are stored, updated, and filtered dynamically
The total number of displayed levels is limited by the parameter maxLevels
(e.g., only the top 10 strongest levels will remain).
When maxLevels is reached:
the weakest level is removed,
the new level replaces it.
If a level already exists nearby:
the price is averaged,
the score is strengthened up to a maximum of 10.
🎨 3. Visual Representation
Levels are color-coded based on their relation to current price:
red — resistance (level above the current price)
green — support (level below the current price)
All levels extend across the entire chart (extend.both) for long-term visibility.
🚨 4. Alert System
The indicator supports five types of alerts, allowing traders to react instantly to market structure events:
1) Level Touch
The price touches a level using candle wicks
(low <= level <= high)
2) Level Near
The price approaches a level within a user-defined percentage
(alertNearPct)
3) Breakout Up
The candle closes above the level.
4) Breakout Down
The candle closes below the level.
5) Retest After Breakout
A classic Gerchik-style retest:
level is broken
price returns to it
candle closes back in the breakout direction
This confirms the validity of the breakout and often signals a high-quality entry point.
Each alert type can be selected and used independently inside TradingView’s alert settings.
⚙️ 5. Main Parameters
srcTf — timeframe for level detection
leftBars / rightBars — pivot sensitivity
mergeTicks — merge distance for clustering levels
maxLevels — maximum number of stored and displayed levels
atrLen / atrFactor — ATR settings for paranormal bars
wickFactor — wick/body ratio sensitivity
alertNearPct — sensitivity for "near" alerts
resColor / supColor — resistance/support colors
🧠 6. What This Indicator Solves
This tool fully automates the Gerchik-style level approach:
Finds only meaningful support/resistance levels
Filters out noise and weak local highs/lows
Adapts in real time as the market prints new structure
Provides immediate alerts for touches, approaches, breakouts, and retests
Works on any market (Forex, Crypto, Stocks, Futures)

Fundur - Market Sentiment BIndicator Overview
The Market Sentiment B indicator is a sophisticated multi-timeframe momentum oscillator that provides comprehensive market analysis through advanced wave theory and sentiment measurement. Unlike traditional single-timeframe indicators, Market Sentiment B analyzes 11 different timeframes simultaneously to create a unified view of market momentum and sentiment.
What Makes Market Sentiment B Unique
Multi-Timeframe Convergence : The indicator combines data from 11 different periods (8, 13, 21, 34, 55, 89, 144, 233, 377, 610, 987) based on mathematical sequences that naturally occur in market cycles.
Advanced Wave Analysis : The histogram component tracks momentum waves with precise peak and trough identification, allowing traders to spot both major moves and smaller precursor waves.
Sentiment Extremes Detection : When all 11 timeframes reach extreme levels simultaneously, the indicator highlights these rare conditions with background coloring, signaling potential major reversals.
Dynamic Zone Analysis : The indicator divides market conditions into Premium (80+), Discount (20-), and Liquidity zones (40-60), providing clear context for trade entries and exits.
Core Components
1. Market Sentiment B Line (Main Signal)
The primary oscillator line that represents the averaged sentiment across all timeframes. This line uses advanced mathematical filtering to smooth out noise while preserving important trend changes.
Key Features:
Oscillates between 0-100
Color-coded: Green when rising, Red when falling
Shows divergences with colored dots
Premium zone: 80+, Discount zone: 20-
2. Momentum Waves (Secondary Signal)
A smoothed version of the Market Sentiment B line that acts as a trend-following component. This line helps identify the underlying momentum direction.
Key Features:
Blue coloring during bullish expansion (above 50 and rising)
Orange coloring during bearish expansion (below 50 and falling)
Filled areas show expansion and contraction phases
Critical 50-line crossovers signal momentum shifts
3. Histogram (Wave Analysis)
The difference between Market Sentiment B and Momentum Waves, displayed as a histogram that reveals the relationship between current sentiment and underlying momentum.
Key Features:
Green bars: Positive momentum (Market Sentiment above Momentum Waves)
Red bars: Negative momentum (Market Sentiment below Momentum Waves)
Wave height labels show the strength of each wave
Divergence patterns identify potential reversals
4. Divergence System
Advanced divergence detection that identifies both regular and hidden divergences, with special "Golden Divergences" for the strongest signals.
Types:
Regular Divergences : Price makes new highs/lows while indicator doesn't
Hidden Divergences : Continuation patterns in trending markets
Golden Divergences : High-probability reversal signals (orange dots)
5. Zone Analysis
The indicator divides market conditions into distinct zones:
Premium Zone (80-100) : Potential selling area
Liquidity Zone (40-60) : Neutral/consolidation area (highlighted in orange)
Discount Zone (0-20) : Potential buying area
Extreme Conditions : Background coloring when all timeframes align
Setup Guide
Initial Installation
Open TradingView and navigate to your desired chart
Click the "Indicators" button or press "/" key
Search for "Fundur - Market Sentiment B"
Click on the indicator to add it to your chart
The indicator will appear in a separate pane below your chart
Essential Settings Configuration
Main Settings
Show Histogram Wave Values : Enable to see wave strength numbers
Wave Value Text Size : Choose from tiny, small, normal, or large
Wave Label Offset : Adjust label positioning (default: 2)
Market Sentiment Thresholds
Only Show Indicators at Market Sentiment Extremes : Filter signals to extreme zones only
Extreme levels are automatically set at 80 (high) and 20 (low)
Small Wave Strategy
Enable Small Wave Swing Strategy : Focus on smaller, early-warning waves
Small Wave Label Color : Customize the color for small wave labels
Divergence Analysis
Show Regular Divergences : Enable standard divergence detection
Show Gold Divergence Dots : Enable high-probability golden signals
Show Divergence Dots : Show all divergence markers
Histogram Settings
Enable Histogram : Toggle the histogram display
Divergence Types : Choose which types to display (Bullish/Bearish Reversals and Continuations)
Recommended Initial Setup
Enable all main components (Histogram, Divergences, Momentum Waves)
Set wave value text size to "small" for clarity
Enable golden divergence dots for premium signals
Start with all alert categories enabled, then customize based on your trading style
Basic Trading Guide
Understanding the Zones
Premium Zone Trading (80-100)
When to Consider Selling:
Market Sentiment B enters 80+ zone
Bearish divergences appear
Histogram shows weakening momentum (smaller green waves)
Background turns red (extreme conditions)
What to Look For:
Bearish pivot signals (orange triangles pointing down)
Golden divergence dots at tops
Momentum Waves turning bearish
Discount Zone Trading (0-20)
When to Consider Buying:
Market Sentiment B enters 0-20 zone
Bullish divergences appear
Histogram shows strengthening momentum (smaller red waves)
Background turns green (extreme conditions)
What to Look For:
Bullish pivot signals (blue triangles pointing up)
Golden divergence dots at bottoms
Momentum Waves turning bullish
Liquidity Zone Trading (40-60)
Consolidation and Breakout Zone:
Orange-filled area indicates neutral sentiment
Wait for clear breaks above 60 or below 40
Use for range-bound trading strategies
Look for momentum wave direction changes
Key Signal Types
1. Zone Crossovers
Above 60 : Bullish momentum building
Below 40 : Bearish momentum building
50-line crosses : Primary trend changes
2. Divergence Signals
Golden dots : Strongest reversal signals that align accross different timeframes
Colored dots : Standard divergence warnings
Hidden divergences : Trend continuation signals
3. Histogram Patterns
Increasing green bars : Building bullish momentum
Increasing red bars : Building bearish momentum
Smaller waves : Early warning signals of deteriorating interest
Basic Entry Rules
Long Entries
Market Sentiment B in discount zone (0-20) OR
Bullish divergence confirmed OR
Break above 40 from oversold conditions OR
Golden divergence dot at bottom
Short Entries
Market Sentiment B in premium zone (80-100) OR
Bearish divergence confirmed OR
Break below 60 from overbought conditions OR
Golden divergence dot at top
Exit Rules
Exit longs when entering premium zone
Exit shorts when entering discount zone
Close positions on opposite divergence signals
Use histogram wave tops/bottoms for fine-tuning exits
Advanced Analysis Setups
Setup 1: Scalping Configuration
Purpose : Quick intraday trades focusing on small moves
Settings :
Enable Small Wave Strategy
Show indicators only at extremes: OFF
Combine multiple alerts: ON
Focus on 1-5 minute timeframes
Signals to Watch :
Small wave histogram peaks/troughs
Quick zone crossovers (40/60 line breaks)
Momentum wave direction changes
Short-term divergences
Setup 2: Swing Trading Configuration
Purpose : Medium-term trend following and reversal trading
Settings :
Show indicators only at extremes: ON
Enable all divergence types
Focus on 15-minute to 4-hour timeframes
Golden divergence alerts: HIGH priority
Signals to Watch :
Premium/discount zone entries
Golden divergence signals
Extreme condition backgrounds
Major histogram wave formations
Setup 3: Position Trading Configuration
Purpose : Long-term trend identification and major reversal spots
Settings :
Only alert in extremes: ON
Focus on golden divergences only
Use daily and weekly timeframes
Minimize noise with extreme filtering
Signals to Watch :
Extreme condition backgrounds (red/green)
Major golden divergence signals
Long-term momentum wave trends
Weekly/monthly zone transitions
Setup 4: Reversal Hunting Configuration
Purpose : Catching major market turns at key levels
Settings :
Enable all divergence types
Show golden divergence dots: ON
Extreme filtering: ON
Small wave strategy: OFF
Signals to Watch :
Multiple divergence confirmations
Golden divergence + extreme zones
All-timeframe extreme conditions
Major histogram wave exhaustion
Setup 5: Trend Following Configuration
Purpose : Riding momentum in established trends
Settings :
Momentum waves: HIGH priority
Hidden divergences: ON
Continuation patterns focus
Zone crossover alerts
Signals to Watch :
Momentum wave expansion phases
Hidden divergence continuations
Liquidity zone breakouts
Sustained momentum patterns
Alert System
The Market Sentiment B indicator features a comprehensive alert system with over 30 different alert types organized into logical categories.
Alert Categories
Market Sentiment B Line Alerts
Golden Divergences : Highest priority reversal signals
Standard Divergences : Regular divergence patterns
Bearish/Bullish Pivots : Momentum pivot points
Premium/Discount Zone : Zone entry/exit alerts
Extreme Conditions : Rare all-timeframe extremes
Liquidity Zone : 40-60 zone movement alerts
Momentum Waves Alerts
Premium/Discount Zones : 80+/20- level alerts
Liquidity Zone Movement : 40-60 zone alerts
Expansion Phases : Bullish/bearish expansion alerts
Direction Changes : 50-line crossover alerts
Cross Alerts : MSB vs Momentum crossovers
Histogram Alerts
State Changes : Bullish/bearish turns
Peak/Trough Detection : Wave top/bottom alerts
Divergence Alerts : Histogram-specific divergences
Hidden Divergences : Continuation pattern alerts
Smaller Wave Alerts : Early warning signals
Alert Configuration Tips
For Day Trading
Enable quick state change alerts
Focus on histogram and small wave alerts
Use combined alerts to reduce noise
Disable extreme-only filtering
For Swing Trading
Enable zone crossover alerts
Focus on divergence and pivot alerts
Use extreme-only filtering
Prioritize golden divergence alerts
For Position Trading
Enable only golden divergences and extreme conditions
Use extreme-only filtering
Focus on major zone transitions
Disable minor wave alerts
Trading Strategies
Strategy 1: Premium/Discount Zone Reversal
Setup : Wait for Market Sentiment B to reach extreme zones
Entry :
Long: Enter discount zone (0-20) with bullish divergence
Short: Enter premium zone (80-100) with bearish divergence
Exit : Opposite zone reached or momentum wave reversal
Risk Management : Stop loss at recent swing high/low
Strategy 2: Golden Divergence Power Plays
Setup : Wait for golden divergence dots to appear
Entry : Enter in direction opposite to divergence (reversal play)
Confirmation : Wait for momentum wave to confirm direction
Exit : When sentiment reaches opposite zone
Risk Management : Tight stops below/above divergent pivot
Strategy 3: Momentum Wave Trend Following
Setup : Identify strong momentum wave expansion phases
Entry : Enter on pullbacks to 50-line during expansion
Continuation : Hold while expansion phase continues
Exit : When expansion phase ends or opposite expansion begins
Risk Management : Trail stops using wave peaks/troughs
Strategy 4: Small Wave Early Entry
Setup : Enable Small Wave Strategy for early signals
Entry : Enter on small wave formations before major moves
Confirmation : Wait for main sentiment line to follow
Exit : When major wave forms or opposite signal appears
Risk Management : Quick exits if main indicator doesn't confirm
Strategy 5: Extreme Condition Contrarian
Setup : Wait for background color changes (extreme conditions)
Entry : Counter-trend when ALL timeframes are extreme
Confirmation : Look for early divergence signs
Exit : When background color disappears
Risk Management : Position size smaller due to counter-trend nature
FAQ & Troubleshooting
Frequently Asked Questions
Q: Why don't I see any signals on my chart?
A: Check if "Only Show Indicators at Market Sentiment Extremes" is enabled. If so, signals only appear when the indicator is above 80 or below 20.
Q: What's the difference between golden and standard divergences?
A: Golden divergences (orange dots) are higher-probability signals that meet additional criteria for strength and momentum alignment. Standard divergences are regular price/indicator disagreements.
Q: How do I reduce alert noise?
A: Enable "Only Alert In Extremes" in the alert settings, or use "Combine Multiple Alerts" to consolidate multiple signals into single messages.
Q: What timeframe works best with this indicator?
A: The indicator works on all timeframes. For day trading, use 1-15 minutes. For swing trading, use 1-4 hours. For position trading, use daily or weekly.
Q: Why are the histogram wave values important?
A: Wave values show the strength of momentum. Declining wave values (smaller peaks) often precede trend changes, while increasing values confirm trend strength.
Troubleshooting Common Issues
Issue: Indicator not loading
Solution: Ensure you're using TradingView Pro or higher
Check that max_bars_back is set appropriately
Refresh the chart and re-add the indicator
Issue: Too many alerts firing
Solution: Enable extreme-only filtering
Disable less important alert categories
Use combined alerts feature
Issue: Missing divergence signals
Solution: Check that divergence detection is enabled
Ensure you're looking in the correct zones
Verify that extreme filtering isn't hiding signals
Issue: Histogram not displaying
Solution: Check that "Enable Histogram" is turned ON
Verify histogram divergence types are enabled
Ensure the chart has sufficient historical data
Best Practices
Start Simple : Begin with basic zone trading before using advanced features
Paper Trade First : Test strategies with paper trading before risking capital
Combine with Price Action : Use the indicator alongside support/resistance levels
Respect Risk Management : Never risk more than you can afford to lose
Keep Learning : Market conditions change; adapt your usage accordingly
Performance Optimization
Use appropriate timeframes for your trading style
Enable only necessary alert types
Consider using extreme filtering during high-volatility periods
Regularly review and adjust settings based on market conditions
Conclusion
The Market Sentiment B indicator represents a sophisticated approach to market analysis, combining multiple timeframes, advanced wave theory, and comprehensive divergence detection into a single powerful tool. Whether you're a scalper looking for quick opportunities or a position trader seeking major reversals, this indicator provides the insights needed to make informed trading decisions.
Remember that no indicator is perfect, and the Market Sentiment B should be used as part of a comprehensive trading plan that includes proper risk management, fundamental analysis awareness, and sound money management principles.
Happy Trading!
Disclaimer: Trading involves substantial risk and is not suitable for all investors. Past performance is not indicative of future results. Always practice proper risk management and never trade with money you cannot afford to lose.

Combo RSI + MACD + ADX MTF (Avec Alertes)✅ Recommended Title:
Multi-Signal Oscillator: ADX Trend + DI + RSI + MACD (MTF, Cross Alerts)
✅ Detailed Description
📝 Overview
This indicator combines advanced technical analysis tools to identify trend direction, capture reversals, and filter false signals.
It includes:
ADX (Multi-TimeFrame) for trend and trend strength detection.
DI+ / DI- for directional bias.
RSI + ZLSMA for oscillation analysis and divergence detection.
Zero-Lag Normalized MACD for momentum and entry timing.
⚙️ Visual Components
✅ Green/Red Background: Displays overall trend based on Multi-TimeFrame ADX.
✅ DI+ / DI- Lines: Green and red curves showing directional bias.
✅ Normalized RSI: Blue oscillator with orange ZLSMA smoothing.
✅ Zero-Lag MACD: Violet or fuchsia/orange oscillator depending on the version.
✅ Crossover Points: Colored circles marking buy and sell signals.
✅ ADX Strength Dots: Small black dots when ADX exceeds the strength threshold.
🚨 Included Alert System
✅ RSI / ZLSMA Crossovers (Buy / Sell).
✅ MACD / Signal Line Crossovers (Buy / Sell).
✅ DI+ / DI- Crossovers (Buy / Sell).
✅ Double Confirmation DI+ / RSI or DI+ / MACD.
✅ Double Confirmation DI- / RSI or DI- / MACD.
✅ Trend Change Alerts via Background Color.
✅ ADX Strength Alerts (Above Threshold).
🛠️ Suggested Configuration Examples
1. Short-Term Reversal Detection:
RSI Length: 7 to 14
ZLSMA Length: 7 to 14
MACD Fast/Slow: 5 / 13
ADX MTF Period: 5 to 15
ADX Threshold: 15 to 20
2. Long-Term Trend Following:
RSI Length: 21 to 30
ZLSMA Length: 21 to 30
MACD Fast/Slow: 12 / 26
ADX MTF Period: 30 to 50
ADX Threshold: 20 to 25
3. Scalping / Day Trading:
RSI Length: 5 to 9
ZLSMA Length: 5 to 9
MACD Fast/Slow: 3 / 7
ADX MTF Period: 5 to 10
ADX Threshold: 10 to 15
🎯 Why Use This Tool?
Filters false signals using ADX-based background coloring.
Provides multi-source alerting (RSI, MACD, ADX).
Helps identify true market strength zones.
Works on all markets: Forex, Crypto, Stocks, Indices.

Multi-Timeframe EMAs with Cross Alerts (Up & Down)📌 Indicator Name:
Multi-Timeframe EMAs with Cross Alerts (Up & Down)
🛠️ Core Features:
✅ 1. Multi-Timeframe EMA Display
The script calculates and displays 6 different Exponential Moving Averages (EMAs).
Each EMA has:
Custom length input (e.g., 9, 21, etc.).
Custom timeframe selection (e.g., 1H, 4H, 1D).
Custom color for easy identification on the chart.
✅ 2. EMA Visualization
Each of the six EMAs is plotted on the chart using the selected color and thickness.
They respond dynamically to different timeframes (current or higher/lower).
✅ 3. Cross Detection Logic
The script can detect crossover and crossunder between EMA pairs:
EMA 1 and EMA 2
EMA 3 and EMA 4
EMA 5 and EMA 6
(Optional: can be extended to other combinations.)
✅ 4. Alert Toggles
Users can enable or disable alerts for each pair independently:
Alert: EMA 1 crosses EMA 2
Alert: EMA 3 crosses EMA 4
Alert: EMA 5 crosses EMA 6
(You added an additional option for EMA 4 vs EMA 6 later.)
✅ 5. Visual Alert Markers
The script uses alert() function to send alert messages when:
An EMA crosses above another (crossover)
An EMA crosses below another (crossunder)
Alerts include clear icons like 🔼 and 🔽 in the messages.
🔔 Use Case Scenarios
Swing traders: Identify longer-term cross signals on higher timeframes.
Scalpers: Use lower-timeframe EMAs with fast alert reactions.
Multi-timeframe analysis: Spot alignment between trend-following EMAs across different periods.
✅ Bonus
Fully customizable — great for adapting to your own strategy, whether it's trend confirmation, re-entry signals, or early reversals
📌 اسم المؤشر:
المتوسطات المتحركة الأسية (EMA) متعددة الفريمات مع تنبيهات تقاطع صاعدة وهابطة
🛠️ الميزات الأساسية:
✅ 1. دعم متعدد للفريمات الزمنية
يقوم السكربت بحساب وعرض 6 متوسطات متحركة أسية (EMA) مختلفة.
يمكن تخصيص كل EMA من حيث:
الطول (مثل: 9، 21...).
الفريم الزمني (مثل: الساعة، الأربع ساعات، اليومي...).
اللون، لتسهيل التمييز بين الخطوط على الشارت.
✅ 2. عرض المتوسطات على الرسم البياني
يتم رسم كل من المتوسطات الستة باستخدام اللون والتنسيق الذي تختاره.
المتوسطات تتفاعل تلقائيًا مع التغييرات في الفريم الزمني.
✅ 3. كشف التقاطعات
يمكن للسكربت كشف تقاطعات (صعودًا أو هبوطًا) بين أزواج المتوسطات التالية:
EMA 1 و EMA 2
EMA 3 و EMA 4
EMA 5 و EMA 6
(ويمكنك إضافة المزيد مثل EMA 4 مع EMA 6 حسب الحاجة)
✅ 4. التحكم في التنبيهات
يمكن للمستخدم تفعيل أو تعطيل التنبيهات لكل زوج من المتوسطات على حدة:
تنبيه عند تقاطع EMA 1 و EMA 2
تنبيه عند تقاطع EMA 3 و EMA 4
تنبيه عند تقاطع EMA 5 و EMA 6
(وأي أزواج إضافية يتم إضافتها لاحقًا)
✅ 5. تنبيهات مرئية برسائل واضحة
السكربت يرسل تنبيهات عبر وظيفة alert() عند حدوث:
تقاطع صاعد (EMA يتقاطع من الأسفل إلى الأعلى).
تقاطع هابط (EMA يتقاطع من الأعلى إلى الأسفل).
التنبيه يحتوي على رموز توضيحية مثل 🔼 و 🔽 ليسهل قراءته.
🎯 مناسب لـ:
المتداولين المتأرجحين (Swing Traders): لاكتشاف تقاطعات على الفريمات الكبرى.
المضاربين (Scalpers): باستخدام EMA سريعة على فريمات صغيرة مع تنبيهات فورية.
محللي الفريمات المتعددة: لتأكيد الاتجاه أو الانعكاس بناءً على تقاطع متوسطات من فريمات مختلفة.
✅ مزايا إضافية:
قابل للتخصيص بشكل كامل حسب استراتيجيتك.
مناسب لعدة أساليب: تأكيد الترند، إعادة الدخول، أو إشارات الانعكاس المبكر.

Volume Standard Deviation Alert GusPurpose
The script detects and alerts traders when the volume of a trading asset significantly exceeds a calculated threshold based on the standard deviation of volume over a specified lookback period. It optionally filters these alerts based on whether the price action is bullish or bearish.
Key Components
Inputs
lookback (default: 20)
The number of bars to consider when calculating the moving average and standard deviation of volume.
stdDevFactor (default: 2.0)
The multiplier for the standard deviation to determine the threshold for a volume spike.
alertOnClose (default: true)
Determines whether alerts should only be triggered after the bar has closed.
checkBullBear (default: false)
Enables filtering of alerts based on the bullishness or bearishness of the bar.
Calculations
volSMA
The simple moving average (SMA) of the volume over the lookback period.
volStd
The standard deviation of the volume over the lookback period.
threshold
The alert threshold is calculated as:
Threshold
=
volSMA
+
(
stdDevFactor
×
volStd
)
Threshold=volSMA+(stdDevFactor×volStd)
isBullish & isBearish
Determines whether the current bar is bullish (close > open) or bearish (close < open).
volumeSpikeCondition
A condition that triggers when the current volume exceeds the calculated threshold.
bullishCondition & bearishCondition
Refines the spike condition by requiring the bar to be bullish or bearish when checkBullBear is enabled.
finalCondition
The ultimate alert condition based on the user’s preference for bullish/bearish filtering.
finalTrigger
Ensures the alert only triggers at bar close if alertOnClose is set to true.
Visualization
Plots the SMA of the volume (volSMA) and the threshold line (threshold), helping traders visually understand the conditions.
Histograms the current volume and colors the bars:
Red: Volume exceeds the threshold.
Blue: Volume is below the threshold.
Alerts
The script generates an alert message when the finalTrigger condition is met:
"Bullish Volume Spike!" if the bar is bullish.
"Bearish Volume Spike!" if the bar is bearish.
"High Volume Spike!" if no bull/bear filter is applied.
Alerts are sent using alert() with the message and set to trigger once per bar close.
Usage
Traders can use this script to identify unusual volume activity, which often precedes significant price movements.
Customizability allows traders to tune the lookback period, standard deviation multiplier, and whether to filter for bullish/bearish spikes.
Visual and audible cues help in identifying important market events in real time.
This indicator is particularly useful for spotting market breakouts or breakdowns driven by high trading activity.

ATR Trend Run - Signals Alerts SL and TP by Tech Store OnThe script uses several ATR formulas for entering/exiting trades, support/resistance lines to take TP1 (take profit 1) and another ATR formula for TP2 (take profit 2). Everything is fully configurable to your preference, and you can back-test it via TradingView. You can also configure the indicator for signals during US trading sessions (with or without power hour), as well as taking profits/stop-loss session time(s), as well as to close a position at the end of the trading session no matter what. Also, you can turn all of that off, so there are no trading session/end of day limits and each trade will run until it either hits SL, TP1, TP1 > back to entry, TP2. Note: indicator is set to skip consecutive/opposite signals, while you currently have a trade open > if you hit a trend – ride it to the end!
For example: If you will be day trading SPY and you wish to close your positions no matter what right before the market closes (3:45PM ET > 15min before closes): Make sure to checkbox “Intraday – Close Position Before Market Closes” in the strategy/indicator Settings, so that you are alerted soon before the market closes, if you wish to continue holding the position – leave this checkbox unchecked.
SL: SL is set to be slightly above/below the signal candle, which is best suited for this strategy.
Strategy Take Profit Approach
While the initial position open and SL hit is always based on a closed candle bar (can’t do otherwise, as otherwise you will have 10s of fake signal alerts), there are 2 ways on trading this strategy in terms of TP1 and TP1 taken > back to Entry, which is based off Alert type.
You can switch this as you like within the indicator settings, “Checked: TP1 taken > back to Entry per Price Touch | Unchecked: per Candle Close”.
Candle Close vs Price Touch: with the Default method - Candle Close for an alert for TP1 or if price comes back to Entry after TP1 is taken will only be triggered once candle bar fully closes crossing the area, while Price Touch will alert when price touches the area before candle bar closes.
For example: your trade is running well, you grab TP1 and the price reverses and hits your trade Entry area. With Price Touch – you are immediately alerted to close your trade with no loss and with TP1 profit. With Candle Close - you will receive an alert only once candle bar fully closes on top of the Entry crossing it backwards, meaning it may lower your TP1 profit or even completely reverse the trade into loss in case it will be a huge candle bar for any reason. However, it may touch the Entry area, looking like the price is reversing, but then continue per initial trade direction, sometimes becoming a trend. So, while Price Touch seem like a more conservative approach, Candle Close can give you much bigger profits if you catch a trend, but you can always change it via the Settings.
Note: TradingView back-testing engine does not have a feature to open/close orders IMMEDIATELY via Price Touch trigger, but only when the candle closes after price touches the scripted area/line/etc., so you for the most accurate results, test your strategy out via Candle Close setting. Otherwise, decide yourself. I personally like more Candle Close since I can test it out via back-testing with the most accurate results.
TP2 is set per Candle Close as often the ATR trailing stop line will be hit and bounced off, so it’s best to wait until candle actually breaks it/closes through it.
Note: If you will be observing the strategy LIVE, during LIVE candle bar movement – it will look weird, like it’s placing an order after order during any trigger – this seem like a TradingView bug, but is only observational, once the candle bar is closed and you refresh TradingView it will all look correct.
Back-Testing
If you wish to do some back-testing, just modify the strategy/indicator Settings:
-----1) STRATEGY: This is for back-testing/experimenting with the script inputs.
----------a. You can setup a start date (date, month, year) from which it will start opening back-test trades, select a position size and select TP1 size, the idea here is to close half (or whatever you choose) portion of the trade once you hit your TP1, then to either close at small profit or to catch a trend and close the second portion of the position long way ahead from Entry, otherwise it will alert you to close the position at TP2, if price comes back to Entry, at reversal signal or at the end of US trading session if the option for it is checked. If you wish to close the whole position at TP1, just enter the same amount for TP1 to match backtest position size. Otherwise you can experiment with TP1 sizing – try it out!
-----2) Feel free to experiment with ATR settings and with S&R Left/Right bars, you may be amazed how results will differ and find some really cool combinations!
-----3) Make sure you select/de-select “Intraday – Close Position Before Market Closes” setting depending on what you are back-testing and on which conditions
-----4) Note: If you wish to do some deep back-testing (1+ years), use the “Deep Backtesting” feature within Strategy Tester on the TradingView as otherwise it may show wrong results or even fail to compute the results
Add the alerts
-----Right-click anywhere on the TradingView chart
-----Click on Add alert
-----Condition: ATR Trend Run - Signals Alerts SL and TP, by Tech Store On
----------o Right underneath the condition click on the drop-down menu and select “alert() function calls only”
-----Expiration time: Whatever you wish
-----Alert actions: Whatever notifications you wish
-----Alert name: DO NOT TOUCH THIS
-----Hit “Create”
-----Note: If you change ANY Settings within the indicator – you must DELETE the current alert and create a new one per steps above, otherwise it will continue triggering alerts per old Settings!
- Note: If you add the alert while the script is currently “In Position” it will not know that. So either wait when there will be no position open at all or close your position partially if the bot opens it twice bigger or so in case per script the bot will think it is already in position.
Note: Because of the slippage and the order processing time between TradingView, AutoView and the Broker (it’s usually about a second or so), it is suggested to not use a timeframe lower than 1min. The script is working really well with 1M/3M/5M/H1/H4 timeframes per my back-testing, but feel free to explore via Strategy Back-testing what’s best for the instrument you wish to trade.
If you wish to try this out for a week or so – please reach out and I will give you access.

Total Trend Follow Study with Alerts, Pyramid and DCA
Introduction
This is the study version of my trend following strategy. It is designed to be a “drop in” replacement for its twin strategy. I have replicated the analysis logic and entry and exit procedures to produce a nearly identical result set to the strategy. Other than the properties tab, the inputs dialog is exactly the same. Backtest the strategy to determine the best inputs to trade. Then apply the same inputs to this study to forward test. Alerts are available for trade entry, take profit close, stop-loss exit and pyramid level. Please see the strategy version for a complete description of the trading behavior of this script.
In brief, this script is intended to benefit from long duration trending markets. The trading behavior is to buy on strength and sell on weakness. As such the trade orders maintain its directional bias according to price pressure. What you will see on the chart is long positions on the left side of the mountain and short on the right. Long and short positions are not intermingled as long as there exists a detectable trend. My trend following script uses the same pivot point calculations used by my range trader but this time rising pivots are long and falling pivots are short. I refer to pivots as a vertex in the inputs dialog box. The cone based measurement adds a peak, sides and a base to the calculation elements. This allows the inputs to focus on adjusting the location of trades and not just trend lines. The pivot points can be plotted on the backtest. You can use the vertex input values to move the pivots where you want trades to be. This script can be traded in four different modes: Long, Short, BiDir, and Flip Flop.
This script replicates the TradingView pyramid feature by adding a field to the inputs tab. Pyramiding works the same way in this script as its twin strategy. Each pyramid level increases the order size as a multiple of its level. This makes it easy to comply with NFA FIFO Rule 2-43(b) if the trades are executed here in America. The current pyramid level is reported in the summary label when reports are enabled. You can use this value to manually adjust the position size in your forward testing. I also expose an alert when the pyramid threshold is breached. Use the TradingView alert window to send yourself a message when the level increases.
In addition to pyramiding this script employs a DCA feature which can increase the order size in response to stopped out or winning streak trades. The number of losing trades is tracked through the “Debt Sequence” value displayed in the summary report. When the debt is recovered the sequence number resets to zero. You can use the “Debt Sequence” number to manually manage DCA on your forward test. The main difference between DCA and pyramids is that this implementation of DCA applies to new trades while pyramids affect open positions. If DCA is enabled be sure to set the limiter to prevent your account from depleting capital during runaway markets.
I also have a range trading version of this script for those not interested in trend following.
Design
This script is approximately 1800 lines of Pine 4 code and implements nine indicators on two time frames. The chart (primary) interval and one higher time frame which is based on the primary. The higher time frame identifies the trend for which the primary will trade. The original trading algorithms are a port from a much larger program on another trading platform. I've converted some of the statistical functions to use standard indicators available on TradingView. The setups make heavy use of the Hull Moving Average in conjunction with EMAs that form the Bill Williams Alligator as described in his book “New Trading Dimensions” Chapter 3. Lag between the Hull and the EMAs form the basis of the entry and exit points. The alligator itself is used to identify the trend main body.
Indicator Repainting
Indicator repainting is an industry wide problem which mainly occurs when you mix backtest data with real-time data. It doesn't matter which platform you use some form of this condition will manifest itself on your chart over time. The TradingView wiki has an in depth article on this subject in regard to the elements of the Pine language which contribute or are susceptible to this effect. In dealing with this problem from a prevention aspect in Pine, you have to accept some repaint to occur.
The goal of my repaint prevention in the study script is simply to ensure that my signal trading bias remains consistent between the strategy, study and broker. This actually turned out to be kind of a job since it interfered with another project goal to synchronize the entry and exits between the strategy and study scripts. The script execution engines are different between the Pine strategy and study. While the primary chart interval is quite manageable the higher time frame requires the security() function. TradingViewʼs higher time frame implementation, which interleaves the chart interval, combined with the critical “lookahead” parameter makes the solution necessarily complex. According the wiki regarding this issue, best practice comes down to the following two methods:
1. a = security(syminfo.tickerid, 'D', close , lookahead=barmerge.lookahead_on)
2. indexHighTF = barstate.isrealtime ? 1 : 0
indexCurrTF = barstate.isrealtime ? 0 : 1
a0 = security(syminfo.tickerid, 'D', close ,lookahead=barmerge.lookahead_off)
a = a0
This script employs method 2 with the only problem being the Pine sar() function which does not expose its internal bar series. The best work around would require hand coding the parabolic but the script is at the maximum local scopes and run-time duration so that option is not viable. So far, this hasn't proven to be much of a problem. I'm currently running several symbols, forex and crypto, the strategy and study remain highly correlated with no instances of completely opposite real-time signals. However, I have received some alerts with no corresponding plot on the chart but so far it only occurred on one symbol. I will continue to monitor this problem.
The Bottom Line. Does this script repaint. Yes, it will repaint about as much as every other multi-interval script which employs the best practice solutions available in the Pine Language.
Usage
Please be aware that the purpose of the study script is to perform forward testing of the configuration established in the backtest process. Therefore, the usage here in the study begins with the backtest configuration parameters. The following steps provide instructions to get this study script connected to the TradingView alert notification system. For a detailed description of how to create a trend following system using this script please see the strategy version.
Step 1. Create a chart with the trading instrument and interval used in the backtest.
Step 2. Find this script in the “Invite Only” section of the Indicators Dialog and apply it to the current chart.
Step 3. Copy the values from the backtest input dialog to the study.
Step 4. Open the TradingView Alert window.
Step 5. In the “Condition” drop down field find and select the name of the script.
Step 6. A new drop down field will appear with the alerts available in the script. This script exposes the following eight signals:
-- Long Entry Signal
-- Long Profit Signal
-- Long Stop-loss Signal
-- Long Pyramid
-- Short Entry Signal
-- Short Profit Signal
-- Short Stop-loss Signal
-- Short Pyramid
Select the signal for which you want notification.
Step 7. In the “Options” field select the frequency of the alert. Typically, "Once Per Bar" or "Once Per Bar Close" will be sufficient.
Step 8. Set the expiration date and time.
Step 9. Select the action of the alert. Currently TradingView offers six different actions:
-- Notify on App
-- Show Popup
-- Send Email
-- Webhook URL
-- Play Sound
-- Send Email to SMS
Step 10. Create a message to to transmitted with the alert. The script provides a default message which can be overridden with any custom description. The price, time and other reserved chart elements can be included in the message
Step 11. Click the “Create” button to generate this single alert.
Step 12. Repeat steps 1 through 11 for every signal you wish to receive.
This script is open for beta testing. After successful beta test it will become a commercial application available by subscription only. I’ve invested quite a lot of time and effort into making this the best possible signal generator for all of the instruments I intend to trade. I certainly welcome any suggestions for improvements. Thank you all in advance.

Cyatophilum H.A. Swing [ALERT SETUP]Hi guys, to celebrate the beginning of a new altcoins cycle, I created a Swing trade Indicator. (It's a joke, there will not be any altcoins cycle)
Cyatophilum Heikin Ashi Swing
This indicator will allow us to create one strategy for each pair and never miss those big swings ever again!
HOW BEAT BUY & HOLD WORKS
This kind of strategy is a safe long term investment , usually played in high timeframes such as 4H, 1D etc.
It is perfect for beginners in trading as the process is very simple: buy and sell when you receive the alert. The high timeframes allows to trade manually by receiving alerts on your phone or email, but you also can automate it if you prefer.
The primary goal of these strategies is to increase your capital faster than someone simply holding the asset .
The trades are made with no leverage and 100% equity . It is for those who want to grow their portfolio fast without risking to lose everything. You can use several strategies at once, in this case split your equity accordingly.
HOW DOES IT WORK?
The Heikin Ashi candles are very usefull. This strategy is built upon H.A. candles but is used on normal candles, because H.A. candles price are an average of real candles and we want to know the real price. I did the trick by recalculating the H.A. open, high, low and close with the original formula based on the real candles's ohlc. This allows me to use the strategy tester and backtest with real results.
HOW TO USE
Creating a signal is as simple as adding the indicator called to your chart and click "Set alert". Select "Once per bar close" for your alert options.
There are 3 alerts:
- BUY
- SELL
- BUY OR SELL (for free TV users)
Sample Backtest results
Bitcoin/Dollar
Ethereum/Bitcoin
Basic Attention Token/Bitcoin
> > Start using the indicator now < <
Note: This version is the ALERT SETUP. You can find the Backtest version on my profile scripts.

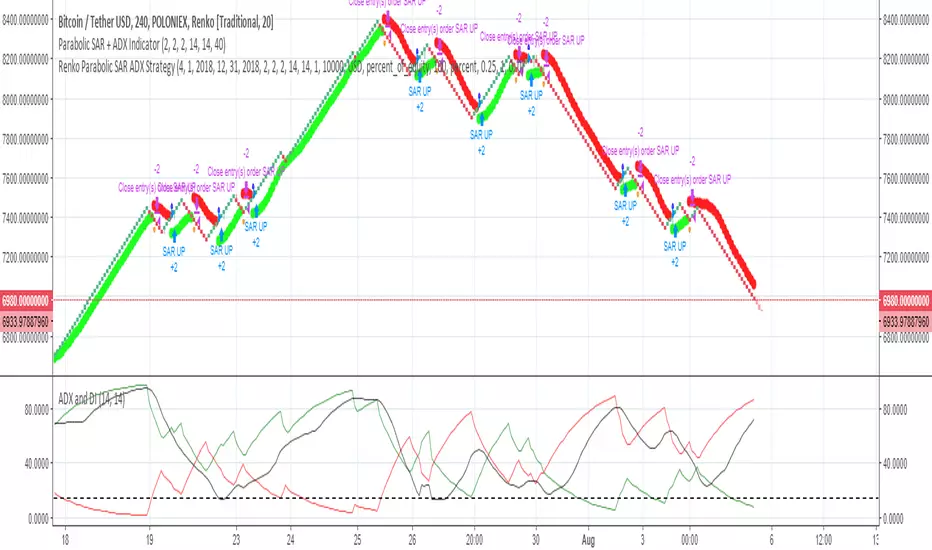
Renko Parabolic SAR + ADX Indicator (Need help on the alert)//This script is made using scripts by other authors. All credit goes to them. I am only copying snippets and making it work for me//
Problem Statement:
The script seems to work best using a fixed renko brick. The indicators do work but I have problems with the alert.
What often happens is, the signal appears (condition is met) BRIEFLY as the bar forms, it disappears a few seconds later, but the alert is still sent on the close of the bar.
I wish to receive these alerts on the close of a bar only if the condition is still met on the close of the bar
I am hoping someone can guide or fix the alertcondition such that it checks for the firmed signal before triggering the alert.
POLONIEX:BTCUSDT
5m Exit AlertsThese can help a lot with Daytrading if you don't have a price target in mind when there's no clear resistance / support nearby, and you don't trust the market enough to hold it as a swing trade.
Keep in mind that its main purpose is to give you a "warning" that it might be good to look at your screen, instead of guaranteeing you "now is the best time to exit". You won't reach high winning stats by blindly following this alert.
"A Exit LONG":
(I'm using letters instead of numbers for all Exit alerts to make sure I don't accidentally confuse Enter and Exit alerts).
There are 4 conditions that might trigger it. The reasons show up in the exit alert message (unfortunately only as a number, since alert messages can't have "dynamic text" in TradingView), and can also be displayed as symbols in the chart (see image above - make sure to enable "Show Signals" in the indicator settings first though).
Here are the conditions sorted from best to worst:
Technical reversal: Bearish Hammer candle with Volume > 2 * avg volume (of last 30 candles), when 5m candle closed. Reversal very likely. This is usually the best time to take your gains for the rest of the day.
EMA 3/8 cross: standard 5m EMA 3/8 cross, indicating a trend reversal, or at least a pullback. Can also be helpful to detect double tops / double bottoms.
Trailing Stop Loss: Crossed below 30m EMA 8, 5m candle closed. This is a "fallback" alert in case EMA 3 was already below EMA 8 before you set up the alert. It's not unlikely that the stock might go further down to VWAP, so depending on the chart and market this might be a good opportunity to save the gains you have left.
"Final" Stop Loss: Crossed below VWAP. Usually not a good sign. If you entered around VWAP your losses shouldn't be big yet, but if you plan on holding the stock the Daily chart and market outlook should better be quite convincing, and you wouldn't have needed to use this alert in the first place.
Keep in mind these work of course best if you picked a "good" stock: clear movement, tidy price action, high volume. Otherwise alerts are more likely to be triggered redundantly.
Always consider how the market and stock looks like, then decide whether to exit or not! Usually it makes sense to wait a bit to see f. e. whether the stock bounces off the 30m EMA 8, and it's just a pullback.
"B Enter SHORT":
Similar, but for shorts...
"C 1m Scalp LONG" + "D 1m Scalp SHORT":
Simple Scalping alert for EMA 3/8 cross on a 1m chart - but without needing to use a 1m chart to set it up!
Unfortunately it's not as accurate as manually setting this alert up on a 1m chart. It might be an advantage though that it sometimes is triggered 1-2 min later, since this means there are less redundant triggerings.
It can be useful esp. on high momentum trades, but I honestly haven't used it in a looong while.
"X Candle Close":
same as in 5m Entry indicator: triggered when 5m candle is confirmed
"Z Trend Change: UP" + "Z Trend Change: DOWN":
This one is meant to be used only on SPY: It alerts you when SPY is changing its trending direction, which might mean entering or closing existing trades.
I have therefore set it up to never end (by setting it to "Once Per Bar Close" in the alert settings).
It's based on DMI positive or negative being > 25. I had it based on VWAP at the beginning, but there were days where it was triggered every 5 minutes...
More infos: www.reddit.com

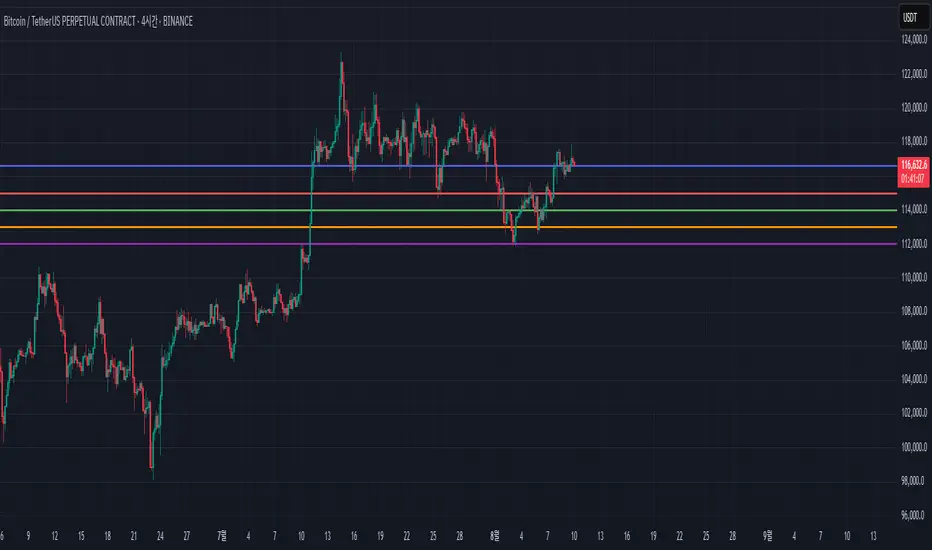
Price Level Alert System
Price Level Alert System - Manage Multiple Price Alerts in One
This indicator is designed to simplify price level monitoring by allowing you to manage up to 5 different price alerts through a single, unified alert system. Instead of creating multiple separate alerts for different price levels, you can now monitor all your key levels with just one alert subscription.
Key Benefits:
Unified Alert Management - Monitor 5 price levels with a single alert, saving your valuable alert slots
Clean Chart Interface - Toggle price levels on/off without cluttering your chart
Smart Alert Types - Get notified for price crosses (above/below) and approaching alerts
Customizable Appearance - Adjust colors, transparency, and line width for each level individually
Efficient Workflow - Inline controls make setup quick and intuitive
Perfect For:
Traders monitoring multiple support/resistance levels
Swing traders tracking key price targets
Day traders needing quick alert setup
Anyone wanting to maximize their TradingView alert efficiency
How It Works:
Simply enter your desired price levels, check the boxes to enable them, and click the bell icon to activate alerts. The indicator will monitor all enabled levels and send notifications through a single alert when price action occurs at any of your specified levels.
Features:
5 independent price levels
Individual on/off toggles
Approaching distance alerts (customizable percentage)
Cross above/below notifications
Professional line styling options
Status line price display
Save your alert slots and streamline your trading workflow with this efficient price level monitoring solution. Whether you're tracking support/resistance, psychological levels, or price targets, this indicator helps you stay informed without the complexity of managing multiple individual alerts.
Strong Engulfing Candlestick (With Alerts)Detect only Strong Bullish and Strong Bearish Engulfing candle patterns and provide visual signals along with alerts.
Key Features
Bullish Engulfing Detection:
Conditions:
Current candle's close > open (bullish).
Previous candle's close < open (bearish).
Current candle's high ≥ Previous candle's high (includes wicks).
Current candle's low ≤ Previous candle's low (includes wicks).
The body of the current bullish candle is stronger than the previous bearish candle.
Signal: Plots a green upward arrow below the bar when conditions are met.
Bearish Engulfing Detection:
Conditions:
Current candle's close < open (bearish).
Previous candle's close > open (bullish).
Current candle's high ≥ Previous candle's high (includes wicks).
Current candle's low ≤ Previous candle's low (includes wicks).
The body of the current bearish candle is stronger than the previous bullish candle.
Signal: Plots a red downward arrow above the bar when conditions are met.
Alerts:
Custom alerts are included for both bullish and bearish engulfing patterns:
Bullish Alert Message: "Strong Bullish Engulfing detected!"
Bearish Alert Message: "Strong Bearish Engulfing detected!"

Advanced Trend and Volatility Indicator with Alerts by ZaimonThis script presents a comprehensive analytical tool that integrates multiple technical indicators to provide a holistic view of market trends and volatility. By uniquely combining Moving Averages (MA), Relative Strength Index (RSI), Stochastic Oscillator, Bollinger Bands, and Average True Range (ATR), it offers nuanced insights into price movements and helps identify potential trading opportunities.
---
### **Key Features and Integration:**
1. **Moving Averages (MA20 & MA50):**
- **Trend Identification:**
- **Methodology:** Calculates two Simple Moving Averages—MA20 (short-term) and MA50 (long-term).
- **Bullish Trend:** When MA20 crosses above MA50, indicating upward momentum.
- **Bearish Trend:** When MA20 crosses below MA50, signaling downward momentum.
- **Golden Cross & Death Cross Alerts:**
- **Golden Cross:** MA20 crossing above MA50 generates a bullish alert and visual symbol.
- **Death Cross:** MA20 crossing below MA50 triggers a bearish alert and visual symbol.
- **Integration:**
- Serves as the foundational trend indicator, influencing interpretations of other indicators within the script.
2. **Relative Strength Index (RSI):**
- **Momentum Measurement:**
- **Methodology:** Calculates RSI to assess the speed and change of price movements over a 14-period length.
- **Overbought/Oversold Conditions:** Customizable thresholds set at 70 (overbought) and 30 (oversold).
- **Alerts:**
- Generates alerts when RSI crosses above or below the specified thresholds.
- **Integration:**
- Confirms trend strength identified by MAs.
- Overbought/Oversold signals can precede potential trend reversals, especially when aligned with MA crossovers.
3. **Stochastic Oscillator:**
- **Momentum and Reversal Signals:**
- **Methodology:** Uses %K and %D lines to evaluate price momentum relative to high-low range over recent periods.
- **Bullish Signal:** %K crossing above %D in oversold territory (below 20).
- **Bearish Signal:** %K crossing below %D in overbought territory (above 80).
- **Alerts:**
- Provides alerts on bullish and bearish crossovers in extreme regions.
- **Integration:**
- Enhances RSI signals by providing additional momentum confirmation.
- When both RSI and Stochastic indicate overbought/oversold conditions, it strengthens the likelihood of a reversal.
4. **Bollinger Bands:**
- **Volatility Visualization:**
- **Methodology:** Plots upper and lower bands based on standard deviations from a moving average (BB Basis).
- **Dynamic Support/Resistance:** Prices touching or exceeding the bands may indicate potential reversals.
- **Integration:**
- Works with RSI and Stochastic to identify overextended price movements.
- Helps in assessing volatility alongside trend and momentum indicators.
5. **Average True Range (ATR):**
- **Volatility Assessment:**
- **Methodology:** Calculates ATR over a 14-period length to measure market volatility.
- **ATR Bands:** Plots upper and lower bands relative to the current price using an ATR multiplier.
- **Integration:**
- Assists in setting stop-loss and take-profit levels based on current volatility.
- Complements Bollinger Bands for a comprehensive volatility analysis.
6. **Information Table:**
- **Real-Time Data Display:**
- Shows current values of MA20, MA50, RSI, Stochastic %K and %D, BB Basis, ATR, and Trend Status.
- **Trend Status Indicator:**
- Displays "Bullish," "Bearish," or "Sideways" based on MA conditions.
- **Integration:**
- Provides a consolidated view for quick decision-making without analyzing individual indicators separately.
7. **Periodic Labels:**
- **Enhanced Visibility:**
- Adds labels every 50 bars showing RSI and Stochastic values.
- **Integration:**
- Helps track momentum changes over time and spot longer-term patterns.
---
### **How the Components Work Together:**
- **Synergistic Analysis:**
- **Trend Confirmation:** MA crossovers establish the primary trend, while RSI and Stochastic confirm momentum within that trend.
- **Volatility Context:** Bollinger Bands and ATR provide context on market volatility, refining entry and exit points suggested by trend and momentum indicators.
- **Signal Strength:** Concurrent signals from multiple indicators increase confidence in trading decisions.
---
### **Usage Guidelines:**
1. **Trend Analysis:**
- **Identify Trend Direction:**
- Observe MA20 and MA50 crossovers.
- Refer to the Trend Status in the information table.
- **Confirm with Momentum Indicators:**
- Ensure RSI and Stochastic support the identified trend.
2. **Entry and Exit Points:**
- **Overbought/Oversold Conditions:**
- Look for RSI and Stochastic reaching extreme levels.
- Consider entering positions when oversold in a bullish trend or overbought in a bearish trend.
- **Bollinger Band Interactions:**
- Use price interactions with Bollinger Bands to identify potential reversal zones.
3. **Risk Management:**
- **ATR-Based Levels:**
- Set stop-loss and take-profit levels using ATR bands to account for current volatility.
- **Adjusting to Volatility:**
- Modify position sizes and targets based on Bollinger Band width and ATR values.
4. **Alerts Setup:**
- **Customize Alert Thresholds:**
- Configure alerts for MA crossovers, RSI levels, and Stochastic crossovers according to your trading strategy.
- **Stay Informed:**
- Use alerts to monitor key events without constant chart observation.
---
### **Customization:**
- **Flexible Parameters:**
- All indicator lengths, thresholds, and settings are adjustable to suit different trading styles and timeframes.
- **Adjustable Visuals:**
- Modify plot colors, line styles, and label positions to enhance chart readability.
---
### **Originality and Value Addition:**
This script differentiates itself by:
- **Integrated Approach:**
- Seamlessly combining multiple indicators to provide a more comprehensive analysis than using each indicator separately.
- **Enhanced Visualization:**
- Utilizing plots, fills, labels, and an information table to present data intuitively.
- **User-Friendly Features:**
- Pre-configured alerts and real-time data displays reduce the need for manual monitoring.
By explaining how each component interacts and contributes to the overall analysis, the script adds substantial value to traders seeking a multi-faceted tool for market analysis.
---
### **Additional Notes:**
- **Learning Resource:**
- The script is well-commented, serving as an educational tool for those learning Pine Script and technical analysis integration.
- **Further Enhancements:**
- Opportunities exist to incorporate additional indicators like MACD or ADX, and to develop advanced alert logic, such as RSI or Stochastic divergences.
---
### **Disclaimer:**
- **Educational Purpose Only:**
- This script is provided for informational purposes and should not be construed as financial advice.
- **Risk Acknowledgment:**
- Trading involves significant risk; past performance is not indicative of future results.
- **Due Diligence:**
- Users should conduct their own analysis and consider consulting a financial professional before making trading decisions.
---
By providing detailed explanations of the methodologies and the synergistic use of multiple indicators, this script aligns with TradingView's guidelines for originality and usefulness. It offers traders a unique tool that enhances market analysis through the thoughtful integration of technical indicators.

Doji Detector- Alerts!
1. Purpose
The script identifies Doji candles, which are candlesticks with very small or negligible bodies and relatively large wicks. These patterns often indicate market indecision and can serve as potential reversal signals.
2. User Inputs
The script includes several customizable parameters to fine-tune the detection of Doji candles:
• wickRatioLimit: Defines the maximum allowable ratio between the sizes of the upper and lower wicks.
• Example: If the upper wick is no more than 1.5 times larger than the lower wick (or vice versa), the candle can be classified as a Doji.
• bodyColor: Specifies the color for the body of detected Doji candles.
• showMarker: Enables or disables the display of a visual marker (a triangle) below detected Doji candles.
• bodyToWickRatio: Sets the maximum ratio between the size of the candle’s body and the total length of its wicks.
• Example: A body-to-wick ratio of 0.5 means the body cannot be larger than 50% of the sum of the upper and lower wicks.
• alertOnDoji: Activates or deactivates alerts when a Doji candle is detected.
3. Detection Mechanism
The script calculates key components of the candlestick:
• Upper Wick: Difference between the high price and the larger of the open or close prices.
• Lower Wick: Difference between the low price and the smaller of the open or close prices.
• Body Size: Absolute difference between the open and close prices.
It then determines whether the candle qualifies as a Doji based on the following conditions:
1. The body size must be less than or equal to the specified fraction of the total wick size (bodyToWickRatio).
2. The ratio of the upper wick to the lower wick must not exceed the defined wickRatioLimit.
If both conditions are met, the candle is classified as a Doji.
4. Visual Features
The script provides visual indicators for detected Doji candles:
• Bar Coloring: The bodies of detected Doji candles are colored with the specified bodyColor (default is red).
• Markers: If enabled (showMarker = true), a green triangle is plotted below each detected Doji candle for easy identification.
5. Alerts
The script sets up alert conditions for detected Doji candles:
• If alertOnDoji is enabled, an alert is triggered whenever a Doji candle is detected.
• The alert message is customizable and displays “Doji Detected!” by default.
6. Use Case
This script is useful for traders who want to:
• Identify moments of market indecision (Doji patterns) automatically.
• Receive alerts to take appropriate trading actions based on these patterns.
• Highlight Doji candles on charts with customized colors and markers.

PnF Bullish & Bearish Trend Line Indicator with Proximity AlertThis Pine Script indicator, "PnF Bullish and Bearish Trend line Proximity Alert," overlays on a trading chart to monitor and alert users about interactions with bullish and bearish trend lines derived from Point and Figure (PnF) charting.
Key Features:
Inputs: Users can set parameters such as box size, bullish and bearish angles (in degrees), and a proximity threshold for detecting touches.
Slope Calculation: The script calculates the slopes for bullish and bearish trendlines using the tangent of the specified angles.
Trendline Management:
It initializes and updates trend lines based on price interactions, adjusting their starting points and positions as conditions change.
Proximity Detection: The indicator checks if the current price is close enough to the trend lines and sets conditions for alerts.
Alerts: Users receive alerts when both trend lines are touched, enhancing decision-making for trading strategies.
Visual Feedback: It highlights areas where both trend lines are touched and plots the trend lines in distinct colors for clarity.
This indicator provides an effective way to track key price levels and potential trend reversals in the market.
Dollar cost averaging (DCA) QFL IndicatorAs investors, we often face the dilemma of willing high stock prices when we sell, but not when we buy. There are times when this dilemma causes investors to wait for a dip in prices, thereby potentially missing out on a continual rise. This is how investors get lured away from the markets and become tangled in the slippery slope of market timing, which is not advisable to a long-term investment strategy.
Skyrex developed a complex indicator based on dollar-cost averaging in Quick Fingers Luc's interpretation. It is a combinations of strategies which allows to systematically accumulate assets by investing scaled amounts of money at defined market cycle global support levels. Dollar-cost averaging can reduce the overall impact of price volatility and lower the average cost per asset thus even during market slumps only a small bounce is required to reach take profit.
The indicator script monitors a chart price action and identifies bases as they form. When bases are reached the script provides entry alerts. During price action development an asset value can go lower and in this way the script will perform safety entries alerts at each subsequent accumulation levels. When weighted average entry price reaches target profit the script will perform a take profit action alert.
Bases are identified as pivot lows in a fractal pattern and validated by an adjustable decrease/rise percentage to ensure significancy of identified bases. To qualify a pivot low, the indicator will perform the following validation:
Validate the price rate of change on drops and bounces is above a given threshold amount.
Validate the volume at the low pivot point is above the volume moving average (using a given length).
Validate the volume amount is a given factor of magnitude above is above the volume moving average.
Validate the potential new base is not too close to the previous range by using a given price percent difference threshold amount.
A fractal pattern is a recurring pattern on a price chart that can predict reversals among larger, more chaotic price movements. These basic fractals are composed of five or more bars. The rules for identifying fractals are as follows:
A bearish turning point occurs when there is a pattern with the highest high in the middle and two lower highs on each side.
A bullish turning point occurs when there is a pattern with the lowest low in the middle and two higher lows on each side.
Basic dollar-cost averaging approach is enhances by implementation of adjustable accumulation levels in order to provide opportunity of setting them at defined global support levels and Martingale volume coefficient to increase averaging effect. According to Quick Fingers Luc's principles trading principles we added volume validation of a base because it allows to confirm that the market is resistant to further price decrease.
The indicator supports traditional and cryptocurrency spot, futures, options and marginal trading exchanges. It works accurately with BTC, USD, USDT, ETH and BNB quote currencies. Best to use with 1H timeframe charts and limit orders. The indicator can be and should be configured for each particular asset according to its global support and resistance levels and price action cycles. You can modify levels and risk management settings to receive better performance
Advantages of this indicator:
The indicator has custom alert settings for each strategy action
The indicator can be used with 3Commas, Cryptohopper, Alertatron or Zignaly bots
The indicator is sustainable to market slumps and can be used for long-term trading
The indicator provides a large number of entries which is good for diversification
Can be applied to any market and quote currency
Easy to configure user interface settings
How to use?
1. Apply indicator to a trading pair your are interested in using 1H timeframe chart
2. Configure the indicator: change layer values, order size multiple and take profit/stop loss values according to current market cycle stage
3. Set up a TradingView custom alert using the indicator settings to trigger on a condition you are interested in
4. The indicator will send alerts when to enter and when to exit positions which can be applied to your portfolio using external trading platforms
5. Update settings once market conditions are changed using backtests on a monthly period

Custom Multi-Timeframe Screener with AlertsThis is a multi-timeframe screener with alerts. Use this way you can create a screener on indicators using 2 or more timeframes.
In TradingView there is a limit of 40 security function calls. Every timeframe requires another security call so you can screen fewer symbols with any additional timeframe.
In this example, I use 2 timeframes, so the maximum amount of symbols you can scan is 40/2 = 20.
For 3 timeframes - 13, 4tfs - 10, 5tfs - 8 symbols and so on.
In this simplistic example, I require a cross of EMAs on the current timeframe and confirmation that one EMA above/below another from the second timeframe.
Of course, you can create much more complicated functions for this screener.
Params
- higher timeframe
- ema params
- 20 symbol inputs for instruments you want to use in this screener
Alerts
You can create an alert from it easily by selecting the screener name from the list and then selecting "Any alert() function call".
No additional configuration is required, message and alert on close is generated in the code.
You should better change the default name for your alert. Sometimes because of big amount of inputs you might receive an error.
Disclaimer
Please remember that past performance may not be indicative of future results.
Due to various factors, including changing market conditions, the strategy may no longer perform as good as in historical backtesting.
This post and the script don’t provide any financial advice.
