Multi-Timeframe TTM Squeeze Pro with alerts and screenersBased of John Carters TTM Squeeze. Must open the settings and select wether you want to match the timeframe in your chart. This must be done in the pinescreener as well otherwise results will not be correct.
---
# **Squeeze Momentum Pro – Enhanced Screener + EMA Cross Alerts**
This custom version of the Squeeze Momentum indicator expands the standard TTM-style squeeze with screening and automated alert logic so you can quickly find high-quality setups across many tickers.
---
## **What This Script Does**
This indicator plots a three-level squeeze visual similar to TTM Squeeze:
Dot meanings in this indicator
Orange dot:
Strongest squeeze – Bollinger Bands are inside the tightest Keltner level (highest volatility compression).
Red dot:
Medium squeeze – still compressed, but not as tight as orange.
Black dot:
Weak squeeze / lowest level of volatility compression.
Price is coiling, but not as tight as the higher levels.
Green dot (“Fired”):
Squeeze has released — Bollinger Bands have expanded out of the channels and momentum is moving.
A momentum histogram is plotted to show directional pressure during the squeeze.
---
## **Major Improvements Added**
### **① Screenable Conditions for Stock Scanners**
This version includes multiple `alertcondition()` flags so the script can be used as a **Pine Screener inside TradingView**.
Currently it can screen for:
✔ Price closing above the 50-SMA
✔ Presence of an **orange (strong) squeeze dot**
✔ 6/20 EMA crossover signals inside a squeeze
These can be used inside the TradingView Screener or in watchlists to automatically highlight qualifying tickers.
---
### **② 6/20 EMA Trend Signals (Filtered by Squeeze)**
A crossover system was added:
* **Bullish Signal:** 6 EMA crosses above 20 EMA
* **Bearish Signal:** 6 EMA crosses below 20 EMA
But **these signals only trigger if the market is in a red or orange squeeze**, which helps remove noise and focus on valid setups.
---
### **③ Visual Markers Under the Histogram**
Whenever an EMA crossover occurs during a squeeze:
* A **green up-triangle** is plotted for a bullish cross
* A **red down-triangle** for a bearish cross
These markers are drawn **below the histogram**, keeping the display clean while still providing quick visual cues.
---
### **④ Fully Non-Repainting Logic**
All signals and squeeze calculations are based on standard fully-resolved `ta.*` functions, making the results stable both in backtesting and real-time.
---
## **Who This Script Helps**
This version is ideal for:
* Traders who use TradingView’s screener and want automated breakout/continuation filtering
* Traders who scan large watchlists for squeeze setups
* Users who want trend confirmation during volatility compression
---
## **How to Use It**
1. Add the script to your chart
2. Open TradingView Alerts or Screener
3. Select the conditions you want, for example:
* *“Orange Squeeze Detected”*
* *“Squeeze Fire after 3 squeeze dots*
* *“4 REd Dots in a row.”*
* *“Buy Alert”*
* *“EMA 6/20 Bullish Crossover (Squeeze Only)”*
* *“Close Above 50 SMA”*
Once active, TradingView will automatically flag symbols that meet the criteria.
---
## **Summary**
This enhanced Squeeze Momentum indicator turns the standard TTM-style visual into a **true screening and alert system** by adding:
* Multi-level squeezes
* EMA trend signals
* Screener-compatible alert conditions
* Clean visual signals
* Non-repainting logic
It helps traders quickly locate high-probability setups across any watchlist or market.
在腳本中搜尋"alert"

Pivot Points High Low Multi Time Frame + AlertsThis script is a modified version of “Pivot Points High Low Multi Time Frame” for TradingView, enhanced with price alerts when the market reaches or crosses recent pivot levels.
What it does:
Detects Pivot Highs and Pivot Lows based on your chosen timeframe and bar settings.
Draws visual lines and labels at each pivot level for clear identification.
Keeps track of the latest pivot high and low values.
Triggers an alert condition when the price crosses either of those pivots.
Alert conditions included:
🔔 Price Crossed Pivot High — notifies when the price touches or moves above the last pivot high.
🔔 Price Crossed Pivot Low — notifies when the price touches or moves below the last pivot low.
How to use:
Add the script to your chart in TradingView.
Click the Alarm (🔔) icon → choose Add Alert.
Under Condition, select this indicator and pick one of the two alert types.
Choose your preferred alert frequency (Once per bar, Every time, etc.).
Tip: You can also visually see when alerts are triggered — small green and red triangles will appear above or below the bars where the price crosses a pivot.

ShockDrop Alerts v1⚡ ShockDrop Alerts — Rapid Drop & Drawdown Detector
ShockDrop Alerts helps you react instantly to sudden market shocks.
It tracks both fast price drops and intraday drawdowns, plotting clean visual arrows and sending alerts when volatility spikes — so you can respond before small dips turn into major moves.
⚙️ How It Works
• Fast Drop (FAST) – detects sharp declines (e.g. 2 % in 4 minutes) using 1-minute data across any timeframe.
• Drawdown (DD) – triggers when price trades a set percentage below the day’s session high (e.g. 2 %).
Each alert type has its own independent cooldown timer and can be toggled on or off.
🎯 What You’ll See
• FAST → 🔴 red arrow above the bar (rapid drop detection)
• DD → 🟠 orange arrow below the bar (intraday drawdown)
These appear only when your defined conditions are met. Connect them to TradingView alerts for instant popup, email, mobile, or webhook notifications.
🧭 Key Features
• Detects high-velocity price shocks in real time
• Separate cooldowns for FAST and DD triggers
• Extended-hours toggle to include pre/post-market data
• Clean, clutter-free visuals — only actionable arrows
• Uses 1-minute precision data, works on any symbol or timeframe
• Supports server-side alerts (TradingView Pro +)
📬 Why Traders Use It
• Get early warnings during flash crashes or liquidity spikes
• Automate risk-based exits when markets accelerate downward
• Track SPY, QQQ, crypto, or futures for rapid reversals
• Stay alert to high-impact news events — such as surprise policy comments, earnings releases, or market-moving presidential posts — that can cause sudden volatility
Requires TradingView Pro + for continuous server-side alerting.

TGFA Flexible Alerts Multi-MA CrossoversTGFA Flexible Alerts, Multi-MA Crossovers
Description
Flexible MA crossovers with BUY/SELL alerts, customizable candle colors, and an info box for ATR/volatility insights. Supports EMA/SMA/HMA/VWAP on any chart.
Overview
TGFA Flexible Alerts is a versatile Pine Script indicator for traders seeking customizable moving average (MA) crossovers, visual signals, and quick-reference metrics. It overlays crossover lines (e.g., fast EMA over slow SMA), generates BUY/SELL labels and alerts, colors candles based on themes, and includes an optional info box with ATR bands, support/resistance, and trend projections. Built for any symbol and timeframe (optimized for 1H intraday), it auto-detects Heikin Ashi charts and handles mixed MA types like responsive HMA with lagging EMAs. All logic uses built-in TA functions for reliability—no repainting on confirmed bars.
Key Features
MA Crossover Engine: Configurable lines (EMA, SMA, HMA, VWAP) with dynamic colors (HMA tints green/red based on slope). Enable/disable via inputs.
Invert Signals Toggle: Flips BUY/SELL logic for mixed MA setups (e.g., HMA as fast line over EMA).
Reasoning: Traditional crossovers assume a fast line (low lag) crossing above a slow line (high lag) for buys. HMA's hull design makes it ultra-responsive, so it may "lead" too aggressively—causing premature signals. Inverting aligns it with user intuition (e.g., HMA dipping below then recovering signals strength), reducing false positives in trending markets. Test on your pairs!
Visual Alerts: BUY/SELL labels at crossover price (with optional price display and offset adjustment).
Single MA Overlays: Independent plots for EMA/SMA/HMA/VWAP (length 0 to hide).
Info Box: Real-time table with current price, ±1/2 ATR bands, median price (over lookback), trend (SMA50 slope), volatility % (ATR normalized), support/resistance (recent highs/lows), and reversal projections (tied to SMA50 pivot for up/down bias).
Candle Coloring: 20+ themes (dark/light canvases) for bull/bear/reversal/low-volume bars—e.g., Emerald Blaze greens uptrends, dims on low vol. Toggle off for no changes.
Chart Source Flexibility: Auto-switches to Heikin Ashi if detected; manual override for Regular/HA.
Alerts fire on crossovers/crossunders (custom messages with ticker/interval). Open-source for forking.
How to Use
Add to Chart: Search in TradingView's public library, apply to any symbol (e.g., stocks, forex). Best on 1H for intraday, but works on daily/weekly too.
Setup Crossovers: Choose Line 1/2 types/lengths (e.g., HMA 9 over SMA 20). Enable "Invert Signals" if using HMA—prevents lag mismatches in volatile assets.
Alerts & Labels: Toggle labels for visuals; set TradingView alerts on "Buy"/"Sell" conditions. Use offset for crowded charts.
Info Box Insights: Enable for quick scans—e.g., enter long near support if trend is bullish and price > median. Adjust ATR length (default 14) for sensitivity.
Candle Themes: Pick a scheme (e.g., Neon Pulse for dark mode); it overrides bar colors without altering data.
Customization Tip: For HMA-heavy setups, invert + short lengths (5-9) catch turns early; pair with volume filter in alerts.
Limitations & Disclaimers - Designed for overlay on price charts; may overlap in tight ranges—adjust transparency via styles.
HMA can repaint intra-bar; signals confirm on close. Not back tested for all assets—validate with strategy tester.
Info box projections use SMA(50) as a trend pivot (same for up/down as reference); customize via code for advanced calcs. Candle colors are cosmetic only.
This is an analysis tool, not advice. Trading involves risk; combine with fundamentals/news. Past performance isn't indicative of future results. No liability for losses.
I'm still a newbie, so feedback encouraged!
Thank you!!
ThisGirl

ICT Killzones Pro Suite — ICT & SMC Indicator with AlertsThe ICT Killzones Pro Suite is a complete ICT and Smart Money Concepts (SMC) indicator that brings together the most important institutional concepts into one single tool.
Instead of manually drawing sessions, structure breaks, liquidity levels or imbalances, this ICT indicator for TradingView automatically plots them with precision and full customization.
It is widely used by traders in Forex, Indices, Crypto and Commodities who want to study market structure the same way institutions do.
🔎 Features
✅ Killzones (Asia, London, New York)
Session boxes with customizable colors
50% midline level for equilibrium reference
Real-time status display (“In Killzone” / “Out of Killzone”)
✅ Equal Highs & Equal Lows (Liquidity zones)
Automatic detection of EQH/EQL
Equality tolerance parameter
Zone expiry (bars)
Rejection filter (2 consecutive closes)
Option to show only the latest active EQH/EQL
✅ Break of Structure (BOS) & Market Structure Shift (MSS)
Detects continuation (BOS) and reversal (MSS) structures
Customizable line styles and colors
“Body only” or “Body/Wick” break modes
Option to show only the latest signals
✅ Open Price Range (OPR)
Institutional daily open level in UTC
Historical OPR memory for backtesting
Optional labels for quick identification
✅ Previous Highs and Lows
Daily (PDH/PDL), Weekly (PWH/PWL), Monthly (PMH/PML)
Full label system
Customizable line width/style
Breakout alerts for each level
✅ Fair Value Gaps (FVGs)
Automatic imbalance detection
Wick or body detection modes
Highlighted imbalance candles in yellow
✅ Alerts Engine
One global alert condition
Modular alerts:
• Killzone opens/closes
• EQH/EQL created or broken
• BOS/MSS bullish & bearish signals
• Previous Highs/Lows breakouts
• FVGs
⚙️ Parameters Explained
Killzones: start/end times in UTC, colors, extension lines, 50% midline
EQH/EQL: tolerance (0 = strict equality, >0 = margin allowed), expiry age (bars), rejection filter, body/wick break type, latest only toggle
BOS/MSS: swing bars (pivots), body vs wick detection, line styles & widths, only-latest option
OPR: exact UTC time (HH:MM), history toggle, label size/color
Previous Highs/Lows: daily/weekly/monthly levels, line styles, label settings, breakout alerts
FVGs: wick vs body detection, candle highlight color
Alerts: global condition + per-module toggles (sessions, liquidity, BOS/MSS, FVG)
Every parameter is fully customizable, making this SMC indicator adaptable to any trading style or timeframe.
📌 Why use this ICT & SMC indicator?
Saves time by automating repetitive tasks
Provides an institutional framework directly on charts
Keeps analysis structured and consistent
Optimized for intraday scalping and swing trading
⚠️ Disclaimer
This script is for educational purposes only. It does not guarantee profits or predict markets with certainty. Always use proper risk management.
🔑 Access
This is an invite-only script on TradingView.
Click Request Access on this page to apply.

Interval Price AlertsInterval Price Alerts
A versatile indicator that creates horizontal price levels with customizable alerts. Perfect for tracking multiple price levels simultaneously without having to create individual horizontal lines manually.
Features:
• Create evenly spaced price levels between a start and end price
• Customizable price interval spacing
• Optional price labels with flexible positioning
• Alert capabilities for both price crossovers and crossunders
• Highly customizable visual settings
Settings Groups:
1. Price Settings
• Start Price: The lower boundary for price levels
• End Price: The upper boundary for price levels
• Price Interval: The spacing between price levels
2. Line Style
• Line Color: Choose any color for the price level lines
• Line Style: Choose between Solid, Dashed, or Dotted lines
• Line Width: Adjustable from 2-4 pixels (optimized for opacity)
• Line Opacity: Control the transparency of lines (0-100%)
3. Label Style
• Show Price Labels: Toggle price labels on/off
• Label Color: Customize label text color
• Label Size: Choose from Tiny, Small, Normal, or Large
• Label Position: Place labels on Left or Right side
• Label Background: Set the background color
• Background Opacity: Control label background transparency
• Text Opacity: Adjust label text transparency
4. Alert Settings
• Alert on Crossover: Enable/disable upward price cross alerts
• Alert on Crossunder: Enable/disable downward price cross alerts
Usage Tips:
• Great for marking key price levels, support/resistance zones
• Useful for tracking multiple entry/exit points
• Perfect for scalping when you need to monitor multiple price levels
• Ideal for pre-market planning and level setting
Notes:
• Line width starts at 2 for optimal opacity rendering
• Labels can be fully customized or hidden completely
• Alert messages include the symbol and price level crossed

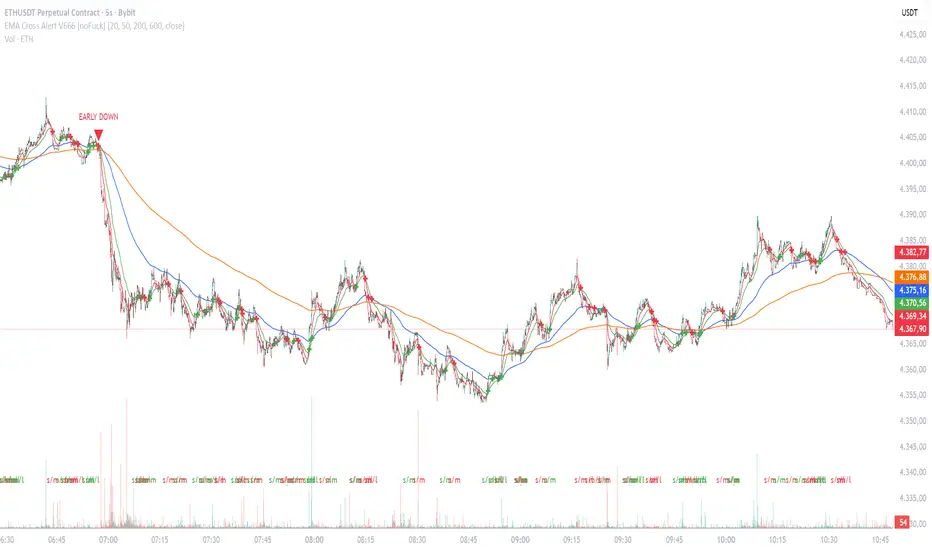
EMA Cross Alert V666 [noFuck]EMA Cross Alert — What it does
EMA Cross Alert watches three EMAs (Short, Mid, Long), detects their crossovers, and reports exactly one signal per bar by priority: EARLY > Short/Mid > Mid/Long > Short/Long. Optional EARLY mode pings when Short crosses Long while Mid is still between them—your polite early heads-up.
Why you might like it
Three crossover types: s/m, m/l, s/l
EARLY detection: earlier hints, not hype
One signal per bar: less noise, more focus
Clear visuals: tags, big cross at signal price, EARLY triangles
Alert-ready: dynamic alert text on bar close + static alertconditions for UI
Inputs (plain English)
Short/Mid/Long EMA length — how fast each EMA reacts
Extra EMA length (visual only) — context EMA; does not affect signals
Price source — e.g., Close
Show cross tags / EARLY triangles / large cross — visual toggles
Enable EARLY signals (Short/Long before Mid) — turn early pings on/off
Count Mid EMA as "between" even when equal (inclusive) — ON: Mid counts even if exactly equal to Short or Long; OFF (default): Mid must be strictly between them
Enable dynamic alerts (one per bar close) — master alert switch
Alert on Short/Mid, Mid/Long, Short/Long, EARLY — per-signal alert toggles
Quick tips
Start with defaults; if you want more EARLY on smooth/low-TF markets, turn “inclusive” ON
Bigger lengths = calmer trend-following; smaller = faster but choppier
Combine with volume/structure/risk rules—the indicator is the drummer, not the whole band
Disclaimer
Alerts, labels, and triangles are not trade ideas or financial advice. They are informational signals only. You are responsible for entries, exits, risk, and position sizing. Past performance is yesterday; the future is fashionably late.
Credits
Built with the enthusiastic help of Code Copilot (AI)—massively involved, shamelessly proud, and surprisingly good at breakfasting on exponential moving averages.
Session & Swing Levels + Smart AlertsMulti-Timeframe Level Tracker with Advanced Alert System
This comprehensive indicator combines session-based trading levels with multi-timeframe swing analysis, for key level identification and alert management.
Key Features:
Session Analysis:
Asia Session (7:00 PM - 4:00 AM ET) - Tracks high/low levels during Asian market hours
London Session (3:00 AM - 11:00 AM ET) - Identifies key European session levels
Previous Day Levels - Displays prior day's high and low levels
Visual session backgrounds and customizable timezone support
Multi-Timeframe Swing Detection:
Up to 5 configurable timeframes (default: 15m, 1h, 4h, 1D, 1W)
Intelligent swing high/low identification using customizable pivot strength
Each timeframe uses distinct colors for easy identification
Advanced Alert System:
Anti-repainting protection - Alerts only trigger on confirmed bars for reliable live trading
Specific alert messages for each level type (Asia High, London Low, Previous Day levels, etc.)
Individual alert toggles for each session and timeframe
Timestamps in Eastern Time for consistency
Visual Customization:
Independent color schemes for sessions and timeframes
Configurable line styles (solid, dashed, dotted) and widths
Separate styling for active vs. mitigated levels
Optional line extension past mitigation points
📊 How It Works:
Level Creation: Automatically identifies and draws key levels at session closes
Mitigation Detection: Monitors price interaction with levels in real-time
Visual Updates: Changes line appearance when levels are crossed
Smart Alerts: Sends targeted notifications with level-specific information

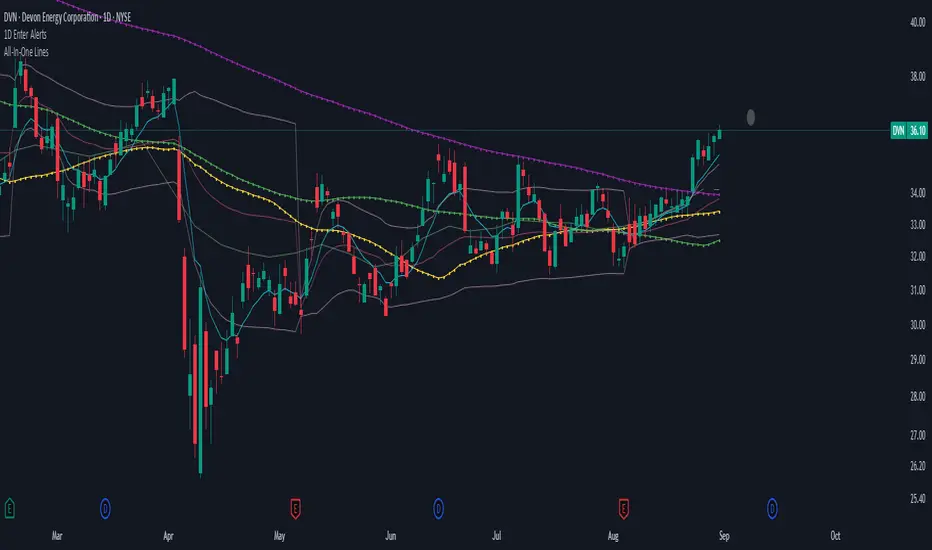
1D Enter AlertsThis is only a remaining of an experiment. I had real swing enter alerts, but it just made more sense to use classic TradingView alerts for horizontal / trendline / SMA breaks.
(Btw you can set up a horizontal alert in TradingView just by hovering the mouse on the chart so it's at the price point you aim for, and pressing "Alt + A").
Once this horizontal alert triggered I would usually wait for confirmation of the move on the 5m. If it's f. e. a break of an SMA and I'm not convinced yet, I might wait until end of the day. For exactly that purpose the following alert comes in handy:
"X Candle Close":
Is triggered 15m before market close - good reminder to check a stock again to see whether a resistance / support break was valid - and the stock should be entered as a swing, or maybe whether it should be closed as a loss.
"Z Trend Change: UP" + "Z Trend Change: DOWN":
Same as on 5m Exit Alert: meant to be only applied on SPY, and to have it set up to never end!
Criteria:
SPY broke through daily EMA 8 or daily SMA today, indicating an important short-term change on the daily chart.
Is triggered 15m before market close
More infos: www.reddit.com
MacD Alerts MACD Triggers (MTF) — Buy/Sell Alerts
What it is
A clean, multi-timeframe MACD indicator that gives you separate, ready-to-use alerts for:
• MACD Buy – MACD line crosses above the Signal line
• MACD Sell – MACD line crosses below the Signal line
It keeps the familiar MACD lines + histogram, adds optional 4-color histogram logic, and marks crossovers with green/red dots. Works on any symbol and any timeframe.
How signals are generated
• MACD = EMA(fast) − EMA(slow)
• Signal = SMA(MACD, length)
• Buy when crossover(MACD, Signal)
• Sell when crossunder(MACD, Signal)
• You can compute MACD on the chart timeframe or lock it to another timeframe (e.g., 1h MACD on a 4h chart).
Key features
• MTF engine: choose Use Current Chart Resolution or a custom timeframe.
• Separate alert conditions: publish two alerts (“MACD Buy” and “MACD Sell”)—ideal for different notifications or webhooks.
• Visuals: MACD/Signal lines, optional 4-color histogram (trend & above/below zero), and crossover dots.
• Heikin Ashi friendly: runs on whatever candle type your chart uses. (Tip below if you want “regular” candles while viewing HA.)
Settings (Inputs)
• Use Current Chart Resolution (on/off)
• Custom Timeframe (when the above is off)
• Show MACD & Signal / Show Histogram / Show Dots
• Color MACD on Signal Cross
• Use 4-color Histogram
• Lengths: Fast EMA (12), Slow EMA (26), Signal SMA (9)
How to set alerts (2 minutes)
1. Add the script to your chart.
2. Click ⏰ Alerts → + Create Alert.
3. Condition: choose this indicator → MACD Buy.
4. Options: Once per bar close (recommended).
5. Set your notification method (popup/email/webhook) → Create.
6. Repeat for MACD Sell.
Webhook tip: send JSON like
{"symbol":"{{ticker}}","time":"{{timenow}}","signal":"BUY","price":"{{close}}"}
(and “SELL” for the sell alert).
Good to know
• Symbol-agnostic: use it on crypto, stocks, indices—no symbol is hard-coded.
• Timeframe behavior: alerts are evaluated on bar close of the MACD timeframe you pick. Using a higher TF on a lower-TF chart is supported.
• Heikin Ashi note: if your chart uses HA, the calculations use HA by default. To force “regular” candles while viewing HA, tweak the code to use ticker.heikinashi() only when you want it.
• No repainting on close: crossover signals are confirmed at bar close; choose Once per bar close to avoid intra-bar noise.
Disclaimer
This is a tool, not advice. Test across timeframes/markets and combine with risk management (position sizing, SL/TP). Past performance ≠ future results.

Smart Bar Counter with Alerts🚀 Smart Bar Counter with Alerts 🚀
-----------------------------------------------------
Overview
-----------------------------------------------------
Ever wanted to count a specific number of bars from a key point on your chart—such as after a Break of Structure (BOS), the start of a new trading session, or from any point of interest— without having to stare at the screen?
This "Smart Bar Counter" indicator was created to solve this exact problem. It's a simple yet powerful tool that allows you to define a custom "Start Point" and a "Target Bar Count." Once the target count is reached, it can trigger an Alert to notify you immediately.
-----------------------------------------------------
Key Features
-----------------------------------------------------
• Manual Start Point: Precisely select the date and time from which you want the count to begin, offering maximum flexibility in your analysis.
• Custom Bar Target: Define exactly how many bars you want to count, whether it's 50, 100, or 200 bars.
• On-Chart Display: A running count is displayed on each bar after the start time, allowing you to visually track the progress.
• Automatic Alerts: Set up alerts to be notified via TradingView's various channels (pop-up, mobile app, email) once the target count is reached.
-----------------------------------------------------
How to Use
-----------------------------------------------------
1. Add this indicator to your chart.
2. Go to the indicator's Settings (Gear Icon ⚙️).
- Select Start Time: Set the date and time you wish to begin counting.
- Number of Bars to Count: Input your target number.
3. Set up the Alert ( Very Important! ).
- Right-click on the chart > Select " Add alert ."
- In the " Condition " dropdown, select this indicator: Smart Bar Counter with Alerts .
- In the next dropdown, choose the available alert condition.
- Set " Options " to Once Per Bar Close .
- Choose your desired notification methods under " Alert Actions ."
- Click " Create ."
-----------------------------------------------------
Use Cases
-----------------------------------------------------
• Post-Event Analysis: Count bars after a key event like a Break of Structure (BOS) or Change of Character (CHoCH) to observe subsequent price action.
• Time-based Analysis: Use it to count bars after a market open for a specific session (e.g., London, New York).
• Strategy Backtesting: Useful for testing trading rules that are based on time or a specific number of bars.
-----------------------------------------------------
Final Words
-----------------------------------------------------
Hope you find this indicator useful for your analysis and trading strategies! Feel free to leave comments or suggestions below.

AMD Liquidity Sweep with AlertsAMD Liquidity Sweep with Alerts
Identify key liquidity levels from the Asian trading session with visual markers and alerts.
📌 Key Features:
Asia Session Detection
Customizable start/end hours (0-23) to match your trading timezone
Automatically calculates session high/low
Smart Swing Level Identification
Finds the closest significant swing high ≥ Asia high
Finds the closest significant swing low ≤ Asia low
Adjustable pivot sensitivity (# of left/right bars)
Professional Visuals
Dashed reference lines extending into the future
Blue-highlighted key levels
Clean label formatting with precise price levels
Trading Alerts
Price-cross alerts for liquidity breaks
Visual markers (triangles) when levels are breached
Separate alerts for buy-side/sell-side liquidity
Customization Options
Toggle intermediate swing highlights
Adjust label sizes
💡 Trading Applications:
Institutional Levels: Identify zones where Asian session liquidity pools exist
Breakout Trading: Get alerted when price breaches Asian session ranges
S/R Flip Zones: Watch how price reacts at these key reference levels
London/NY Open: Use Asian levels for early European session trades
🔧 How to Use:
Set your preferred Asia session hours
Adjust pivot sensitivity (default 1 bar works for most timeframes)
Enable alerts for breakouts if desired
Watch for reactions at the plotted levels

BTC Breakout Alert📈 BTC Breakout & Fakeout Detector with Volume, RSI & MACD Filters
This script helps identify high-confidence breakout setups by combining price action, volume spikes, and optional momentum filters (RSI & MACD). It’s designed to alert you when Bitcoin (or any asset) breaks above a defined resistance level with strong conviction — and warns you if that move turns out to be a fakeout.
🔍 Features:
✅ Confirmed Breakout Alerts: Triggers when price closes above your set resistance level with volume ≥ 1.5× the 20-period average.
⚠️ Fakeout Detection: Highlights when price closes back below resistance within a few candles after breakout.
📊 Momentum Filters:
RSI > 50 for bullish confirmation
MACD line > signal line to support breakout momentum
🔔 Custom Alerts: Built-in alert conditions for both breakout and fakeout events.
🔼🔽 Visual Markers: Arrows plotted directly on the chart for clear entry and caution zones.
🕒 Works on all timeframes and any asset that includes volume data.
Ideal for breakout traders who want more than just a price spike — this tool ensures volume and momentum alignment, helping you reduce false signals and react with more confidence.

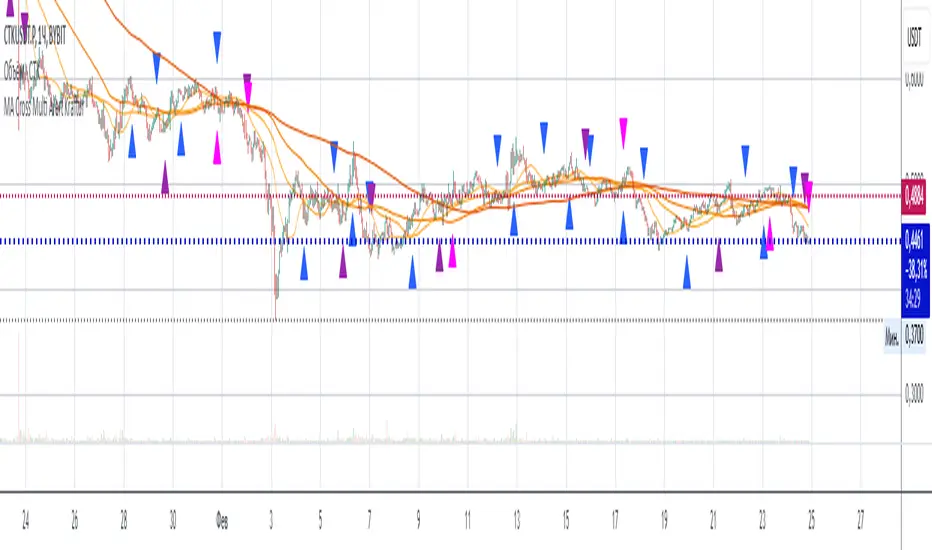
MA Cross Multi Alert KrafturMA Cross Multi Alert Kraftur
Description
The "MA Cross Multi Alert Kraftur" indicator is a versatile tool designed to help traders identify potential buy and sell opportunities based on the crossings of multiple moving averages (MAs). Unlike traditional MA crossover indicators that focus on a single pair of averages, this script offers three distinct crossover levels (e.g., 21/50, 50/90, 50/200) for greater flexibility and precision. It overlays signals directly on the price chart and delivers real-time alerts when crossings occur, making it an excellent choice for traders seeking to pinpoint entry and exit points across various market conditions.
Key Features
Multi-Level Crossovers: Tracks crossings between configurable moving averages (e.g., 21 crossing 50, 50 crossing 90, 50 crossing 200) to detect varying trend strengths and reversals.
Visual Signals: Buy signals are displayed as upward triangles below the bars, and sell signals as downward triangles above the bars, each color-coded for quick recognition.
Real-Time Alerts: Triggers alerts once per bar when a crossover occurs, with a filter to avoid repetitive notifications during minor fluctuations.
Customizable: Adjustable MA lengths, timeframe, and signal colors allow tailoring to individual trading preferences and strategies.
Recommended Usage
This indicator shines as a scanning tool for identifying trade setups across multiple assets. Apply it to your watchlist of stocks, forex pairs, or cryptocurrencies, and set up alerts to catch crossover signals in real time. It performs exceptionally well in trending or consolidating markets and can be paired with additional tools (e.g., trendlines, RSI, or volume analysis) to validate signals and boost reliability. Ideal for multi-timeframe traders or those managing diverse portfolios.
How to Use
Add the indicator to your chart.
Adjust the MA lengths (e.g., 21, 50, 90, 200), timeframe, and signal colors to align with your trading approach.
Configure alerts for the indicator and apply them to your asset watchlist.
Watch for buy (upward triangles) and sell (downward triangles) signals on the chart, or rely on alert notifications for timely updates.
Perfect for day traders, swing traders, or anyone aiming to streamline signal detection and automate their workflow!
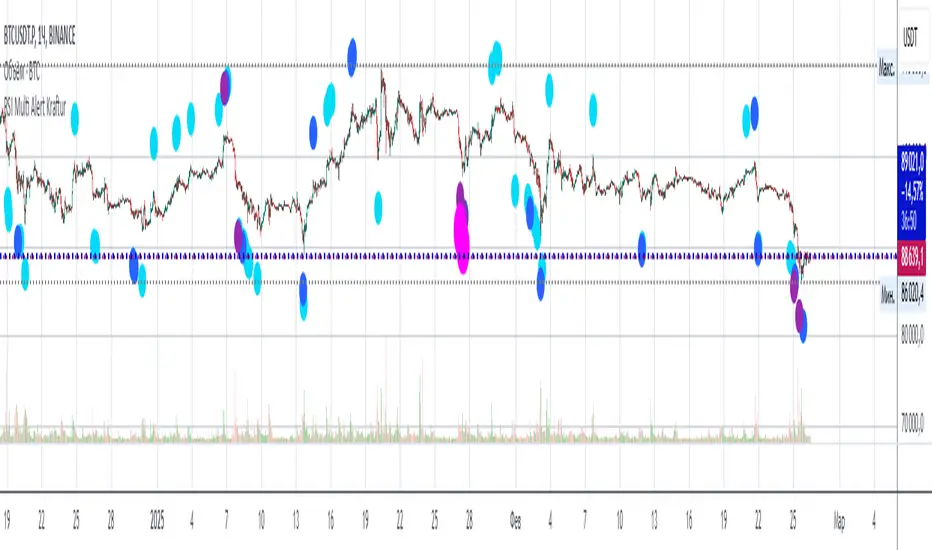
RSI Multi Alert KrafturRSI Multi Alert Kraftur
Description
The "RSI Multi-Level Signals" indicator is designed to help traders identify potential buy and sell opportunities based on RSI (Relative Strength Index) crossings of multiple customizable levels. Unlike traditional RSI indicators that focus on single overbought/oversold thresholds (e.g., 70/30), this script stands out by offering four distinct buy and sell levels for enhanced flexibility and precision. It plots signals directly on the price chart and provides real-time alerts when RSI crosses these levels, making it a powerful tool for spotting entry and exit points.
Key Features
Multi-Level RSI: Configurable buy levels (e.g., 30, 25, 20, 15) and sell levels (e.g., 70, 75, 80, 85) to capture varying degrees of overbought and oversold conditions.
Visual Signals: Buy signals are marked with circles below the bars, and sell signals above the bars, each color-coded for easy identification.
Real-Time Alerts: Generates alerts once per bar when RSI crosses a level, with a filter to prevent duplicate signals during oscillations.
Customizable: Adjustable RSI length, timeframe, and level colors to suit different trading strategies.
Recommended Usage
This indicator is best used as a scanning tool for finding entry points across multiple assets. Set up alerts for your entire watchlist of coins or stocks to detect when RSI crosses the configured levels in real time. It’s particularly effective in volatile markets or for traders employing multi-timeframe analysis. Combine it with other indicators (e.g., support/resistance or trend filters) to confirm signals and improve accuracy.
How to Use
Apply the indicator to your chart.
Customize the RSI length, timeframe, and signal levels to match your trading style.
Set up alerts for the indicator and apply them to your watchlist of assets.
Monitor the chart for buy (green) and sell (red) signals, or rely on alert notifications.
Perfect for scalpers, swing traders, or anyone looking to automate signal detection across a portfolio!
RSI Alerts – Live & ConfirmedThe RSI Alerts – Live & Confirmed indicator enhances the traditional Relative Strength Index (RSI) by providing real-time alerts and confirmed breakout signals when RSI reaches key levels. It also features a dynamic RSI line color change for better visualization.
Key Features:
✅ Live & Confirmed Alerts:
Live Alert Mode: Triggers when RSI touches overbought (70) or oversold (30).
Confirmed Alert Mode: Triggers only when RSI closes above/below these levels, reducing false signals.
✅ Dynamic RSI Line Coloring:
Above 70: RSI turns green, indicating an overbought condition.
Below 30: RSI turns red, indicating an oversold condition.
Between 30 and 70: RSI remains blue, its normal color, ensuring no color leaks into invalid zones.
✅ Customizable RSI Settings:
Adjustable RSI length, overbought/oversold levels, and alert preferences.
Mid-Level (50) line for trend bias reference.
This indicator is perfect for traders who rely on RSI signals and want clear visual cues and real-time alerts for improved decision-making.

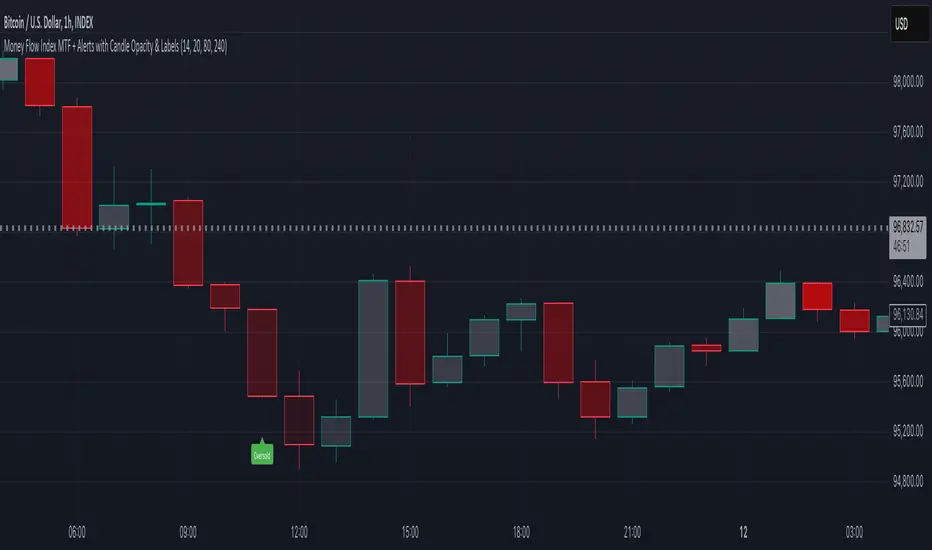
Money Flow Index MTF + Alerts with Candle Opacity & LabelsHow to Use the Money Flow Index MTF + Alerts with Candle Opacity & Labels Indicator
Overview:
This indicator is designed to help you gauge the buying and selling pressure in a market by using the Money Flow Index (MFI). Unlike many momentum oscillators, the MFI incorporates both price and volume, providing a unique perspective on market activity. It is particularly useful when you want to visually assess potential overbought or oversold conditions.
Indicator Components:
Money Flow Index (MFI) Calculation:
The indicator computes the MFI using a user-defined look-back period (default is 14 bars). The MFI is scaled between 0 and 100, where values above 80 typically indicate overbought conditions and values below 20 suggest oversold conditions.
Multi-Timeframe (MTF) Capability:
You can choose to calculate the MFI using either the current chart’s timeframe or a custom timeframe (for example, a 4-hour chart). This flexibility allows you to compare longer-term money flow trends against your primary trading timeframe.
Candle Opacity Based on MFI:
The opacity of the candles on your chart is dynamically adjusted based on the current MFI reading. When the MFI is high (near 100), candles become more opaque; when the MFI is low (near 0), candles appear more transparent. This visual cue can help you quickly spot changes in market momentum.
Visual Labels for Overbought/Oversold Conditions:
When the MFI crosses into the overbought territory, a red label reading “Overbought” is displayed above the high of the bar. Similarly, when it crosses into the oversold territory, a green label reading “Oversold” is placed below the low of the bar. These labels provide an immediate visual alert to potential reversal points or areas of caution.
Alert Conditions:
The script also includes alert conditions for both overbought and oversold signals. You can set up TradingView alerts so that you are notified in real time when the indicator detects these conditions.
Theory Behind the Money Flow Index (MFI):
The Money Flow Index is a momentum oscillator that uses both price and volume to signal the strength behind price moves.
Overbought Conditions: When the MFI is above 80, it suggests that buying pressure is very strong and the asset might be due for a pullback or consolidation.
Oversold Conditions: Conversely, when the MFI falls below 20, selling pressure is high and the asset might be oversold, potentially priming it for a bounce.
Keep in mind that in strong trending markets, overbought or oversold readings can persist for extended periods, so the MFI should be used in conjunction with other technical analysis tools.
Position Management Guidance:
While the indicator is useful for spotting potential overbought and oversold conditions, it is not designed to serve as an automatic signal to completely close a position. Instead, you might consider using it as a guide for pyramiding—gradually adding to your position over several days rather than exiting all at once. This approach allows you to better manage risk by:
Scaling In or Out Gradually: Instead of making one large position change, you can add or reduce your position in increments as market conditions evolve.
Diversifying Risk: Pyramiding helps you avoid the pitfalls of trying to time the market perfectly on a single trade exit or entry.
How to Get Started:
Apply the Indicator:
Add the indicator to your TradingView chart. Adjust the input settings (length, oversold/overbought levels, and resolution) as needed for your trading style and the market you’re analyzing.
Watch the Candles:
Observe the dynamic opacity of your candles. A sudden change in opacity can be a sign that the underlying money flow is shifting.
Monitor the Labels:
Pay attention to the “Overbought” or “Oversold” labels that appear. Use these cues in combination with your broader analysis to decide if it might be a good time to add to or gradually exit your position.
Set Up Alerts:
Configure TradingView alerts based on the indicator’s alert conditions so that you are notified when the MFI reaches extreme levels.
Use as Part of a Broader Strategy:
Remember, no single indicator should dictate your entire trading decision. Combine MFI signals with other technical analysis, risk management rules, and market insights to guide your trades.
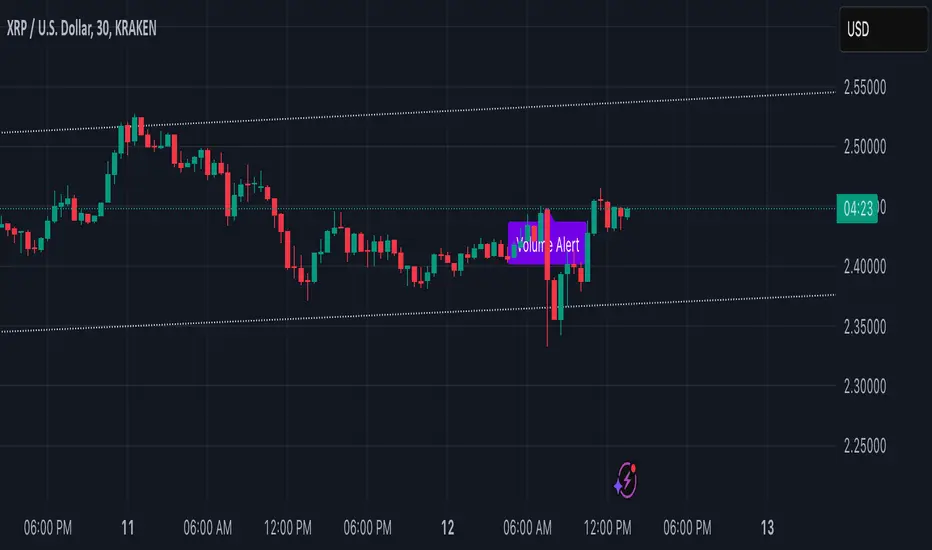
Volume Alert with Adaptive Trend - MissouriTimElevate your market analysis with our "Volume Alert with Adaptive Trend" indicator. This powerful tool combines real-time volume spike notifications with a sophisticated adaptive trend channel, providing traders with both immediate and long-term market insights. Customize your trading experience with adjustable volume alert thresholds and trend visualization options.
Features Summary
Volume Alert Features:
Volume Spike Detection:
Alerts you when volume exceeds a user-defined multiplier of the 20-period Simple Moving Average (SMA) of volume, helping identify potential market interest or significant price movements.
Visual Notification:
A "Volume Alert" label appears on the chart in a striking purple color (#7300E6) with white text, making high volume bars easily noticeable.
Customizable Sensitivity:
The volume spike threshold is adjustable, allowing you to set how sensitive the alert should be to volume changes, tailored to your trading strategy.
Alerts:
An alert condition is set to notify you when a volume spike occurs, ensuring you don't miss potential trading opportunities.
Adaptive Trend Features
Adaptive Channel:
Visualizes market trends through a dynamic channel that adjusts to price movements, offering insights into trend direction, strength, and potential reversal points.
Lookback Period:
Choose between short-term or long-term trend analysis with a toggle that adjusts the calculation period for the trend channel.
Channel Customization:
Fine-tune the trend channel with options for deviation multiplier, line styles, colors, transparency, and extension preferences to match your visual trading preferences.
Non-Repainting:
The trend lines are updated only on the current bar, ensuring the integrity of historical data for backtesting and strategy development.
Integrated Utility
Combination of Tools: This indicator marries the immediacy of volume alerts with the strategic depth of trend analysis, offering a comprehensive view of market dynamics.
User Customization: With inputs for both volume alerts and trend visualization, the indicator can be tailored to suit various trading styles, from scalping to swing trading.
This indicator ensures you're always in tune with market movements, providing crucial information at a glance to inform your trading decisions.
True Strength Index with Zones & AlertsKey Features:
True Strength Index (TSI) Calculation
Uses double-smoothed exponential moving averages (EMA) to calculate TSI.
A signal line (EMA of TSI) helps confirm trends.
Dynamic Color Coding for TSI Line
Green: TSI is above the signal line (Bullish).
Red: TSI is below the signal line (Bearish).
Crossover & Crossunder Signals
Bullish Crossover (TSI crosses above Signal Line) → Green Circle.
Bearish Crossunder (TSI crosses below Signal Line) → Red Circle.
Alerts for Trading Signals
Buy Alert: TSI crosses above the signal line.
Sell Alert: TSI crosses below the signal line.
Overbought & Oversold Zones
Overbought: Between 40 and 50 (Red Zone).
Oversold: Between -40 and -50 (Green Zone).
Highlighted Background when TSI enters these zones.
Neutral Line at 0
Helps determine trend direction and momentum shifts.
How to Use These Values:
• TSI Crosses Above Signal Line → Bullish entry.
• TSI Crosses Below Signal Line → Bearish entry.
• Overbought (+40 to +50) & Oversold (-40 to -50) zones → Watch for trend reversals.
• Divergence Signals → If price makes a new high/low but TSI doesn’t, momentum is weakening.

Candle Ratio Alert**Candle Ratio Alert System for Multi-Pair, 5-Minute Charts**
This Pine Script indicator is designed for traders who want to monitor specific candle patterns across multiple assets on a 5-minute timeframe. The tool calculates the ratio of the candle's body size to its total wick size, allowing you to identify significant candles based on their structure. It is ideal for strategies that rely on candlestick analysis, such as breakout or reversal trading.
### Key Features:
1. **Customizable Threshold**: Set the body-to-wick ratio using an input slider, ensuring flexibility to match your strategy.
2. **Visual Alerts**: The script plots a purple marker above candles that meet the specified criteria, making it easy to spot qualifying patterns at a glance.
3. **Dynamic Alerts**: Integrated alert functionality notifies you via email or app when a candle satisfies the ratio condition. Alerts include the asset's ticker and timeframe for quick action.
4. **Multi-Pair Capability**: Compatible with assets like XAUUSD, BTCUSD, EURUSD, and GBPUSD, making it versatile for Forex and cryptocurrency trading.
### How It Works:
The script calculates the body size and total wick size of each candle. If the ratio exceeds the user-defined threshold, the script triggers a visual marker and sends an alert. The 5-minute timeframe ensures rapid identification of trading opportunities in volatile markets.
With its intuitive interface and powerful alert system, this tool streamlines your trading workflow, helping you stay focused on key market movements. Perfect for both beginners and experienced traders seeking precision and efficiency in their analysis.

Auto Trend Lines Breakouts and Bounces Signals and AlertsAuto Trend Lines Breakout with Confirmation Bounce Signals and Alerts
This indicator draws trend lines automatically based on the 2 pivot points, which are calculated based on the specified number of bars (length), which is of course customizable. The indicator then shows you when these trend lines get touched (potential bounce) or “almost touched” (Yes! The script can do that as well!) by the current price of the instrument or broken and then confirmed by the “after break come back touch” – classic! Everything is shown on the chart, and for everything - alarms can be set up with just a few clicks!
Now there are 2 modes here (you can hide all signals as well and just use the trend lines):
1) Current/recent trend lines only: will only show 2 current upper/lower trend lines as well as previous 2 for reference.
2) All time (historical) trend lines: will show 2 current upper/lower trend lines as well as the historical lines from the past and these lines are often very respected by the price!
Besides that, you can set the indicator to show you exactly what you want: Just the trend lines touches/bounces, breaks with confirmation touches/bounces or BOTH.
In addition to that, you can set the indicator to only show you these touches/bounces and breaks with additional confirmations, only if confirmed by :
- Moving Average (customizable length): LONG signals based off the trend lines will only be shown if above EMA, SHORT if below.
- Signals where the candle color confirms the direction of the trade, but the candle type is opposite (like a green colored bearish hammer for example) will be avoided (such candles can be very uncertain/deceptive)
- Signals where the signal candle is doji will be avoided (uncertain)
- Signals will only be shown if supported by the trend line slope (for example, with this feature turned on, if there is an upper line trend line, but the line is actually above, touching the top of the candles and the price touches/crosses it or it gets broken – there will be no signal as even though the trend line is an upper line above candles, it’s slope is positive (going up), if the slope would be down, like a classical down/bearish trend line and the price touches/bounces off it or the line gets broken, only then the indicator will show the signal/alert.
- OFFSET: this one is really cool! With this feature you can hunt these conditions when the price comes very near the trend line, but never touches it. With this setting turned on, with a correct offset amount – you will be able to catch these! You will need to play around with the offset amount, depending on the timeframe/instrument, be quick-n-easy!
The indicator also includes Round Number lines on the chart, which are customizable for any instrument. As you know round numbers are appreciated by the price and can be very nicely used with this indicator looking for combos or using trend lines for signals, while round numbers as partial profit price targets or stop-loss areas.
Important economic events are also shown on the chart as red vertical lines (during these events, volatility can suddenly spike, so it’s best to stay away from trading!)
This is a very powerful indicator with plenty of customizations to find the best approaches, can be used for any instrument and on any timeframe! Awesome for scalping and could be used with swing trading as well! Enjoy!
To add the alerts
-Right-click anywhere on the TradingView chart
-Click on Add alert
-Condition: Auto Trend Lines Breakout with Confirmation Bounce Signals and Alerts
-Alert name: DO NOT TOUCH THIS
-Hit “Create”
-Note: If you change ANY Settings within the indicator – you must DELETE the current alert and create a new one per steps above, otherwise it will continue triggering alerts per old Settings!
A few strategies how this indicator can be used (these were actually tested and showed awesome results!):
1) Bounce Scalping: Simply hunting bounces off the trend lines. Often the price will slightly cross the trend line and then immediately bounces from it for nice little price move, which is great for scalping or if you for example take 2/3s off the position and leave the remaining, often with such bounces – the price may reverse from the trend line and go in the opposite direction considerably.
2) Break-Bounce-Confirm: this is the “Breaks with Confirmation Bounce” option of the script which fully automates the classical trend lines break confirmation, where the trend line is broken (which could be a fake out), so you wait for a touch/bounce of that trend line back from the initial break and open the position right there or wait and see if after the touch/bounce back, the price once again goes into the direction of the break.
For stop-loss and take-profit areas, you can use:
1) Pivots (these are marked with red and green crosses on the chart), which are used to draw the actual trend lines.
2) The actual trend lines themselves (if one gets broken + confirmation, you can set your stop-loss if that same line gets broken again in the opposite direction | similar for take-profit, you can take profit or partial profit at next trend line on the chart if the price reaches it.
3) Use the Round Numbers included, for example: use the closest round number as a visual soft stop-loss and the furthest one away as a visual soft take-profit.
You can try combining this indicator with divergence, stochastic, Bollinger bands, pretty much anything!
If you wish to try this out for a week or so – please reach out and I will give you access.

Pivots High-Low Screener & AlertsHi fellow traders ,
Pleased to share a Pivot High - Low Screener.
The script uses the TV inbuilt Pivot function.
It Screens 25 tickers default set, these can be modified in the input dialog box.
All you need to do is attach to any chart and set the periodicity or the resolution of the chart to your desired alert() frequency requirement.
Now go to the input settings icon of the script and set your Pivot right and left parameters!
Set the alert from the menu as usual click - Any alert() function call and bingo you are done!!
Similarily change the chart periodicity to the next timeframe and set the next alert.
No more opening multiple charts and setting individual time consuming alerts().
You will get concatenated alerts or summary alerts for your tickers.
Track 25tickers with a single alert for each timeframe(Supports 40 tickers).
Happy trading with TV..

Pivot Reversal Strategy + alerts via TradingConnector to indicesSoftware part of algotrading is simpler than you think. TradingView is a great place to do this actually. To present it, I'm publishing each of the default strategies you can find in Pinescript editor's "built-in" list with slight modification - I'm only adding 2 lines of code, which will trigger alerts, ready to be forwarded to your broker via TradingConnector and instantly executed there. Alerts added in this script: 14 and 22.
How it works:
1. TradingView alert fires.
2. TradingConnector catches it and forwards to MetaTrader4/5 you got from your broker.
3. Trade gets executed inside MetaTrader within 1 second of fired alert.
When configuring alert, make sure to select "alert() function calls only" in CreateAlert popup. One alert per ticker is required.
Adding stop-loss, take-profit, trailing-stop, break-even or executing pending orders is also possible. These topics have been covered in other example posts.
This routing works for Forex, indices, stocks, crypto - anything your broker offers via their MetaTrader4 or 5.
Disclaimer: This concept is presented for educational purposes only. Profitable results of trading this strategy are not guaranteed even if the backtest suggests so. By no means this post can be considered a trading advice. You trade at your own risk.
If you are thinking to execute this particular strategy, make sure to find the instrument, settings and timeframe which you like most. You can do this by your own research only.
