Session Breakout, Retest, Reversal + Large Move Alert# Script Description for Publication
## Script Name
**Session Breakout, Retest, Reversal + Large Move Alert**
## Short Description
A professional trading indicator that identifies session breakouts, failed retests, and large intraday price movements across any futures contract with real-time alerts and visual markers.
## Long Description
This comprehensive indicator combines session analysis with dynamic move detection, designed for active traders monitoring ES, NQ, GC, CL, and other futures contracts.
**Core Features:**
**Session Tracking:**
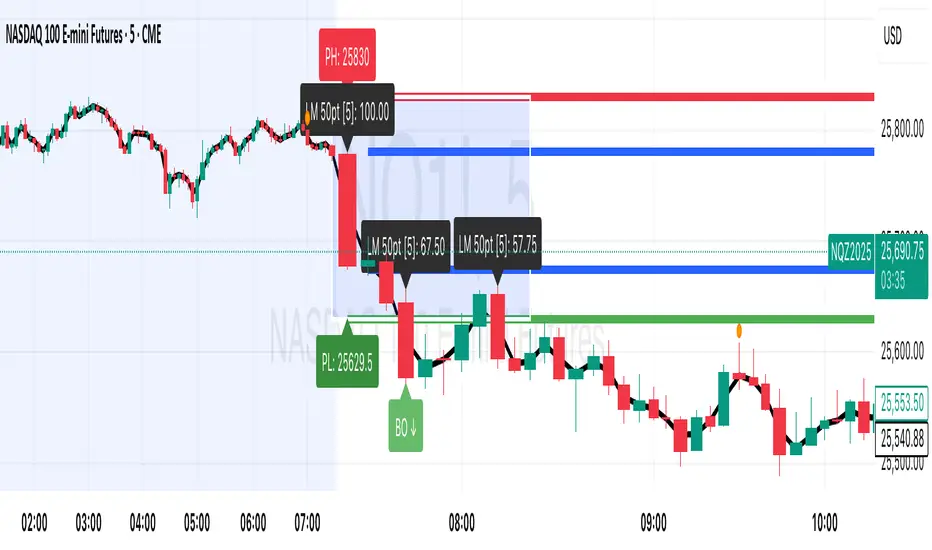
Automatically identifies and marks daily session breakouts and failed retests based on user-defined session times and timezones. The indicator draws visual boxes showing session highs (PH) and lows (PL), with labels marking breakout (BO) and retest failure (RF) points.
**Dynamic Large Move Detection:**
Monitors candles on any chart interval for significant price movements. The threshold is fully customizable per futures contract (default 15 points for ES/NQ/GC). When a candle closes with a move exceeding the threshold, the indicator displays a "BO" label with the exact move size and current chart timeframe.
**Real-Time Alerts:**
Triggers active alerts whenever large moves are detected, allowing traders to receive instant notifications via TradingView's alert system for timely entry or exit opportunities.
**Multi-Timeframe Compatible:**
Works seamlessly on any chart interval (1-minute through daily and beyond) without manual adjustments. The detection threshold automatically applies to the current chart's candles, with labels displaying the active timeframe.
**Universal Futures Support:**
Configurable for any futures contract by adjusting the point threshold input parameter based on each contract's typical volatility.
## Key Inputs
| Input | Default | Purpose |
|-------|---------|---------|
| Session Time | 0400-0930 | Defines trading session hours (pre-market session) |
| Session Timezone | America/New_York | Sets timezone for session detection |
| Point Move Threshold | 15.0 | Minimum point move to trigger alert (adjust per futures: ES=15, GC=15, CL=1.5) |
## How to Use
1. **Add to Chart:** Search for this indicator in TradingView and add it to your futures chart (ES, NQ, GC, CL, etc.)
2. **Configure Inputs:**
- Set session start/end times for your preferred trading session
- Adjust point threshold based on your futures contract
- Verify timezone matches your trading location
3. **Create Alerts:**
- Click "Create Alert" on the chart
- Select "Large Move Alert" from the condition dropdown
- Choose notification method (push, email, or SMS)
- Set desired frequency
4. **Monitor Moves:**
- Watch for "BO" labels appearing on confirmed candles
- Each label shows the threshold value and actual move size
- Combine with your existing trading strategy for confirmation
## Visual Elements
- **Session Box:** Blue shaded area showing session high/low range
- **PH Label:** Green label marking session high (pivot high)
- **PL Label:** Red label marking session low (pivot low)
- **BO ↑/↓ Labels:** Lime/red labels marking session breakouts
- **RF Labels:** Yellow/orange labels marking failed retests
- **Large Move Labels:** Green (bullish) or red (bearish) labels showing threshold breaches with move size
## Ideal For
- Scalpers monitoring quick intraday moves
- Day traders tracking pre-market breakouts
- Futures traders on ES, NQ, GC, CL, and other contracts
- Multi-timeframe traders watching various chart intervals simultaneously
- Alert-based automated trading systems
## Technical Details
- **Pine Script Version:** 5
- **Overlay:** Yes (displays on price chart)
- **Historical Buffer:** 5000 bars (supports 1-minute and lower timeframes)
- **Compatibility:** All futures contracts and chart intervals
## Disclaimer
This indicator is provided for educational and informational purposes only. It is not financial advice. Users should conduct their own research and consult with financial professionals before making trading decisions. Past performance does not guarantee future results.
---
在腳本中搜尋"alert"
Trey London + NY Open AlertsThis is a indicator that alerts you when London & New York opens everyday of the week.
Instructions are included if any confusion:
- Adjust Timezones:
UTC Offset
Change this if your broker’s chart is in a different timezone.
Example: 2 for UTC+2 (default).
- Enable / Disable Alerts:
Visual Alerts (Labels)
Toggle On/Off to show labels above/below candles.
Sound Alerts
Toggle On/Off to play an alert sound when a session starts
- Using Alerts:
Go to TradingView Alerts (⏰).
Create a new alert and select:
Condition: London Open or New York Open
Action: Show pop-up, play sound, or send notification.
Alerts will trigger exactly at the session start.
Expiration: set the date as far back as you can and the time to around 23:00. You will have renew the alert after Expiration or update it to a later time.
(These things may be upgraded in the future if subscription is upgraded.)

How to consolidate multiple alerts into oneHow to consolidate multiple alerts into a single alertcondition().
The solution consists of two parts:
1 - consolidate the alert conditions
2 - consolidate the alert types used in the alert message
Part two is harder to accomplish because the message to display when the alert fires must be const string.
However, we can use numbers.
The structure:
▪ 1 and 0 are used in formatting the message
▪ 111 - Enter Long
▪ 222 - Exit Long
▪ 333 - Enter Short
▪ 444 - Exit Short
Alert Message Example:
- method 2 (1 0111 0222 0333 0444) is equivalent to (enterLong exitLong enterShort exitShort)
- method 3 (1111) (2222) (3333) (4444) is equivalent to (enterLong exitLong enterShort exitShort)
It can help save time managing alerts, and it can also save precious real estate on your UI.

QQE Cross Indicator Alert v2.0 by JustUncleLThis version of the indicator makes a distinction between the types of QQE cross alerts on the chart and now only recommends the Thresh Hold channel exit crosses for BUY/SELL alerts, the other two types of crosses are still there to provide pre-warning of pending BUY/SELL alerts. Also only the BUY/SELL alerts are filtered by Moving Average Filter and/or the new Directional filter (default). The default settings in this version have also been changed, particularly the Moving Averages, to indicate trend changes quicker.
Indicator Project Description:
*** This is a trend following indicator alert that uses fast QQE crosses with Moving Averages for trend direction filtering. QQE or Qualitative Quantitative Estimation is based on the relative strength index, but uses a smoothing technique as an additional transformation. Three crosses can be selected (all selected by default):
RSI signal crossing ZERO (XZERO)
RSI signal crossing Fast RSIatr line (XQQE)
RSI signal exiting the RSI Threshhold Channel (BUY/SELL)
The (BUY/SELL) alerts can be optionally filtered by the Moving Average Combo:
For BUY alert the Close must be above the fast MA and
fast MA (EMA8) > medium MA (EMA20) > slow MA (SMA50).
For SELL alert the Close must be below the fast MA and
fast MA (EMA8) < medium MA (EMA20) < slow MA (SMA50).
and/or Directional filter (default filter):
For BUY alert the Close must be above the slow MA (SMA50) and the directional MA (EMA20) must be green.
For SELL alert the Close must be below the slow MA (SMA50) and the directional MA (EMA20) must be red.
The XZERO and XQQE are not included in the filtering, they are used to indicate pending BUY/SELL alerts, particularly the XZERO.
Note: I have found the XQQE cross can also be quite good alert for BUY/SELL as well, particularly in direction of current trend. The XZERO I have found to be totally unreliable for BUY/SELL alerts.
This indicator should work on any currency pair, most chart timeframes and expiry in 3 to 6 candles for binary option trading. For hourly or longer charts expiry can be longer for binary options, or if available use standard forex trading techniques
Some Hints for using this indicator:
Avoid taking trades in non-trending market, this is normally indicated by a near Horizontal SMA50 line.
Avoid trading when all the moving averages are close together.
When trading 1min and 5min charts, expiry should set to 1-3 candles.
Avoid trading when market choppy, this is normally indicated by the fast EMA8 crossing the EMA20 back and forwards quickly.
High probability trades tend to occur when you get a XQQE followed by a XZERO and then BUY/SELL in the same direction of trend.
Don't trade near nor directly on any major market news (sometime better no trade day).
Please practise this system in DEMO first, before committing any real money. Be patient the more you practise the better and more confident you will be.
I hope you enjoy this indicator, it has proven very effective for me.

Traders Dynamic Index Indicator Alert v0.1 by JustUncleLThis is a trend trading indicator+alert utilising the Traders Dynamic Index (TDI), Price Action Channel (PAC) and Heikin Ashi candles.
About 6months ago I came across the use of TDI in "E.A.S.Y. Method" that I found in forexfactory forums: www.forexfactory.com
and I was able to set up a chart based on the specifications by using Kurbelklaus scripts. However, I found that the alerts were being generated one or two bars too late, so at that time I was not successful using it with Binary Options. A few months later I found a variation of the method in the forecfactory forums which is able to generate the alerts a bit earlier, so this indicator is a modification of that early detection version.
The indicator can optionally use Heikin Ashi candles only for all it's calculation. I would recommend viewing the chart with Heikin Ashi candles, these smooth out the trends and makes trends very clear.
I found that this method it works good with most currency pairs or commodities and with 5min+ timeframe charts. I would suggest expiry of 2 to 6 candles.
ALERT GENERATION:
=================
The TDI (Traders Dynamic Index)
---------------------------------------------
Volatility Band VB(34), color: Blue, buffer: UpZone, DnZone
Relative Strength Index RSI(13)
RSI PRICE LINE (2), color: Green, buffer: mab
RSI TRADE SIGNAL LINE (7), color: Red, buffer: mbb
MARKET BASE LINE MID VB(34), color: Orange, buffer: mid
Indicator SignalLevels:
-------------------------------
RSI_OversoldLevel : 22 (normally: 32)
RSI_OverboughtLevel : 78 (normally: 68)
Alert Conditions:
-----------------------
Strong Buy : yellow
Medium Buy : aqua
Weak Buy : blue
Strong Sell : fuchsia
Medium Sell : purple
Weak Sell : black
Hints on How to use:
----------------------------
- When a Medium or Strong alert is generated and MACD histogram colour matches the direction
of the alert (optional auto filter), then place trade in direction of alert candle and MACD.
- I use the multi-Hull MA's for overall trend direction confirmation.
- Best positions normally occur near the MACD(5,15,1) Histogram crossing the zero line.
- The optional coloured Dots along the bottom of the indicator represent the first alert
of this type that was generated in this sequence.
- It is advisable to trade in the direction of the main trend as indicated the HULL MA red cloud:
if red cloud underneath PAC then BULLISH trend, if red cloud above PAC then BEARISH trend.
- Selecting the HeiKin Ashi candles does affect the MACD and MA caculations, so if you select
normal candles the result chart will change. You can still Optionally select to use Heikin Ashi
for calculations.
- When using the Heikin Ashi candles, a good buy entry is indicated by long top wick and no bottom wick
for bull (green) candles and good sell entry is indicated by long bottom wick and no top wick for
bear (red) candles.
- When the MACD histogram is flat and close to zero line,
this indicates a ranging market, do NOT trade when this occurs.
- When the PAC channel on the main chart is spread apart widely, this is an indication
of extreme volatility and choppy chart, do NOT try to trade during these periods.
A choppy chart is also indicated by Heikin Ashi candles with long wicks on both sides
of the candles.
- You can specify what strength level Alerts are generated (default 2):
Level (1) means only generate Strong Alerts only.
Level (2) means generate Strong and Medium Alerts.
Level (3) means generate Strong, Medium and Weak Alerts.

FOMO Alert (Miu)This indicator won't plot anything to the chart.
Please follow steps below to set your alarms based on price range variation:
1) Add indicator to the chart
2) Go to settings
3) Choose timeframe which will be used to calculate bars
4) Choose how many bars which will be used to calculate max and min range
5) Choose max and min range variation (%) to trigger alerts
5) Choose up to 6 different symbols to get alert notification
6) Once all is set go back to the chart and click on 3 dots to set alert in this indicator, rename your alert and confirm
7) You can remove indicator after alert is set and it'll keep working as expected
What does this indicator do?
This indicator will generate alerts based on following conditions:
- If min and max prices reach the range (%) from amount of bars on timeframe set for any symbol checked it will trigger an alert.
- If next set of bars reaches higher range than before it will trigger an alert with new data
- If next set of bars doesn't reach higher range than before it will not trigger alerts, even if they are above the range set (this is to prevent the alert to keep triggering with high frequency)
Once condition is met it will send an alert with the following information:
- Symbol name (e.g: BTC, ETH, LTC)
- Range achieved (e.g: 3,03%)
- Current symbol price and current bar direction (e.g: 63,477.1 ▲)
This script will request lowest and highest prices through request.security() built-in function from all different symbols within the range set. It also requests symbols' price (close) and amount of digits (mintick) for each symbol to send alerts with correct value.
This script was developed with main purpose to send alerts when there are strong price movements and I decided to share with community so anyone can set different parameters for different purposes.
Feel free to give feedbacks on comments section below.
Enjoy!

Crossover Alerts for Yesterday O/H/L/C , Today Vwap [Zero54]This is a very simple script/indicator that trigger alerts every time the script triggers the following conditions.
1) Script crosses yesterday's (previous day's) high
2) Script crosses yesterday's (previous day's) low
3) Script crosses yesterday's (previous day's) open
4) Script crosses yesterday's (previous day's) close
5) Script crosses today's vwap.
I developed this to keep track of the scripts I follow and I find it useful. Hope you will find it useful too.
Steps to use:
1) Open the ticker for which you want to set the alerts.
2) Add this indicator to the chart.
3) Right Click on the text and set choose "Add Alert"
4) After you have done with setting up the alert, feel free to remove the indicator from the chart. It is not necessary for the indicator to be added in the chart in order for it to work.
5) Repeat 1-4 for all the scripts for which you want to set the alerts.
Be advised: During market open, if you have set alerts for multiple scripts, a tsunami of alerts may be triggered.
If you like this alert indicator, please like/boost it. Feel free to re-use this code however you may wish to. Cheers!

MultiPrice AlertThis is an alert script using Pinescript version 4. This enables one to set 5 alerts (1 StopLoss, 4 Targets), on 3 different symbols, at using a single alert in the UI.
Every visible line will only appear on the symbols that are selected. After setting targets when making an alert, select this indicator as a condition. Change the name to whatever you want, usually the names of the set of tickers.
The Alert message is dyanmic showing which Symbol with each type of alert, at whatever price.
Ability to disable the targets + symbols.
Alerts work by Stop Loss crossing under price and Targets Cross Over. Enabling the "Short" Targets reverses this.
The line that is being displayed is actually the price of the asset being moved over x number of bars. I have not found a way to plot a traditional horizontal line, as the code for it uses a fixed price.
As it being a user input, it is a variable. Any help with this would be appreicated.
Alerts are set to once per bar.
Known bug that sometimes if the prices that you set are inside the current candle stick, then your alert will immeaditally fire, either change the timeframe or let it fire and wait fo
After a target is hit, I reccomend setting the alert to 0 and REMAKING the alert. You MUST REMAKE THE ALERT AFTER ANY CHANGES. This script WILL NOT CHANGE ALERTS AS YOU CHANGE SETTINGS.
TradingView Alerts are not this smart , at least I haven't found a way to do this yet.

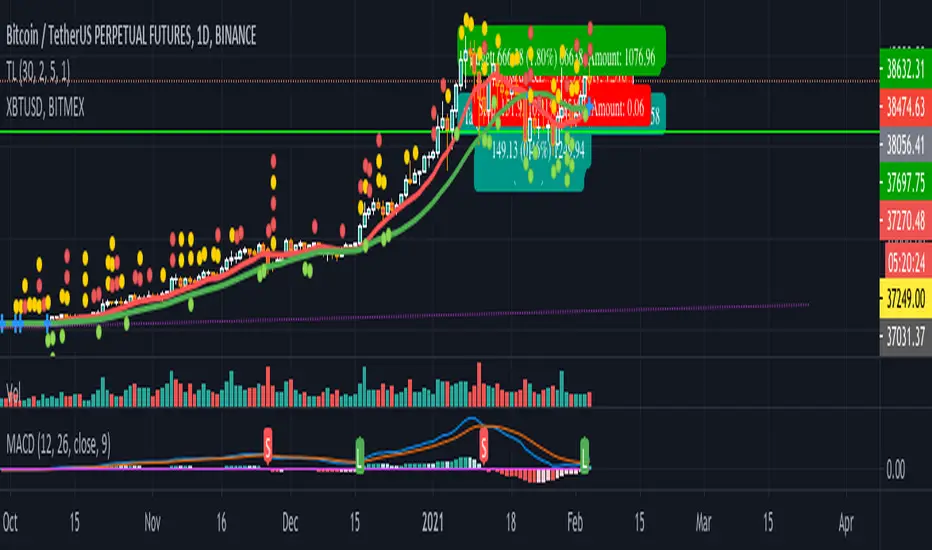
MACD signal with alert (long/short/close) for TV free accountSend MACD alert through email (available for free/pro user):
// 3 - buy
// -2 - short
// 0 - close position
// 1 - ignore
Example buy signal
Alert: STRAT3. BINANCE:BTCUSDTPERP, price = 31080
Example sell signal
Alert: STRAT-2. BINANCE:BTCUSDTPERP, price = 31080
Example close signal
Alert: STRAT0. BINANCE:BTCUSDTPERP, price = 31080
Example ignore signal
Alert: STRAT1. BINANCE:BTCUSDTPERP, price = 31080
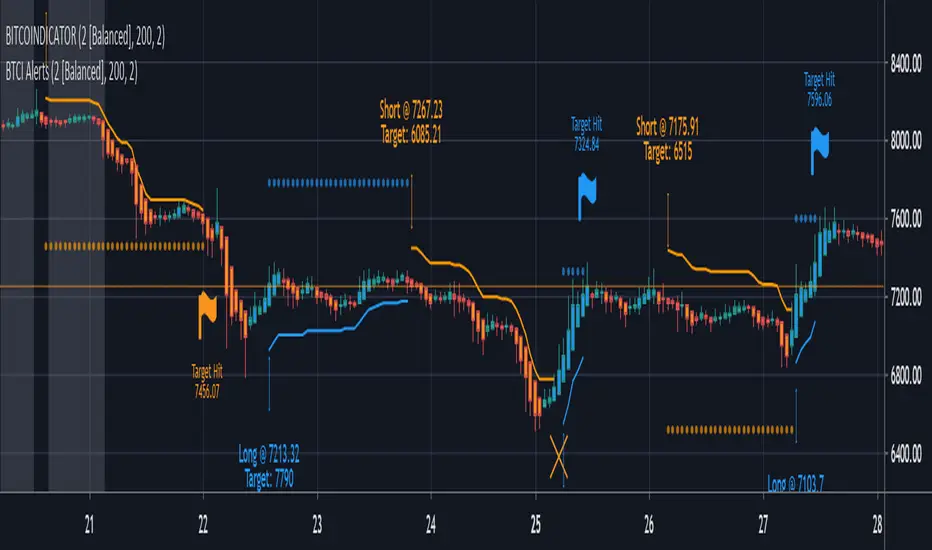
BITCOINDICATOR AlertsAdd this indicator to your chart to set up alerts for BITCOINDICATOR.
Alerts will tell you when to buy long and when to sell short.
They can also be used simply as entry/exit notifications or trend confirmation.
Unless you are a day trader, we recommend you only set up alerts for higher time frames to limit notifications.
How to use:
- In the top right of your chart, click the alarm clock symbol.
- Click the set alert "+" symbol next to Manage Alerts.
- In the pop-up box, change the condition to BTCI Alerts.
- Choose the alert you want - Buy Long or Sell Short.
- Choose ONLY either Once Per Bar or Once Per Bar Close.
Note: If you choose Once Per Bar, you will receive an alert the instant the trade condition is met. However, if the trade condition is unmet again in the same bar and stays unmet until the bar closes, the real-time price label generated by BITCOINDICATOR will have flickered out and the trade signal will be invalidated. This option is for more aggressive traders as it gets you into the trade earlier, but adds some risk.
- Adjust additional inputs and a custom message (we recommend to add your time frame to your message if you have multiple alerts set up).
- Click Create
*Bitcoindicator Alerts is part of the Bitcoindicator package and should only be used with BITCOINDICATOR.
For detailed information on Bitcoindicator and how to add it to your charts, please visit:
www.bitcoindicator.com
BollingerBands Strat + pending order alerts via TradingConnectorSoftware part of algotrading is simpler than you think. TradingView is a great place to do this actually. To present it, I'm publishing each of the default strategies you can find in Pinescript editor's "built-in" list with slight modification - I'm only adding 2 lines of code, which will trigger alerts, ready to be forwarded to your broker via TradingConnector and instantly executed there. Alerts added in this script: 14, 17, 20 and 23.
SCRIPT INCLUDES PENDING ORDERS AND ALERTS! Alert will be sent to MetaTrader when order is triggered, but not yet filled. That means if market conditions change and order does not get filled, it needs to be cancelled as well, and there are alerts for that in the script as well.
How it works:
1. TradingView alert fires.
2. TradingConnector catches it and forwards to MetaTrader4/5 you got from your broker.
3. Trade gets executed inside MetaTrader within 1 second of fired alert.
When configuring alert, make sure to select "alert() function calls only" in CreateAlert popup. One alert per ticker is required.
Adding stop-loss, take-profit, trailing-stop, break-even or executing pending orders is also possible. These topics have been covered in other example posts.
This routing works for Forex, indices, stocks, crypto - anything your broker offers via their MetaTrader4 or 5.
Disclaimer: This concept is presented for educational purposes only. Profitable results of trading this strategy are not guaranteed even if the backtest suggests so. By no means this post can be considered a trading advice. You trade at your own risk.
If you are thinking to execute this particular strategy, make sure to find the instrument, settings and timeframe which you like most. You can do this by your own research only.

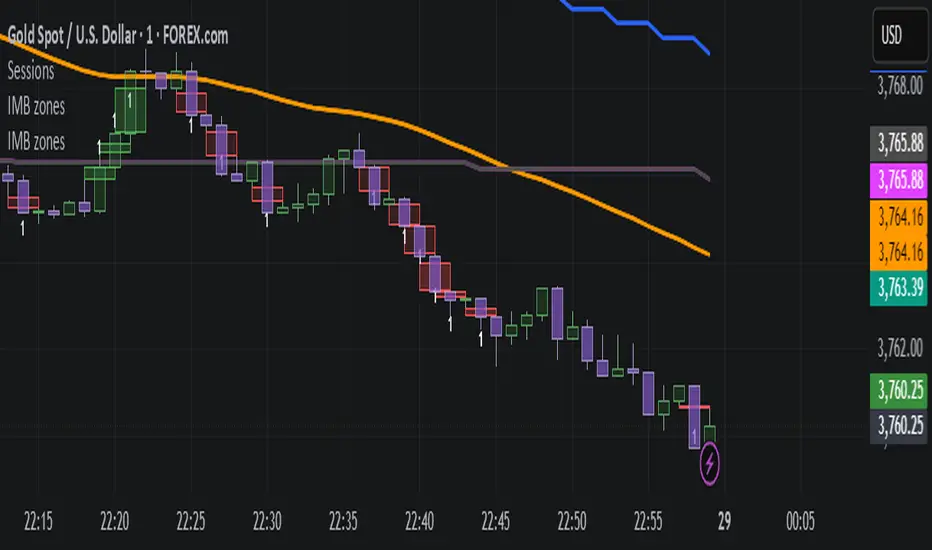
IMB zones, alerts, 8 EMAs, DO lvlThis indicator was created to be a combined indicator for those who use DO levels, IMBs, and EMAs in their daily trading, helping them by providing a script that allows them to customize these indicators to their liking.
Here you can set the IMBs, DO levels, and EMAs. Its special feature is that it uses alerts to indicate which IMB zones have been created, along with the invalidation line for the new potential IMB.
The program always calculates the Daily Opening (DO) level from the opening of the broker, and you can set how many hours the line should be drawn.
Help for use:
There are 3 types of alerts:
- Use the "Bullish IMB formed" alert if you are looking for Bull IMBs.
- Use the "Bearish IMB formed" alert if you are looking for Bear IMBs.
- Use the "Either IMB" alert if you are looking for Bull and Bear IMBs.
Tip: Set the alert type "Once per bar close" if you do not want to set new alerts after an IMB is formed.
IMBs:
- Customizable IMB quantity (1-500 pcs)
- Zone colors and borders can be customized
- Potential IMB line can be customized
EMAs:
- You can set and customize 8 EMA lengths
- Only the current and higher timeframe EMAs are displayed
Daily Open Level:
- Displays today's Daily Open level
- Note: The DO level does not work in Replay mode
Last OFR:
"Show True OFR" checkbox added.
It displays the latest OFR, and hides the old ones.
Consecutive Up/Down Strat + alerts via TradingConnector to ForexSoftware part of algotrading is simpler than you think. TradingView is a great place to do this actually. To present it, I'm publishing each of the default strategies you can find in Pinescript editor's "built-in" list with slight modification - I'm only adding 2 lines of code, which will trigger alerts, ready to be forwarded to your broker via TradingConnector and instantly executed there. Alerts added in this script: 12 and 15.
How it works:
1. TradingView alert fires.
2. TradingConnector catches it and forwards to MetaTrader4/5 you got from your broker.
3. Trade gets executed inside MetaTrader within 1 second of fired alert.
When configuring alert, make sure to select "alert() function calls only" in CreateAlert popup. One alert per ticker is required.
Adding stop-loss, take-profit, trailing-stop, break-even or executing pending orders is also possible. These topics have been covered in other example posts.
This routing works for Forex, indices, stocks, crypto - anything your broker offers via their MetaTrader4 or 5.
Disclaimer: This concept is presented for educational purposes only. Profitable results of trading this strategy are not guaranteed even if the backtest suggests so. By no means this post can be considered a trading advice. You trade at your own risk.
If you are thinking to execute this particular strategy, make sure to find the instrument, settings and timeframe which you like most. You can do this by your own research only.

RSI Strategy with alerts via TradingConnector to ForexSoftware part of algotrading is simpler than you think. TradingView is a great place to do this actually. To present it, I'm publishing each of the default strategies you can find in Pinescript editor's "built-in" list with slight modification - I'm only adding 2 lines of code, which will trigger alerts, ready to be forwarded to your broker via TradingConnector and instantly executed there. Alerts added in this script: 12 and 17.
How it works:
1. TradingView alert fires.
2. TradingConnector catches it and forwards to MetaTrader4/5 you got from your broker.
3. Trade gets executed inside MetaTrader within 1 second of fired alert.
When configuring alert, make sure to select "alert() function calls only" in CreateAlert popup. One alert per ticker is required.
Adding stop-loss, take-profit, trailing-stop, break-even or executing pending orders is also possible. These topics have been covered in other example posts.
This routing works for Forex, indices, stocks, crypto - anything your broker offers via their MetaTrader4 or 5.
Disclaimer: This concept is presented for educational purposes only. Profitable results of trading this strategy are not guaranteed even if the backtest suggests so. By no means this post can be considered a trading advice. You trade at your own risk.
If you are thinking to execute this particular strategy, make sure to find the instrument, settings and timeframe which you like most. You can do this by your own research only.

BTC & ETH Alert SystemWith Tradingview's free plan, only one alert is allowed. The purpose of this indicator is to allow for two alerts--one for BTC and one for ETH.
How to use the alert system:
1. Set the desired value for BTC and ETH that you want to be alerted for
2. Set an alert on the indicator by clicking the three ellipses and then "Add Alert"
3. Set the alert to go off if the value of the indicator is greater than 0.
The example is of BTC using an alert of $10,000 and an alert of ETH at $2,000 (untriggered)
The script can be easily modified to be used for different assets

inwCoin HMA AlertSimple alert to go along with the inwCoin HMA Strategy
Please not that the alerts are persistent 2.70% , if you already enter the position,
just ignore the rest of the same alert until the opposite alert show up
( long then short / or short then long , if change, just close and enter opposite position )
You can set the alert and let it tell you to iOS app via TradingView app ( yey! )
Please note that, if you don't have bot to track your trailing start/stop. you have to enter the TP/SL manually ( also tracking the position )
So... be careful to follow this alert. just try it with small amount of money first.
and make sure to set stop loss every time because OKEX is a portfolio killer if you don't have any stop loss.
** if you cannot trailing stop bot, just uncheck the "Aggressive Strategy" in both strategy and alert to reduce alert to minimum level.

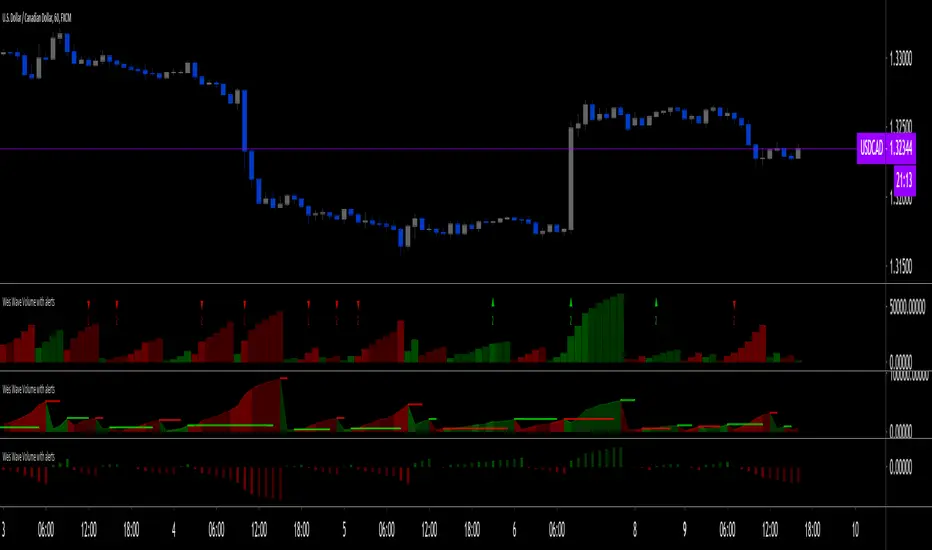
Weis Wave Volume with alert [LazyBear]LFI added alert conditions to LazyBear's indicator on the second bar of a turn to bullish or bearish.
To use alerts:
be sure you are on the interval you want to create your alert,
be sure the indicator inputs are the way you want them,
create an alert, choose this indicator and then choose one of the 2 conditions.
Changes to the inputs after an alert was created require alerts to be recreated.
The alerts trigger on the second bar to avoid noise.
I also changed the default aesthetics, but more importantly the default period (from 2 to 5, because that's what I use most often).
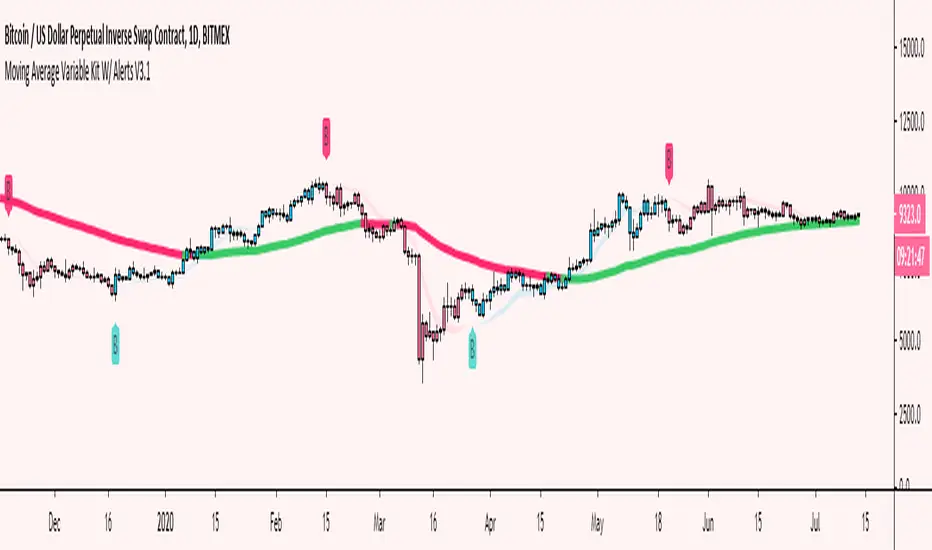
Moving Average Variable Kit W/ Alerts V3 [Moon]Create your own MA system
5 basic kinds of Moving Average types available for now
DEMA
EMA
SMA
TEMA
WMA
Mix and match moving average types and lengths.
Create your own alerts built into Tradingview.
Turn alerts or MAs off or on with 1 click.
Choose visual transparency and alert coloration - everything is customizable.
Trend candles on crossovers.
Choose your MA input source.
Create your own MA cloud or cloud ribbons.
Trend MA coloration on candle or bar interactions.
It really empowers you to experiment and create your own trading system or strategy.
Don't be afraid to use Renko or Heikin Ashi for trend spotting or reversals.
Copy built in exchange bands or indicators for an edge up on the competition or exchange users (these are heavily watched and in my opinion do affect the price action especially on smaller coins like alts).
This is Binance's default kit that you can easily make (7/25/99) SMAs.
Works well on traditional markets or Forex | Should be cross compatible on any asset or timeframe.
Turn off a majority of signals except for "buy" or "sell" alerts. Use these clusters to DCA, short, long or take profit.
Use it to monitor classic "Golden" or "Death" crosses - Set a TV alert to get a notification when it official goes off.
These are just a few of the things you can create. I encourage you to explore further.
Send me a DM if interested.
BB and RSI Indicator Alert v0.3 by JustUncleLI have just recently revised this indicator alert for public release. This is for the 60sec Bollinger Band break Binary Option traders.
This indicator alert is a variation of one found in a well known Broker's marketing videos. It uses Bollinger bands, RSI and moving averages. Included is a pre-warning alert condition. The strategy and settings are designed for 1min charts and Binary Options, but it could work for up to 15 min charts.
The default settings are BB(14,2) and RSI(11) with 75/25 Levels boundaries. To be a valid trade the RSI needs to be within 75/25 channel. The optional Market direction filter is enabled by default and is calculated by two EMA (200 and 50):
When 200ema rising and 50ema above 200ema then market going up.
When 200ema falling and 50ema below 200ema then market going down.
A potential Bollinger Break reversal trades identified by shapes: The purple diamond is the pre-warning purple alert and the green and red pointers with the PUT/CALL labels are the trade alerts. Make Binary Option trade in specified direction 60sec (or can also use 120sec trade without Martingale).
* Notes and Hints *
The original videos specified a Martingale money management strategy, be careful using this management. When I use Martingale I recommend go to 3 levels: 10, 25, 65 if no win at 65 stop trading this alert and start next alert back at 10, you should recovery loss by future wins given you are able to get a reasonable ITM rate with this strategy. Alternatively instead of using Martingale use 120sec Binary Option trade.
Be wary of break alerts on a steep Bollinger, they tend to keep running away for awhile, especially if steep on both sides of Bollinger channel.
As with most of this style of indicator the alert conditions will redraw until the candle is closed. For me this is okay, as it is an Alert is only to a potential trade and final decision to trade is made by me.
You need to practise this and be aware of market news, sessions boundaries, slow trading periods etc. Plan your periods of when you should trade, I prefer Asian session before lunch and London sessions.

EMA 8/21 Crossover Alert IndicatorOverview of the Indicator
This is a custom Pine Script v5 indicator for TradingView titled "EMA 8/21/50 + VWAP Crossover Alert Indicator" (short title: "EMA+VWAP Cross Alert"). It's designed as an overlay indicator, meaning it plots directly on your price chart rather than in a separate pane. The primary purpose is to detect and alert on crossovers between the 8-period Exponential Moving Average (EMA) and the 21-period EMA, which can signal potential bullish or bearish momentum shifts. These are classic short-term trend reversal or continuation signals often used in trading strategies like momentum or swing trading.
To enhance analysis, it also includes:
A 50-period EMA for medium-term trend context (e.g., to confirm if the overall trend aligns with the crossover).
A Volume Weighted Average Price (VWAP) line, which provides a benchmark for the average price weighted by volume, useful for identifying intraday value areas or fair price levels.
The indicator works across all timeframes (e.g., Daily, 4H, 1H, 15M, 5M, 3M) because the calculations are based on the chart's current bars and adapt to volatility and data resolution. It's not a trading strategy (no entry/exit logic or backtesting), but an alert tool—signals are visual and can trigger notifications in TradingView. Always combine it with risk management, as crossovers can produce false signals in ranging or choppy markets.
How It Behaves Across Timeframes
Higher Timeframes (e.g., Daily/4H): Fewer crossovers, focusing on major trends. EMAs smooth out noise; VWAP might represent session averages.
Lower Timeframes (e.g., 3M/5M): More frequent signals due to sensitivity, but higher risk of whipsaws. VWAP resets per session, making it great for intraday trading.
Adaptability: All components scale with bar data—no manual adjustments needed, though tweaking inputs can optimize for specific frames.
In TradingView, you can set up these alerts to notify via popup, sound, email, SMS, or webhook (e.g., to a trading bot). Go to the chart's "Alert" button, select this indicator, and choose conditions like "Bullish Cross" or use the script's built-in alerts.

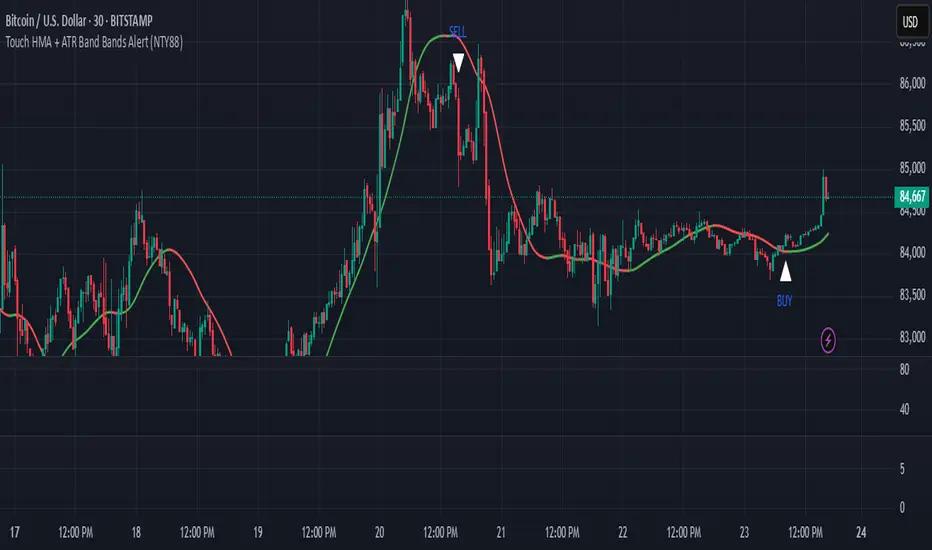
Touch HMA + ATR Band Bands Alert (NTY88)🔔 Precision Alerts | No Repainting | ATR-Based Touch Detection | HMA Trend Coloring
This script is a clean and powerful tool designed to help you catch precise market reversals using ATR Band touches combined with trend-following logic.
📌 How It Works
A custom Hull Moving Average (HMA) is used to track the trend.
Two dynamic ATR-based bands are drawn above and below the HMA.
A signal is generated when the closing price touches the upper or lower ATR band within a small tolerance zone.
✅ Key Features
🔁 Alternating Signals: Only one Buy → then one Sell → then Buy again. No signal spam.
🟢🔴 Color-Changing HMA Line: Green = HMA rising | Red = HMA falling
📏 Price Tolerance Input: Define how close the candle must be to the ATR band to trigger a signal.
🔔 Real-Time Alerts: Easily set alerts for Buy and Sell signals — works in live markets.
🚫 No Repainting: All signals are confirmed at candle close and will not change afterward.
🎯 When to Use
Great for trend reversals, scalping zones, or identifying potential exhaustion points.
Works well on any timeframe or market (crypto, stocks, forex).
💬 Pro Tip:
Combine this with RSI, Volume, or ADX filters to build a complete confluence system.
📈 Built for traders who love clean logic, precision entries, and visual clarity.
Timed AlertTradingView doesn't offer a way easily set timed alerts. This script solves that problem and also allows you to set variables in the script similar to other alerts.
The variables can be found here .

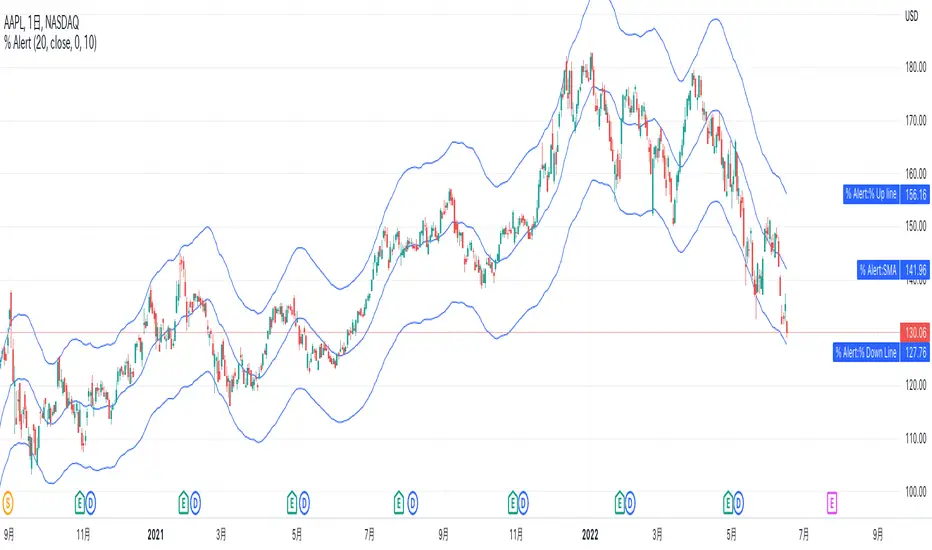
% up/down from SMA AlertsHi all! This script allows an alert option for conditions when the price increase 10% from the SMA and when price decrease 10% from the SMA.
The SMA length defaults to 20, but can be set to any length of your preference at “length” in the inputs tab of the script settings.
Value that increase and decrease 10% from SMA is able to visualize with a line but it can also be hidden in the Style tab.
Also, the default is 10%, but you can set % value of your preference such as 2%, 5%, at "% value" in the inputs tab.
For example with the default settings, if you set the alert condition "% up SMA" in the Alert settings dialog, this alert will be triggered when the price increase 10% from SMA. "% down SMA" will be triggered when the price decrease 10% from SMA.
-----------
このスクリプトは、価格がSMAから10%上昇した時と、10%下降した時の条件のアラートオプションを可能にします。
SMAの期間はデフォルトで20ですが、スクリプト設定のパラメータータブにある「期間」でお好みの期間に設定できます。
そしてこのSMAから10%上昇した値と下降した値は、ラインで視覚的に表示されますが、タイルタブで非表示に指定することも可能です。
また、デフォルトは10%ですが、2%や5%などと、パラメータータブにある「% value」でお好みの%値を設定する事ができます。
例えばデフォルト設定の場合、アラート設定ダイアログで条件を「% up SMA」で設定した場合は、もし価格がSMAから10%上昇したらアラートがトリガーされます。
「% down SMA」を指定した場合は、もし価格がSMAから10%下降したらアラートがトリガーされます。