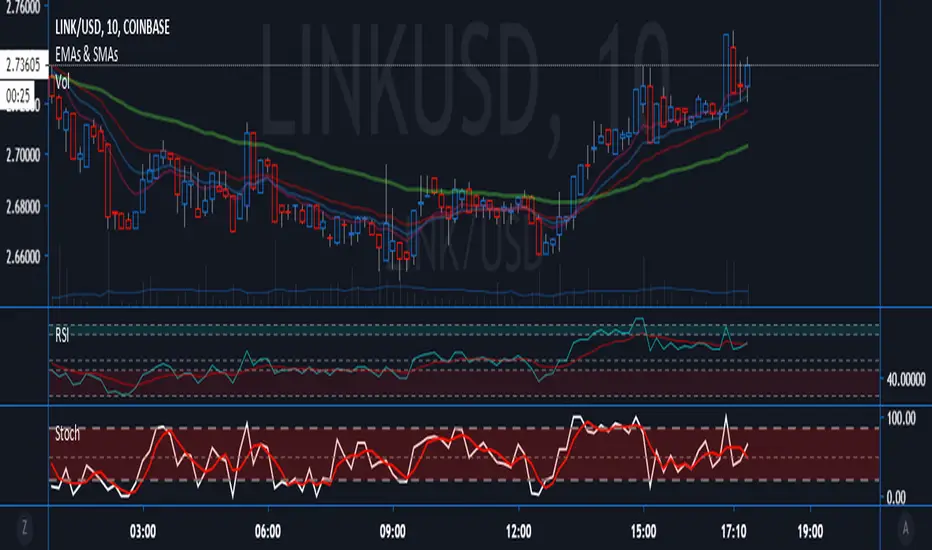
RSI ZonesThis is a combination of a couple ideas I saw on here. The result is from three configurable EMA smoothed RSI overbought/oversold zones. The default is set to Donchian Channel mode where the highs/lows of the RSI's are plotted. An optional basis line derived from the slowest RSI is also included. Toggling this mode off gives you different results.
You'll want to play with different lengths for your own preferences and to see what works best for you.
Being able to see price bounce between these zones should hopefully give you some ideas on how you could potentially use this.
Credit to LazyBear for the initial idea.
在腳本中搜尋"zone"
Bitcoin Power Law Zones (Dunk)Introduction When viewed on a standard linear chart, Bitcoin’s long-term price action can appear chaotic and exponential. However, when analyzed through the lens of physics and network growth models, a distinct structure emerges.
This indicator implements the Bitcoin Power Law , a mathematical model that suggests Bitcoin’s price evolves in a straight line when plotted against time on a "log-log" scale. By calculating parallel bands around this regression line, we create a "Rainbow" of valuation zones that help investors visualize whether the asset is historically overheated, undervalued, or sitting at fair value.
The Math Behind the Model The Power Law dictates that price scales with time according to the formula: Price = A * (days since genesis)^b
This script uses the specific parameters popularized by recent physics-based analyses of the network: Slope (b): 5.78 (Representing the scaling law of the network adoption). Amplitude (A): 1.45 x 10^-17 (The intercept coefficient).
While simple moving averages react to price, this model is predictive based on time and network growth physics, providing a long-term "gravity" center for the asset.
Guide to the Valuation Zones
Upper Bands (Red/Orange): Extr. Overvalued, High Premium, Overvalued. Historically, these zones have marked cycle peaks where price moved too far, too fast ahead of the network's steady growth. The Baseline (Black Line): Fair Value. The mathematical mean of the Power Law. Price has historically oscillated around this line, treating it as a center of gravity. Lower Bands (Green/Blue): Undervalued, Discount, Deep Discount. These zones represent periods where the market price has historically lagged behind the network's intrinsic value, often marking accumulation phases.
Note: The lowest theoretical tiers ("Bitcoin Dead") have been trimmed from this chart to focus on relevant historical support levels.
How to Use Logarithmic Scale: You MUST set your chart to "Log" scale (bottom right of the TradingView window) for this indicator to function correctly. On a linear chart, the bands will appear to curve upwards aggressively; on a Log chart, they will appear as smooth, parallel channels. Timeframe: This is a macro-economic indicator. It is best viewed on Daily or Weekly timeframes. Overlay Labels: The indicator includes dynamic labels on the right-side axis, allowing you to instantly see the current price requirements for each valuation zone without manually tracing lines.
Credits This script is based on the Power Law theory popularized by Giovanni Santostasi and the original Corridor concepts by Harold Christopher Burger .
Disclaimer This tool is for educational and informational purposes only. It visualizes historical mathematical trends and does not constitute financial advice. Past performance of a model is not indicative of future results.
Further Reading
www.hcburger.com
giovannisantostasi.medium.com

Delta Zones Smart Money Concept (SMC) UT Trend Reversal Mul.Sig.🚀 What's New in This Version (V5 Update)
This version is a major overhaul focused on improving trade entry timing and risk management through enhanced UT Bot functionality:
Integrated UT Trailing Stop (ATR-based): The primary trend filter and moving stop-loss mechanism is now fully integrated.
Pre-Warning Line: A revolutionary feature that alerts traders when the price penetrates a specific percentage distance (customizable) from the UT Trailing Stop before the main reversal signal fires.
"Ready" Signal: Plots a "Ready" warning label on the chart and triggers an alert condition (UT Ready Long/Short) for pre-emptive trade preparation.
V5 Compatibility: All code has been optimized for Pine Script version 5, utilizing the modern array and type structures for efficient Order Block and Breaker Block detection.
💡 How to Use This Indicator
This indicator works best when confirming signals across different components:
1. Identify the Trend Bias (UT Trailing Stop)
Uptrend: UT Trailing Stop line is Green (Focus only on Buy/Long opportunities).
Downtrend: UT Trailing Stop line is Red (Focus only on Sell/Short opportunities).
2. Prepare for Entry (Warning Line)
Action: When you see the "Ready" label or the price hits the Pre-Warning Line (Dotted Orange Line), this is your alert to prepare for a trend flip, or to tighten the stop on your current trade.
3. Confirm the Entry (Multi-Signals)
Look for a primary entry signal that aligns with the desired trend:
High-Conviction Entry: Wait for the UT Buy/Sell label (confirmed trend flip) AND a Combined Buy/Sell arrow (confirmed by your selected Oscillator settings).
High-Liquidity Entry: Look for a Delta Zone Box forming near an active Order Block or Breaker Block (SMC zones), and then confirm with a UT or Combined Signal.
4. Manage Risk (Trailing Stop)
Always set your initial Stop Loss (SL) either just outside the opposite Order Block or at the UT Trailing Stop level itself.
If the price closes back across the UT Trailing Stop, exit your position immediately, as the trend bias has officially shifted.
Features & Components
1. Delta Zones (Liquidity/Wick Pressure)
Identifies periods of extreme buying or selling pressure based on wick-to-body ratios and standard deviation analysis.
Plots colored pressure boxes (Buy/Sell) to highlight potential exhaustion points or institutional activity.
2. Smart Money Concepts (SMC)
Automatically detects and plots Order Blocks (OBs) and Breaker Blocks (BBs) based on confirmed Market Structure Breaks (MSBs).
Includes Chop Control logic to remove less reliable Breaker Blocks.
3. UT Bot Trailing Stop & Warning Line
UT Trailing Stop (ATR-based): Plots a dynamic trend line (Green/Red) that acts as a moving stop-loss and primary trend filter.
Ready/Warning Signals: Alerts traders (via the "Ready" label and orange lines) when the price enters a "Pre-Reversal Zone" near the Trailing Stop.
4. Multi-Indicator Confirmation (Filters)
Includes customizable signals based on the crossover/crossunder of RSI, CCI, and Stochastic indicators against configurable Overbought/Oversold levels.
Allows selection of combination signals (e.g., RSI & CCI, All Combined, etc.) for high-conviction entries.

Order Block Zones (Multi, Retest Highlight & Invalidation)A easy OB identificator with the conditon that it should be followed with at-least three strong/weak candles. Highlighted when re-tested (search for entry) and unvalidated once the "opposite" candle closes above/under the zone. Zones valid for 5 days then deleted.
V0.1

Smart Inside Bar Zones by Dinkan🔹 How It Works
An Inside Bar is formed when a candle’s high and low are completely within the previous candle’s range.
The indicator detects this structure in real time, creates a visual box around it, and extends the zone until the pattern is broken.
Inside Bar candles can be optionally highlighted with a custom color to make them stand out clearly on the chart.
🔹 Features
✅ Automatic Inside Bar detection
✅ Dynamic Inside Bar zone boxes with custom fill & border color
✅ Inside candle body highlighting with user-defined color
✅ Adjustable transparency and border style
✅ Option to display only the latest Inside Bar zone for cleaner charts
🔹 Usage
Traders can use Inside Bar zones to:
Study price compression and breakout regions
Observe range behavior and trend continuation setups
Combine with other tools like volume or support/resistance analysis
🔹 Customization
Change box fill and border color
Adjust Inside Candle color for better visibility
Set transparency and choose whether to show all or only the latest box
⚠️ Disclaimer
This script is intended for market structure visualization and educational purposes only.
It does not generate trading signals or financial advice.
Always perform your own analysis and risk management before making trading decisions.

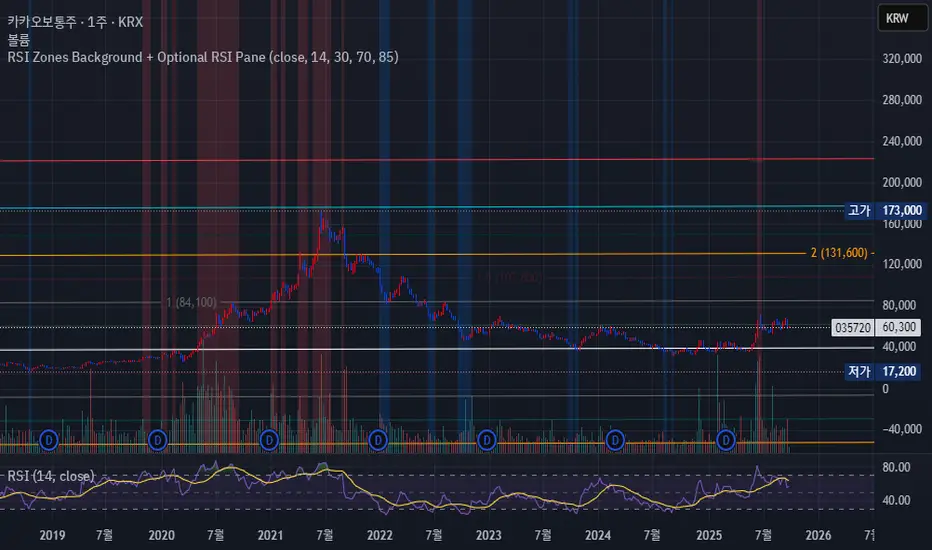
RSI Zones Background + Optional RSI PaneOverview
This Pine Script indicator does two things at once:
Colors the background of the main price chart whenever the RSI value is below a lower threshold (default 30) or above an upper threshold (default 70). This highlights oversold and overbought zones directly on the price chart itself.
Optionally displays a separate RSI panel with the RSI line and shaded region between the two threshold levels for reference.
The indicator is fully customizable through the settings panel—color choices, transparency, and whether to show the separate RSI pane can all be adjusted.
Key Parts of the Code
1. Inputs
src: The source price series for RSI calculation.
len: RSI lookback length (default 14).
lowerThr and upperThr: The lower and upper thresholds (defaults: 30 and 70).
lowColor and highColor: Colors for the background when RSI is below or above the thresholds.
bgTrans: Transparency level for the background shading.
showRSI: Boolean to toggle the optional RSI pane on or off.
2. RSI Calculation
rsi = ta.rsi(src, len)
This computes the RSI from the chosen price source.
3. Background Coloring on the Price Chart
bgCol = rsi <= lowerThr ? color.new(lowColor,bgTrans) :
rsi >= upperThr ? color.new(highColor,bgTrans) :
na
bgcolor(bgCol)
If RSI ≤ lower threshold: background turns lowColor (oversold zone).
If RSI ≥ upper threshold: background turns highColor (overbought zone).
Otherwise, no background color.
4. Optional RSI Pane
plot(showRSI ? rsi : na, display=display.pane)
Plots the RSI line in a separate pane when showRSI is true; otherwise hides it.
5. Horizontal Lines for Thresholds
hLower = hline(lowerThr, ...)
hUpper = hline(upperThr, ...)
Two horizontal lines at the lower and upper thresholds.
Because hline() can’t be wrapped inside if blocks, the script always creates them but makes them transparent (using na color) when the pane is hidden.
6. Filling Between Threshold Lines
fill(hLower, hUpper, color=showRSI ? color.new(color.gray,95) : na)
When the RSI pane is visible, the area between the two threshold lines is shaded in gray to create a “mid-zone” effect. This fill also switches off (becomes na) if the pane is hidden.
7. Alerts
The script also includes two alert conditions:
When RSI crosses below the lower threshold.
When RSI crosses above the upper threshold.
How It Works in Practice
On the price chart, you’ll see the background turn blue (or your chosen color) when RSI is ≤30, and red when RSI is ≥70.
If you enable “Show RSI” in the settings, a separate RSI pane will appear below the price chart, plotting the RSI line with two threshold lines and a shaded region in between.
You can fully adjust transparency and colors to suit your chart style.
Benefits
Quickly visualize overbought and oversold conditions without opening a separate RSI window.
Optional RSI pane provides context when needed.
Customizable colors and transparency make it easy to integrate with any chart theme.
Alerts give you automatic notifications when RSI crosses key levels.
------------------------------------------------------------------------------------------------------------------
개요
이 지표는 두 가지 기능을 동시에 수행합니다.
가격 차트 뒤 배경에 색상 표시
RSI 값이 설정한 하단 임계값(기본 30) 이하이거나 상단 임계값(기본 70) 이상일 때, 가격 차트 뒤쪽에 과매도·과매수 구간을 색으로 표시해줍니다.
선택적으로 RSI 보조창 표시
옵션을 켜면 별도의 RSI 패널이 나타나서 RSI 라인과 두 임계값(30, 70)을 연결한 구간을 음영 처리하여 보여줍니다.
설정 창에서 색상·투명도·보조창 표시 여부를 전부 조정할 수 있습니다.
코드 핵심 설명
1. 입력값
src: RSI 계산에 사용할 가격 소스(기본 종가).
len: RSI 기간(기본 14).
lowerThr / upperThr: RSI 하단·상단 임계값(기본 30, 70).
lowColor / highColor: RSI가 각각 하단 이하·상단 이상일 때 배경 색상.
bgTrans: 배경 투명도(0=불투명, 100=투명).
showRSI: RSI 보조창을 켜고 끌 수 있는 스위치.
2. RSI 계산
rsi = ta.rsi(src, len)
지정한 가격 소스를 기반으로 RSI를 계산합니다.
3. 가격 차트 배경 색칠
bgCol = rsi <= lowerThr ? color.new(lowColor,bgTrans) :
rsi >= upperThr ? color.new(highColor,bgTrans) :
na
bgcolor(bgCol)
RSI ≤ 하단 임계값 → lowColor(과매도 색)
RSI ≥ 상단 임계값 → highColor(과매수 색)
나머지 구간은 색상 없음.
4. 선택적 RSI 보조창
plot(showRSI ? rsi : na, display=display.pane)
showRSI가 켜져 있으면 RSI 라인을 보조창에 표시하고, 꺼져 있으면 숨깁니다.
5. 임계값 가로선
hLower = hline(lowerThr, ...)
hUpper = hline(upperThr, ...)
하단·상단 임계값을 가로선으로 표시합니다.
hline은 if 블록 안에서 쓸 수 없기 때문에 항상 그려지지만, 보조창이 꺼지면 색을 na로 처리해 안 보이게 합니다.
6. 임계값 사이 영역 음영 처리
fill(hLower, hUpper, color=showRSI ? color.new(color.gray,95) : na)
보조창이 켜져 있을 때만 두 가로선 사이를 회색으로 채워 “중립 구간”을 강조합니다.
7. 알림 조건
RSI가 하단 임계값을 아래로 돌파할 때 알림.
RSI가 상단 임계값을 위로 돌파할 때 알림.
실제 작동 모습
가격 차트 뒤쪽에 RSI ≤30이면 파란색, RSI ≥70이면 빨간색 배경이 나타납니다(색상은 설정에서 변경 가능).
RSI 보조창을 켜면, RSI 라인과 임계값 가로선, 그리고 그 사이 음영 영역이 함께 나타납니다.
투명도를 높이거나 낮추어 강조 정도를 조절할 수 있습니다.
장점
별도의 RSI창을 열지 않고도 가격 차트 배경만으로 과매수·과매도 상태를 직관적으로 확인 가능.
필요하면 보조창으로 RSI를 직접 확인하면서 임계값 가이드와 음영 영역을 함께 볼 수 있음.
색상·투명도를 자유롭게 조절할 수 있어 차트 스타일에 맞게 커스터마이징 가능.
RSI가 임계값을 돌파할 때 자동 알림을 받을 수 있음.
ICT Silver Bullet Zones (All Sessions)This Pine Script v6 indicator highlights the ICT Silver Bullet windows (10:00–11:00 local time) for all major forex/trading sessions: London, New York AM, New York PM, and Asia.
✅ Features:
Clearly visualizes Silver Bullet zones for each session.
Labels are centered inside each zone for easy identification.
Fully compatible with Pine Script v6 and TradingView.
Adjustable opacity and label size for better chart visibility.
Works on any timeframe and keeps historical zones visible.
Use Case:
Perfect for ICT strategy traders who want to identify high-probability trading windows during major market sessions. Helps in planning entries and understanding liquidity timing without cluttering the chart.
Instructions:
Add the script to your TradingView chart.
Adjust opacity and label size to suit your chart style.
Observe the SB zones for all sessions and plan trades according to ICT methodology.

Pro Market Toolkit (TH) v2.4 — S/R + Zones + ATR Bands + Alertsรายละเอียด (ภาษาไทย):
อินดิเคเตอร์ชุดเครื่องมือครบวงจรสำหรับนักเทรด
คำนวณ แนวรับ–แนวต้าน (Support / Resistance) อัตโนมัติจากสวิง (Pivot High/Low)
สร้าง Supply/Demand Zones จาก ATR เพื่อหาพื้นที่กลับตัวสำคัญ
วาดเส้น Moving Average และ ATR Bands เพื่อประเมินแนวโน้มและความผันผวน
แสดงสัญญาณ Breakout และ Bounce/Reject อย่างชัดเจนบนกราฟ
รองรับ Alerts สำหรับ 4 เงื่อนไขสำคัญ: Breakout ขึ้น/ลง, Demand Bounce, Supply Reject
มีตารางแสดง Trend และค่า ATR ปัจจุบัน
เหมาะสำหรับผู้ที่ต้องการดูแนวโน้ม, หาจุดเข้า/ออก และรับการแจ้งเตือนอัตโนมัติ โดยไม่ต้องเฝ้ากราฟตลอดเวลา
Description (English):
A comprehensive trading toolkit indicator for professional traders.
Automatically detects Support/Resistance levels using swing pivots
Generates Supply/Demand Zones based on ATR to highlight potential reversal areas
Plots Moving Average and ATR Bands for trend and volatility analysis
Displays clear signal markers for Breakouts and Zone Bounces/Rejects
Provides Alerts for 4 key conditions: Breakout Up/Down, Demand Bounce, Supply Reject
Includes an on-chart table showing the current Trend and ATR value
Ideal for traders who want automatic key levels, zones, and signal alerts without the need to monitor the chart constantly.

Institutional Sweep Zone (Range-Based)Institutional Sweep Zone (Range-Based)
This indicator models potential stop sweep zones based on institutional capital ranges, helping traders visualize where high-probability liquidity grabs are likely to occur.
Unlike traditional volatility bands, this tool estimates price movement by calculating how far a specific amount of capital—entered into the market—can push price. By defining a lower and upper capital range (in millions of USD), the indicator dynamically draws bands representing the distance institutions could realistically move price in either direction.
It supports directional control, allowing you to focus on long sweeps, short sweeps, or both simultaneously. The pip cost is auto-calibrated based on the selected currency pair, making it highly adaptive to major FX pairs.
Key Features:
-Capital input range (in millions of USD)
-Directional sweep targeting: Long, Short, or Both
-Auto-detection of pip value based on FX pair
-Visual sweep zone mapped above and below current price
-Designed to highlight areas of institutional stop hunts
Why use it?
-Helps avoid setting stops inside common sweep zones
-Improves trade survivability when paired with higher timeframe strategies
-Offers a unique way to view price through an institutional lens
Created by: The_Forex_Steward
Explore more advanced tools and concepts on my TradingView profile.

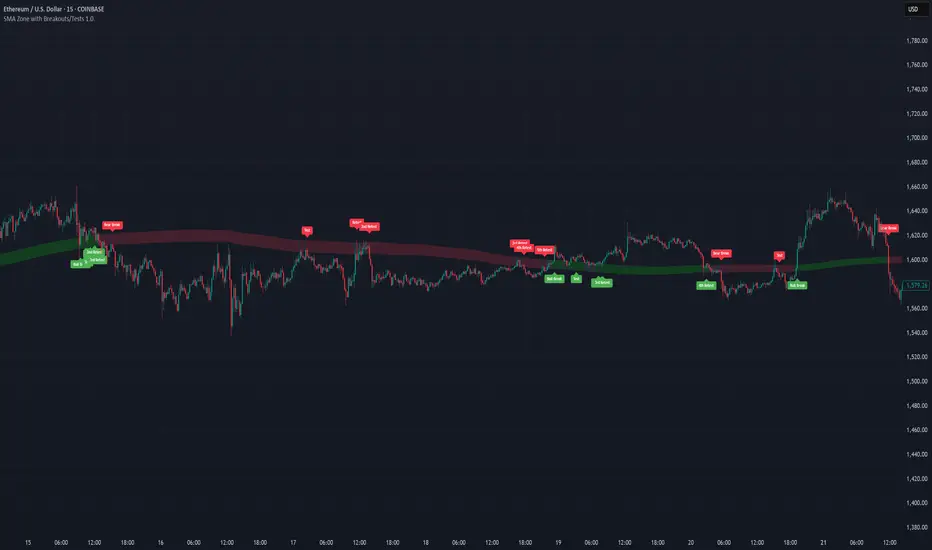
SMA Zone with Breakouts/Tests 1.0.This indicator plots a dynamic “SMA Zone” between two simple moving averages (one applied to lows, one to highs) and highlights key interaction points with the zone:
Breakouts
Bull Break: price closes above the upper SMA
Bear Break: price closes below the lower SMA
Requires confirmation via either above-average volume or an unusually wide bar (spread > ATR) closing near its extreme
Tests & Retests
After a breakout, the first re-entry into the zone edge is labeled “Test,” subsequent re-entries are numbered “Retest,” “2nd Retest,” etc.
Zone Weakening: each additional Test/Retest signifies diminished zone strength—fewer reliable boundaries remain (Traditional S/R theory)
Alerts
Fires a unified “Zone Signal” alert on every Break, Test, and Retest (set condition to “Any alert() function call”).
Disclaimer:
This is not financial advice and should not be used as a standalone trading signal.
It’s designed to draw your attention to important price-zone interactions so you can manually tune in.
The logic can be further enhanced or combined with other indicators/algorithms as part of a more complex trading system.
matrixx Global Sessions + Good/Premium Spread ZonesSimple (enough) Script that allows you to visualize the major trading sessions, with some QoL stuff, Includes a "Monday Open" bar for reference when zooming out.
By default no one 'session' is turned on; instead, we have;
Good Zone - where spread tends to close up enough for (me) to trade in the 1-minute timezones
Premium Zone - where the tightest spreads tend to happen and I (you?) can get more aggressive with Stop Losses, and moment-to-moment trade accuracy.
The Monday Open - for reference.
You are able to go into the settings and turn these on and off at will, making any combination of 'zones' you prefer, and can colour code them, as well.
Points of Difference;
You can turn on and off any group or set of sessions for an overview;
Additionally, this is coded so that if there is a "Daylight Saving" or other localized timezone shift, it should be reflected correcty, as timezones are calculated based on each sessions' data, not arbitrarily with +/- as most of the other scripts that do similar to this one.
Monday Open
you can toggle sessions, or instead toggle the 'off hour' zones, at will

Trendchange Zones Indicator | iSolani
Spotting Reversals Before They Happen: The iSolani Trendshift System
Where RSI Meets Smart Volume Analysis - Your Visual Guide to Market Turns
Core Methodology
RSI-Powered Zones
Identifies critical levels using:
14-period RSI (default) with 70/30 thresholds
Semi-transparent boxes marking overbought (red) and oversold (green) territories
Zone persistence until RSI returns to neutral range
Dynamic Level Tracking
Plots evolving support/resistance using:
Pivot highs/lows with 15-bar lookback (default)
Auto-extending lines that adapt to new price extremes
Volume-Confirmed Breakouts
Flags significant moves with:
5/10 EMA volume oscillator
20% volume threshold (default) for confirmation
Technical Innovation
Three-Layer Confirmation
Unique combination of:
Classic RSI extremes
Price structure through pivot points
Volume-fueled momentum shifts
Adaptive Visualization
Zones maintain historical context at 33% transparency
Dynamic lines extend indefinitely until invalidated
Discreet labels for breakout events
System Workflow
Calculates RSI values in real-time
Draws colored zones when RSI crosses 70/30
Marks pivot points every 15 bars (default)
Updates support/resistance lines on new pivots
Triggers alerts when price breaks levels with volume confirmation
Standard Configuration
RSI Settings : 14-period length
Pivot Detection : 15-bar left/right lookback
Visuals : 33% transparency zones with thin borders
Volume Threshold : 20% oscillator difference
Alerts : Breakout signals with "B" labels
This system transforms the classic RSI into a spatial analysis tool - not just showing when markets are overextended, but where they're likely to reverse. The dynamic lines act as moving barriers that adapt to market structure, while the volume filter ensures only high-conviction breaks get flagged. By layering momentum, price action, and volume dynamics, it creates a multi-spectrum view of potential trend changes.

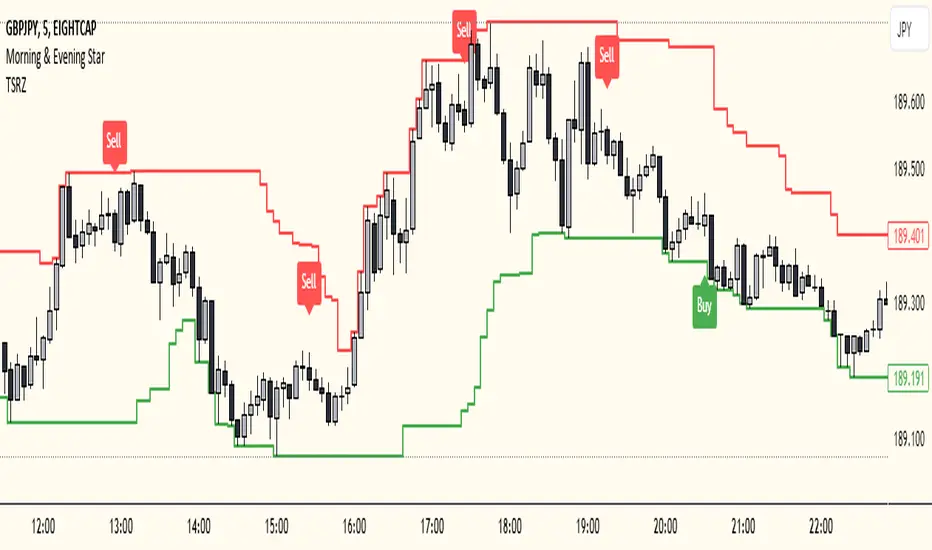
Trailing Support and Resistance Zones
This Script code is used to plot support and resistance levels on a chart. Here's how it works:
Input Parameters: The code starts by defining an input parameter lookback_period, which determines the number of bars to look back when calculating support and resistance levels. You can adjust this parameter based on your preferences or trading strategy. I recommend 50 for longer trends and larger profits.
Calculate Support and Resistance Levels: The calculateSR() function is defined to calculate the support and resistance levels based on the lowest low and highest high prices within the specified lookback period. It uses the ta.lowest() function to find the lowest low price and the ta.highest() function to find the highest high price over the specified number of bars.
Plotting: The function calculateSR() is called to compute the support and resistance levels, and the results are stored in the variables support_level and resistance_level, respectively. These levels are then plotted on the chart using the plot() function. The support levels are plotted in green, while the resistance levels are plotted in red. Both lines are drawn with a specified line width and style (plot.style_stepline).
By visualizing these support and resistance levels on the chart, you can identify potential price levels where the market might find buying or selling pressure. These levels are crucial for making trading decisions, such as setting entry and exit points, defining stop-loss and take-profit levels, and assessing the overall market sentiment.
I recommend using this indicator together with my morning & Evening Star Indicator to find entry zones.
Time Range zoneThis TradingView script displays two time zones on the chart. The first zone starts at 8:00 AM and ends at 1:00 PM, while the second zone starts at 5:00 PM and ends at 10:00 PM. If the current time is within either of these two zones, a green or red background is drawn on the chart, respectively. This script is set by default for my personal XRP strategy.

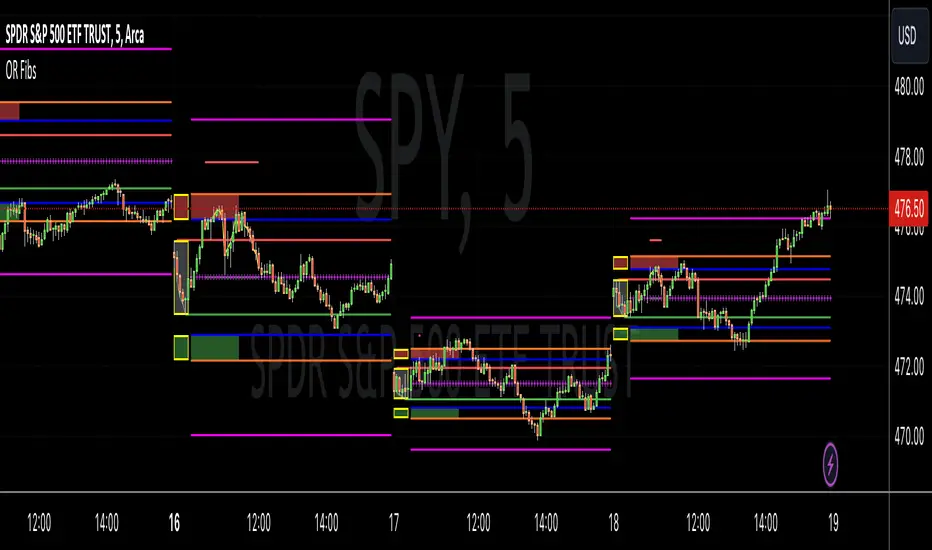
Opening Range Reversal ZonesThis script finds a reversal zone beyond the opening range for the selected period. I borrowed most of the opening range script itself from asenski.
I added a few things:
Trade Entry Times -- this restricts the "alert times."
Shading for the above mentioned times for the two "reversal" zones
A couple of other visuals for lines for the hi, mid, low of the opening range and lines for the fibs
Alerts while in the trading entry time session for fibbonacci crossovers.
I use this on NDX, SPY, and QQQs and have found buying "at the money" 0DTE puts in the "red zone" or 0DTE calls in the "green zone" frequently wins.
I have no statistics, as I am very methodical when I choose to enter, paying attention to the news, recent momentum, etc, and am not blindly entering when alert comes, but when one does, I do research and enter a trade.
In any case, thought I would share.
Reversion Zone IndexThe Reversion Zone Index (RZI) is an indicator that combines the Commodity Channel Index (CCI), Choppiness Index (CI), and Bollinger Bands Percentage (BBPct) to identify mean reversion signals in the market. It is plotted as an Exponential Moving Average (EMA) smoothed oscillator with overbought and oversold zones, and mean reversion signals are represented by red and green arrows.
The three indicators are combined to benefit from their complementary aspects and create a more comprehensive view of mean reversion conditions. Here's a brief overview of each indicator's benefits:
1. Commodity Channel Index (CCI): CCI measures the current price level relative to its average over a specified period. It helps identify overbought and oversold conditions, as well as potential trend retracements. By incorporating CCI, the RZI gains insights into momentum and potential turning points.
2. Choppiness Index (CI): CI quantifies the market's choppiness or trendiness by analyzing the range between the highest high and lowest low over a specific period. It indicates whether the market is in a trending or ranging phase. CI provides valuable information about the market state, which can be useful in mean reversion analysis.
3. Bollinger Bands Percentage (BBPct): BBPct measures the current price's position relative to the Bollinger Bands. It calculates the percentage difference between the current price and the bands, identifying potential overbought or oversold conditions. BBPct helps gauge the market's deviation from its typical behavior and highlights potential reversal opportunities.
The RZI combines the three indicators by taking an average of their values and applying further calculations. It smooths the combined oscillator using an EMA to reduce noise and enhance the visibility of the trends. Smoothing with EMA provides a more responsive representation of the overall trend and helps filter out short-term fluctuations.
The overbought and oversold zones are marked on the chart as reference levels. When the combined oscillator is above the overbought zone or below the oversold zone, it suggests a potential mean reversion signal. Red and green arrows are displayed to visually indicate these mean retracement signals.
The RZI is a valuable tool for identifying mean reversion opportunities in the market. It incorporates multiple indicators, each providing unique insights into different aspects of mean reversion, such as momentum, volatility, and price positioning. Traders can use this indicator to spot potential turning points and time their trades accordingly.

Investing ZonesInvesting Zones indicator shows the areas where LONGS or SHORTS can be made, the areas are calculated based on the mathematical averages of the high and low peaks of the price.
-There is an area called "No trading Zone" where the price is too slow, It also has a Alma Trend Ribbon (blue for uptrend, pink for downtrend) that helps to make trading decisions.
-You can make shorts when the price enters the Yellow zone called the "Sell Zone" and the price is below the Alma trend, set the TP1 in the white dotted line, and TP2 in the white lower line
-You can make longs when the price enters the Green zone called the "Buy Zone" and the price is above the Alma trend, set the TP1 in the yellow dotted line, and TP2 in the yellow upper line
-It works in all timeframes, personally I use it in 1min, 5min and 1hr.

Fibonacci Zones EMA Zones StrategyThis idea is only for fun and learning purposes only.
The strategy represents 2 simple math formulas that are very simple. the "Fibo Formula" and the "EMA Formula" Please see source code for reference
I Feel like coders can learn a lot about developing strategies using this source code
This is to show that there is unlimited amount of variables and factors to a strategy and its all about working with probability.
Also to show that unlimited amount of conditions could be added to a strategy.
And unlimited amount of variables/factors with the settings that could change the results.
Rules are simple
Entry on close, Close/Entry must be in the blue Fibo Zone
Blue Fibonacci zone fully customizable
Other Conditions could be added involving EMA zones, Over Ema1, Under Ema1 etc..
TP/SL and Dates Fully Customizable
This script is just an idea fully for learning purposes.

VWAP with 7EMA with ZonesThis is a script with 7 EMAs for every type of trades. This indicator also has the daily weekly and monthly zones. 20,50,100,200 EMAs being the best EMAs of all.
RSI with Divergences, Reverse Formulas, and Bull/Bear ZonesRegular RSI indicator that can underline divergences, turn green or red specifying user specified bull/bear zones, and with a label showing the price needed to turn bull/bear!
Specify the inputs:
+ RSI Length
+ Bull Threshold
+ Bear Threshold
+ Panel Position Offset
Also with toggle-able:
+ Bullish Divergence
+ Bearish Divergence
+ Hidden Bullish Divergence
+ Hidden Bearish Divergence
The zones included in the indicator are default and not meant to be used for all markets. The goal is to alter the bull/bear zones to find good breakout points and selloff points for your chosen security. Does not currently support automatic zone creation, or saving zones for each security (if that is even possible, may just need to create different layouts for each security).
Thanks!

DMI & ST DEV zone intersection [LM]Hello Traders,
This indicator uses two indicators st dev extremes and DMI extremes and visualize intersection of both indicators extreme zones using crosses. It means where cross is rendered intersection of extremes has occurred.
The standard deviation uses the same calculation as my Standard deviation zones Support & Resistance indicator, DMI indicator measures both the strength and direction of a price movement. I am using both indicators to find the intersection of extreme zones between them.
ST DEV settings:
source
tops setting
bottom setting
DMI settings:
length settings
extreme zone setting
Enjoy,
Lukas

Support Resistance ZonesSupport and resistance zones are used across all markets by traders and bots alike to identify liquidity and possible bounce areas. This script automates the drawing of those zones based on a number of variables, such as lookback period, channel width, number of touch confirmations and more.
This script also implements a some useful alerts so you can rest easy until the market hits a point of interest:
Enter SR Zone
Exit SR Zone
Break Upper Resistance
Break Lower Resistance

Relative Strength Index With EMA and Control ZonesThought this could be helpful since I couldnt find an RSI with an ema and Browns theory using control zones. Hope you all enjoy!