Linear EDCA v1.2Strategy Description:
Linear EDCA (Linear Enhanced Dollar Cost Averaging) is an enhanced version of the DCA fixed investment strategy. It has the following features:
1. Take the 1100-day SMA as a reference indicator, enter the buy range below the moving average, and enter the sell range above the moving average
2. The order to buy and sell is carried out at different "speed", which are set with two linear functions, and you can change the slope of the linear function to achieve different trading position control purposes
3. This fixed investment is a low-frequency strategy and only works on a daily level cycle
----------------
Strategy backtest performance:
BTCUSD (September 2014~September 2022): Net profit margin 26378%, maximum floating loss 47.12% (2015-01-14)
ETHUSD (August 2018~September 2022): Net profit margin 1669%, maximum floating loss 49.63% (2018-12-14)
----------------
How the strategy works:
Buying Conditions:
The closing price of the day is below the 1100 SMA, and the ratio of buying positions is determined by the deviation of the closing price from the moving average and the buySlope parameter
Selling Conditions:
The closing price of the day is above the 1100 SMA, and the ratio of the selling position is determined by the deviation of the closing price and the moving average and the sellSlope parameter
special case:
When the sellOffset parameter>0, it will maintain a small buy within a certain range above the 1100 SMA to avoid prematurely starting to sell
The maximum ratio of a single buy position does not exceed defInvestRatio * maxBuyRate
The maximum ratio of a single sell position does not exceed defInvestRatio * maxSellRate
----------------
Version Information:
Current version v1.2 (the first officially released version)
v1.2 version setting parameter description:
defInvestRatio: The default fixed investment ratio, the strategy will calculate the position ratio of a single fixed investment based on this ratio and a linear function. The default 0.025 represents 2.5% of the position
buySlope: the slope of the linear function of the order to buy, used to control the position ratio of a single buy
sellSlope: the slope of the linear function of the order to sell, used to control the position ratio of a single sell
sellOffset: The offset of the order to sell. If it is greater than 0, it will keep a small buy within a certain range to avoid starting to sell too early
maxSellRate: Controls the maximum sell multiple. The maximum ratio of a single sell position does not exceed defInvestRatio * maxSellRate
maxBuyRate: Controls the maximum buy multiple. The maximum ratio of a single buy position does not exceed defInvestRatio * maxBuyRate
maPeriod: the length of the moving average, 1100-day MA is used by default
smoothing: moving average smoothing algorithm, SMA is used by default
useDateFilter: Whether to specify a date range when backtesting
settleOnEnd: If useDateFilter==true, whether to close the position after the end date
startDate: If useDateFilter==true, specify the backtest start date
endDate: If useDateFilter==true, specify the end date of the backtest
investDayofweek: Invest on the day of the week, the default is to close on Monday
intervalDays: The minimum number of days between each invest. Since it is calculated on a weekly basis, this number must be 7 or a multiple of 7
The v1.2 version data window indicator description (only important indicators are listed):
MA: 1100-day SMA
RoR%: floating profit and loss of the current position
maxLoss%: The maximum floating loss of the position. Note that this floating loss represents the floating loss of the position, and does not represent the floating loss of the overall account. For example, the current position is 1%, the floating loss is 50%, the overall account floating loss is 0.5%, but the position floating loss is 50%
maxGain%: The maximum floating profit of the position. Note that this floating profit represents the floating profit of the position, and does not represent the floating profit of the overall account.
positionPercent%: position percentage
positionAvgPrice: position average holding cost
--------------------------------
策略说明:
Linear EDCA(Linear Enhanced Dollar Cost Averaging)是一个DCA定投策略的增强版本,它具有如下特性:
1. 以1100日SMA均线作为参考指标,在均线以下进入定买区间,在均线以上进入定卖区间
2. 定买和定卖以不同的“速率”进行,它们用两条线性函数设定,并且你可以通过改变线性函数的斜率,以达到不同的买卖仓位控制的目的
3. 本定投作为低频策略,只在日级别周期工作
----------------
策略回测表现:
BTCUSD(2014年09月~2022年09月):净利润率26378%,最大浮亏47.12%(2015-01-14)
ETHUSD(2018年08~2022年09月):净利润率1669%,最大浮亏49.63%(2018-12-14)
----------------
策略工作原理:
买入条件:
当日收盘价在 1100 SMA 之下,由收盘价和均线的偏离度,以及buySlope参数决定买入仓位比例
卖出条件:
当日收盘价在 1100 SMA之上,由收盘价和均线的偏离度,以及sellSlope参数决定卖出仓位比例
特例:
当sellOffset参数>0,则在 1100 SMA以上一定范围内还会保持小幅买入,避免过早开始卖出
单次买入仓位比例最大不超过 defInvestRatio * maxBuyRate
单次卖出仓位比例最大不超过 defInvestRatio * maxSellRate
----------------
版本信息:
当前版本v1.2(第一个正式发布的版本)
v1.2版本设置参数说明:
defInvestRatio: 默认定投比例,策略会根据此比例和线性函数计算得出单次定投的仓位比例。默认0.025代表2.5%仓位
buySlope: 定买的线性函数斜率,用来控制单次买入的仓位倍率
sellSlope: 定卖的线性函数斜率,用来控制单次卖出的仓位倍率
sellOffset: 定卖的偏移度,如果大于0,则在一定范围内还会保持小幅买入,避免过早开始卖出
maxSellRate: 控制最大卖出倍率。单次卖出仓位比例最大不超过 defInvestRatio * maxSellRate
maxBuyRate: 控制最大买入倍率。单次买入仓位比例最大不超过 defInvestRatio * maxBuyRate
maPeriod: 均线长度,默认使用1100日MA
smoothing: 均线平滑算法,默认使用SMA
useDateFilter: 回测时是否要指定日期范围
settleOnEnd: 如果useDateFilter==true,在结束日之后是否平仓所持有的仓位平仓
startDate: 如果useDateFilter==true,指定回测开始日期
endDate: 如果useDateFilter==true,指定回测结束日期
investDayofweek: 每次在周几定投,默认在每周一收盘
intervalDays: 每次定投之间的最小间隔天数,由于是按周计算,所以此数字必须是7或7的倍数
v1.2版本数据窗口指标说明(只列出重要指标):
MA:1100日SMA
RoR%: 当前仓位的浮动盈亏
maxLoss%: 仓位曾经的最大浮动亏损,注意此浮亏代表持仓仓位的浮亏情况,并不代表整体账户浮亏情况。例如当前仓位是1%,浮亏50%,整体账户浮亏是0.5%,但仓位浮亏是50%
maxGain%: 仓位曾经的最大浮动盈利,注意此浮盈代表持仓仓位的浮盈情况,并不代表整体账户浮盈情况。
positionPercent%: 仓位持仓占比
positionAvgPrice: 仓位平均持仓成本
簡單移動平均線(SMA)

Simple RSI and SMA Long and Short (by Coinrule)The relative strength index ( RSI ) is a momentum indicator used in technical analysis . RSI measures the speed and magnitude of a security's recent price changes to evaluate overvalued or undervalued conditions in the price of that security. The RSI is displayed as an oscillator (a line graph) on a scale of zero to 100. The RSI can do more than point to overbought and oversold securities. It can also indicate securities that may be primed for a trend reversal or corrective pullback in price. It can signal when to buy and sell. Traditionally, an RSI reading of 70 or above indicates an overbought situation. A reading of 30 or below indicates an oversold condition.
A simple moving average ( SMA ) calculates the average of a selected range of prices, usually closing prices, by the number of periods in that range.
The Strategy enters and closes the trade when the following conditions are met:
LONG
SMA100 is greater than SMA150
RSI is greater than 50
SHORT
SMA100 is less than SMA150
RSI is less than 50
When a long position is opened, it remains open until the conditions for a short are met at which point the long position is closed and the short position is opened. Then, when the conditions for the long position are met, the short will be closed and a long will be opened.
This strategy is back tested from 1 January 2022 to simulate how the strategy would work in a bear market. The strategy provides good returns.
The strategy assumes each order is using 30% of the available coins to make the results more realistic and to simulate you only ran this strategy on 30% of your holdings. A trading fee of 0.1% is also taken into account and is aligned to the base fee applied on Binance.

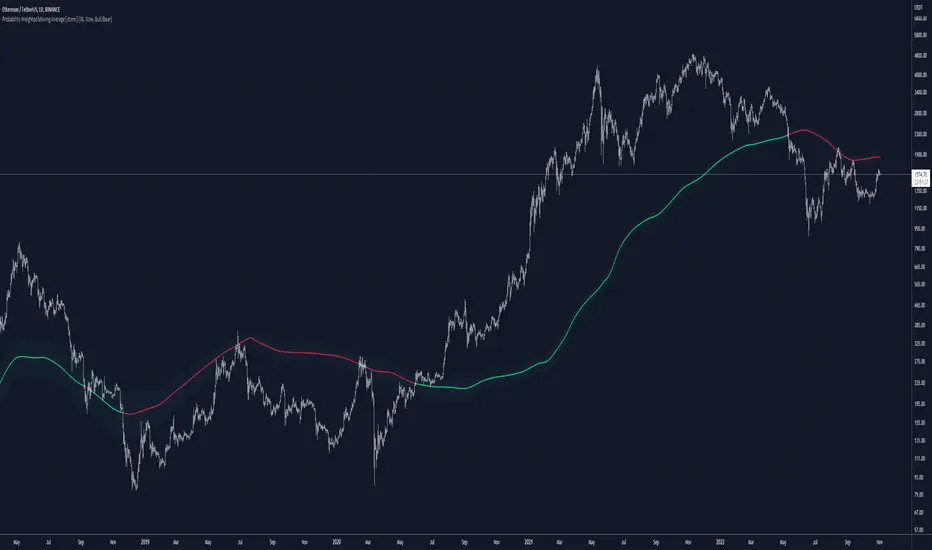
Probability Weighted Moving AverageThe Probability Weighted Moving Average uses a log-normal (continuous) distribution to calculate the probabilities of a range of lengths MAs to assess their performances, and respectively assign weights to a mean of this range. This assumes that the values of the MAs (call it A) aren't normally distributed, but instead log(A) is normally distributed, which can be a fair assumption. In P(t, t+X) where X is the number of trades assessed, it assumes the probability is not dependent on t and independent of previous price.
For P(t, t+X), the higher the value of X, the more trades are assessed.
Range of lengths comes in slow (default) or fast. Faster MAs are not preferable and should be limited to HTFs.
The color code can be either weighted (where lighter shades of blue suggests faster values have more weight, and darker shades suggest slower values have more weight) or coded for bull/bear: green when bullish, red when bearish.
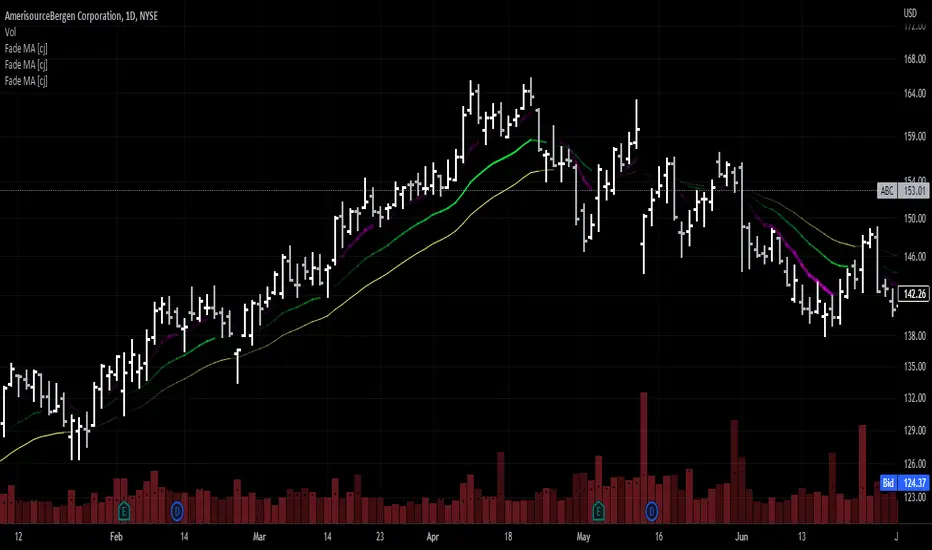
Moving Average - fade when crossed [cajole]This indicator simply provides a moving average (SMA, EMA, etc. can be selected) which hides itself when touched by the price.
Two potential uses:
Set the growth rate to be slow, to highlight only very rapid moves on a chart.
Use the default settings and change the averaging period until the MA line remains bright. This MA can then act as a good trailing stop for the specific security.
TradingView does not remember indicator settings for specific charts. Consider adding a text label to your chart after you identify the ideal trailing stop. Similar trailing-stop methods are recommended by Kristjan Qullamagie is identical to Jesse Stine's "magic line" concept .
Ichimoku MA Up & DownIchimoku and MA use the default.
It is repainted because it uses a moving average line.
A marker is only true if it was created after the candle closed.
The principle is too simple.
Please enjoy using it.
- Up : Conversion Line > MA #1 and Base Line > MA #2
It is an uptrend. The short-term moving average should be above the conversion line. And the long-term should be above the Base Line.
- Down : Conversion Line < MA #1 and Base Line < MA #2
It's a downtrend. The short-term moving average should be below the conversion line. And the long-term should be below the Base Line.
You can get better results if you use a momentum indicator like RSI.
Thank you.

Tunable SWMADissected the standard SWMA function and added options for user to change just about every part of it. Weights ,Lookback ,Source can all be changed in the settings.
Green is the standard SWMA, Using the Input value selected.(MAs/LRC/VWAP)
Red is the tuned SWMA, with the option of applying a final Output filter (MAs/LRC/VWAP). Uses 8 datapoints instead of 4 for the default.
Customization can really help expand upon the standard SWMA I find. Enjoy tuning to your hearts content

Davin's 10/200MA Pullback on SPY Strategy v2.0Strategy:
Using 10 and 200 Simple moving averages, we capitalize on price pullbacks on a general uptrend to scalp 1 - 5% rebounds. 200 MA is used as a general indicator for bullish sentiment, 10 MA is used to identify pullbacks in the short term for buy entries.
An optional bonus: market crash of 20% from 52 days high is regarded as a buy the dip signal.
An optional bonus: can choose to exit on MA crossovers using 200 MA as reference MA (etc. Hard stop on 50 cross 200)
Recommended Ticker: SPY 1D (I have so far tested on SPY and other big indexes only, other stocks appear to be too volatile to use the same short period SMA parameters effectively) + AAPL 4H
How it works:
Buy condition is when:
- Price closes above 200 SMA
- Price closes below 10 SMA
- Price dumps at least 20% (additional bonus contrarian buy the dip option)
Entry is on the next opening market day the day after the buy condition candle was fulfilled.
Sell Condition is when:
- Prices closes below 10 SMA
- Hard stop at 15% drawdown from entry price (adjustable parameter)
- Hard stop at medium term and long term MA crossovers (adjustable parameters)
So far this strategy has been pretty effective for me, feel free to try it out and let me know in the comments how you found :)
Feel free to suggest new strategy ideas for discussion and indicator building

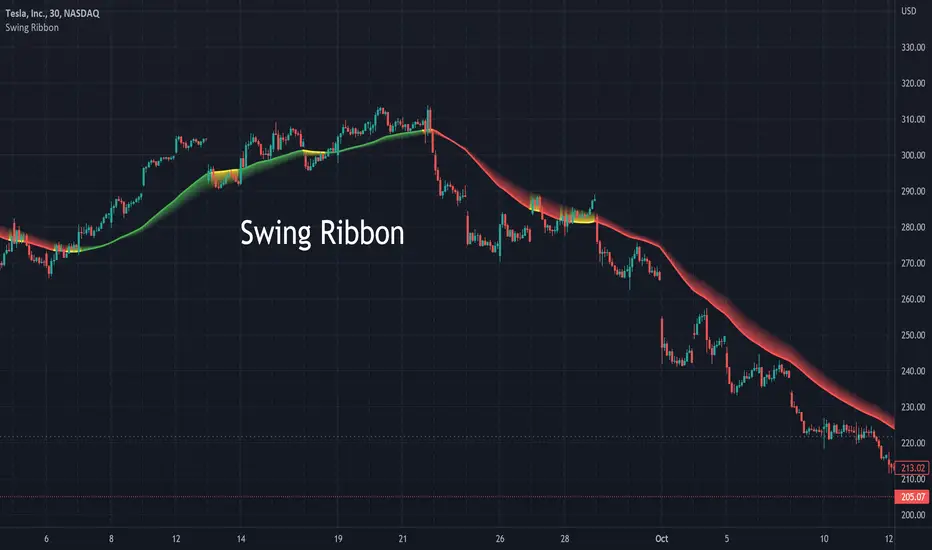
Swing RibbonA configurable fast and slow moving average combined to help visualize the current trend and potential changes in trend.
Allows for specifying a fixed set of minutes or days instead of just bars so that the visualization is similar when changing time-frames.
Altered OBV On MACDHere is another strategy along with an indicator that is already published for everyone to use wisely in the tradingview platform. The strategy is not very planned to highlight where to enter and when to exit as it is just a system. So, it is always good practice to follow the signal of simple moving averages and that is the reason you could find those color lines in this strategy as well.
As the indicator signals the entry point, it is wise to decide what the SMA (21, 50, 90, 200) signals us. When the price oscillated around the higher timeframe of moving averages, then it is wise to wait before entering.
OBV:
The OBV is perfect indicator to understand the strength of the particular stock. As the strength increase, the trend of the stock goes high along with price. But, the OBV is considered only with close of previous close which is to make sure the double confirmation on the price to accumulate the volume .
Altered OBV:
So, here is the altered OBV, which basically consider the close of previous close and also buying interested of the day when close is higher than open.
MACD:
I always admire the magic of MACD with pre-defined timeframe. Now, this MACD applied on top of altered OBV to signal us the moving of the ticker strength.
Long:
The long entry occurs when the MACD on Altered OBV signal bullish and the same time the MACD on close already bullish.
Short
The short denotes when the MACD on Altered OBV signal bearish and at the same time the MACD on close already bearish.
I hope this would help on your swing trading strategy.
Happy Investing.


MA20 Hi-Lo-Close Magic BandThis is an improvement over my previous MA20 High Low Magic Band, as it keeps a central 20 MA reference point. So it can help find the up from MA20 lows and down from MA20 highs resisted or supported by MA20 average before final entry. Usable in any time frame of choice - 15m, 30m, Hourly or Daily. In the Hourly / Daily time frame, the signal used with the volume data may work in 6/10 events or more ... Happy trading!

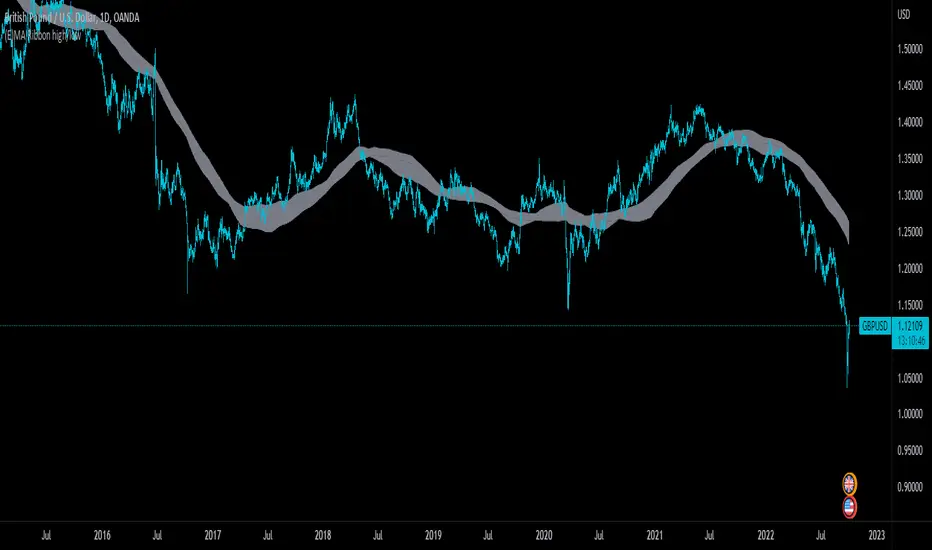
(E)Moving Average Ribbon High/LowThis is a slight modification of the standard Moving Average Ribbon. This script will take the 200 EMA and SMA with source the high and low, not the close.
This band will act as a support and resistance zone and should be used as a confluence with other indicators or support/resistance lines.
I got inspired to create this one, by the YT video "FINALLY! The 200 EMA Confluence Trading Strategy You’ve Been Waiting For" by The Secret Mindset.
In his video he takes only the 200EMA, but this script will take by default also the SMA into account.
In the settings you still can adapt as you wish ;-)
Happy trading!
RSI Influenced AverageUsing a couple of different ways of calculating (User selectable) the standard rsi oscillator is merged with a moving average for a slight variation. Plenty of options in the settings to play with like changing rsi length, MA length, lookback lengths, MA type, and much more. For Use with other moving averages ideally, or as a standalone indicator.


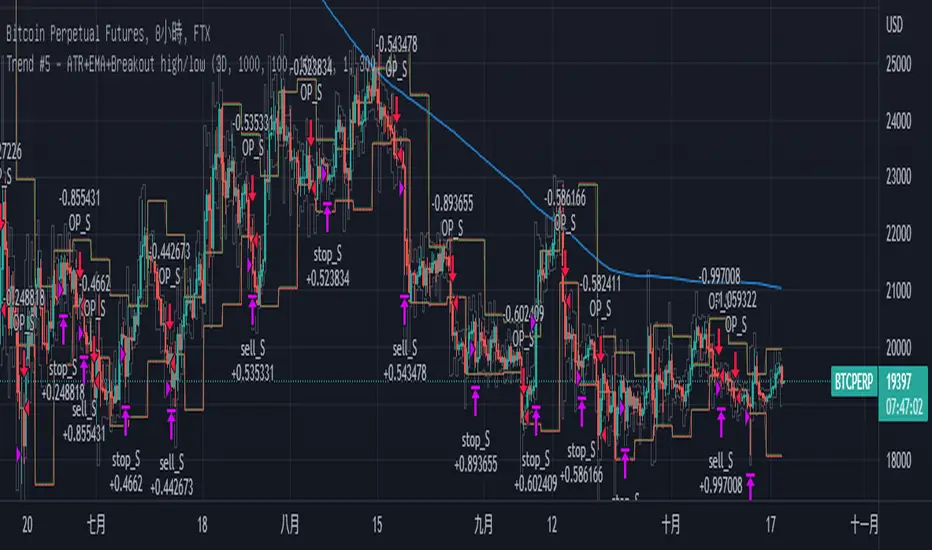
Trend Breakout high/low #1What is the Trend Breakout high/low #1?
This script uses the high/low of each fixed time period as a conditional judgment, and when the high/low is broken as a buy/sell signal, trying to capture a trend.
How to use this script?
Start date and Stop date: You can choose the date of the test.
Trading cycle: Selected time period is used as the basis for determining the high/low and is limited to one trade only.
Stop range: This value will calculate the stop loss range. Set 50-100 that is better
Fixed mode: Fixed of lots per transaction.
---Additional Functions---
Reversal mode: Reversing the buy and sell signals, may be useful in certain situations.
Wighted mode: Increased profitability under certain conditions
When win & When lose:Judgment when there is an ongoing loss/profit as a condition, may be useful in certain situations.
Use closing price: Use the closing price breakout high/low as a conditional judgment, but this function sometimes fails.
Notes:
Trading cycle and your chart time period can't be set too close,that will result repainting.
Stop range can't be set too small,that will result repainting either.
Shaikh Saab Ki MagarmachJab Magarmach bhuki ho jati hai to wo sabko kha jati hai chahe wo bulls ho ya bears.

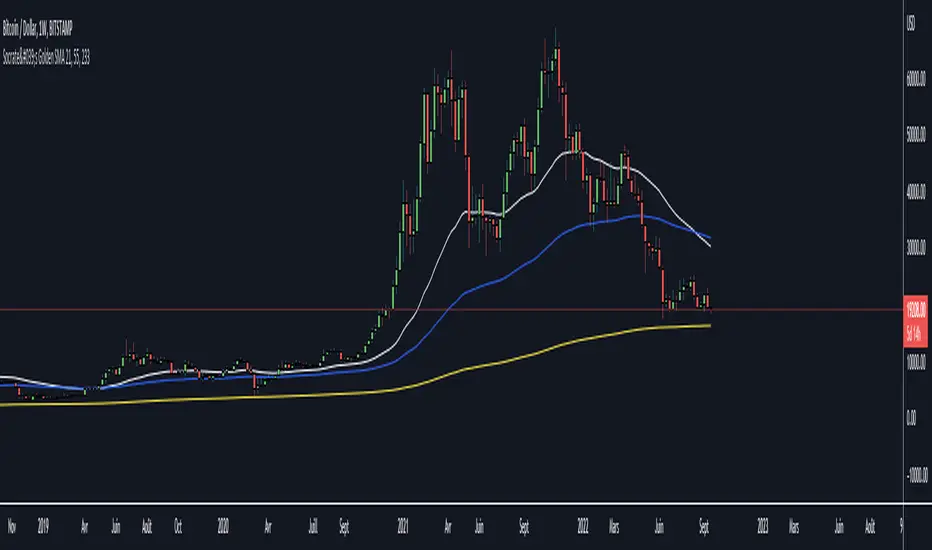
Socrate's Golden SMA 21, 55, 233
------------------ ENGLISH
Hello,
I offer you my set of simple moving averages based on the fibonacci sequence: 21, 55 and 233. They are calculated in a rather special way which makes them more relevant;)
White for the 21
Blue for the 55
Yellow for the 233
These moving averages are formidable to use both intraday and long term.
------------------ FRANCAIS
Bonjour,
Je vous propose mon set de moyennes mobiles simples basées sur la suite de fibonacci : 21, 55 et 233. Elles sont calculées d'une manière un peu particulière ce qui permet d'en renforcer la pertinence ;)
Blanc pour la 21
Bleu pour la 55
Jaune pour la 233
Ces moyennes mobiles sont redoutables à l'utilisation tant en intraday qu'en long terme.
Socrate
IS 200EMABB long buy and sellThis script backtested some stocks, it's giving soft buy and strong buy signals,
I am using Bollinger band and 200 EMA,
Strong Buy :- If price is above 200 ema and cross over 10d ema and sma setup with BB,
Buy :- If price is below 200 ema and cross over 10d ema and sma setup with BB,
Strong Sell :- If price is below 200 ema and cross over ema and sma with input setup for BB
Sell :- If price is above 200 ema and cross over ema and sma with input setup for BB
Don't consider it as buy and sell call, do your own research ,i did it according to my experience and learning.
Thank you

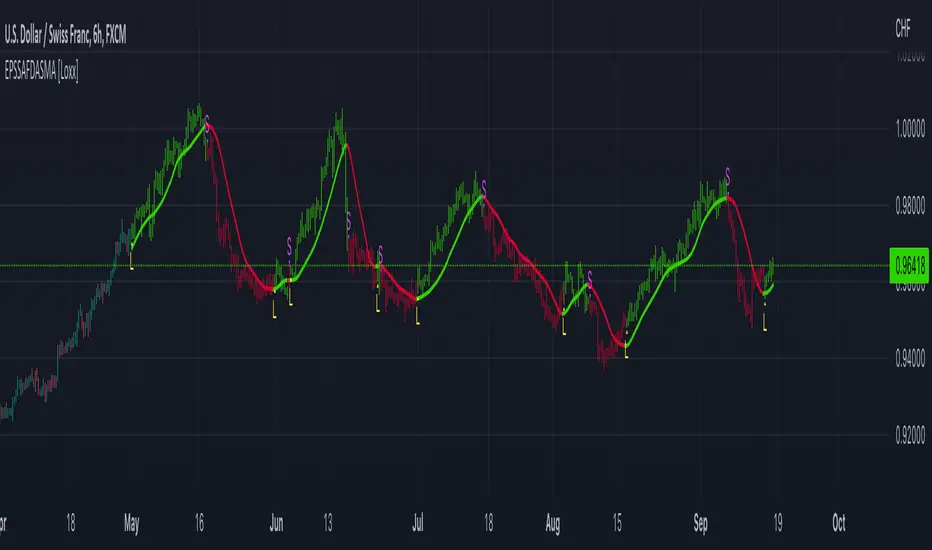
End-pointed SSA of FDASMA [Loxx]End-pointed SSA of FDASMA is a modification of Fractal-Dimension-Adaptive SMA (FDASMA) using End-Pointed Singular Spectrum Analysis. This is a multilayer adaptive indicator.
What is the Fractal Dimension Index?
The goal of the fractal dimension index is to determine whether the market is trending or in a trading range. It does not measure the direction of the trend. A value less than 1.5 indicates that the price series is persistent or that the market is trending. Lower values of the FDI indicate a stronger trend. A value greater than 1.5 indicates that the market is in a trading range and is acting in a more random fashion.
See here for more info:
Fractal-Dimension-Adaptive SMA (FDASMA) w/ DSL
What is Singular Spectrum Analysis ( SSA )?
Singular spectrum analysis ( SSA ) is a technique of time series analysis and forecasting. It combines elements of classical time series analysis, multivariate statistics, multivariate geometry, dynamical systems and signal processing. SSA aims at decomposing the original series into a sum of a small number of interpretable components such as a slowly varying trend, oscillatory components and a ‘structureless’ noise. It is based on the singular value decomposition ( SVD ) of a specific matrix constructed upon the time series. Neither a parametric model nor stationarity-type conditions have to be assumed for the time series. This makes SSA a model-free method and hence enables SSA to have a very wide range of applicability.
For our purposes here, we are only concerned with the "Caterpillar" SSA . This methodology was developed in the former Soviet Union independently (the ‘iron curtain effect’) of the mainstream SSA . The main difference between the main-stream SSA and the "Caterpillar" SSA is not in the algorithmic details but rather in the assumptions and in the emphasis in the study of SSA properties. To apply the mainstream SSA , one often needs to assume some kind of stationarity of the time series and think in terms of the "signal plus noise" model (where the noise is often assumed to be ‘red’). In the "Caterpillar" SSA , the main methodological stress is on separability (of one component of the series from another one) and neither the assumption of stationarity nor the model in the form "signal plus noise" are required.
"Caterpillar" SSA
The basic "Caterpillar" SSA algorithm for analyzing one-dimensional time series consists of:
Transformation of the one-dimensional time series to the trajectory matrix by means of a delay procedure (this gives the name to the whole technique);
Singular Value Decomposition of the trajectory matrix;
Reconstruction of the original time series based on a number of selected eigenvectors.
This decomposition initializes forecasting procedures for both the original time series and its components. The method can be naturally extended to multidimensional time series and to image processing.
The method is a powerful and useful tool of time series analysis in meteorology, hydrology, geophysics, climatology and, according to our experience, in economics, biology, physics, medicine and other sciences; that is, where short and long, one-dimensional and multidimensional, stationary and non-stationary, almost deterministic and noisy time series are to be analyzed.
Included:
Bar coloring
Alerts
Signals
Loxx's Expanded Source Types
Fractal-Dimension-Adaptive SMA (FDASMA) w/ DSL [Loxx]Fractal-Dimension-Adaptive SMA (FDASMA) w/ DSL is a fractal-dimension-index-adaptive SMA. The SMA is accelerated during a trend and slowed down during a sideways market, so as to avoid false signals. This indicator uses the fractal dimension to compute an ingest period length into the SMA to output the FDASMA.
What is the Fractal Dimension Index?
The goal of the fractal dimension index is to determine whether the market is trending or in a trading range. It does not measure the direction of the trend. A value less than 1.5 indicates that the price series is persistent or that the market is trending. Lower values of the FDI indicate a stronger trend. A value greater than 1.5 indicates that the market is in a trading range and is acting in a more random fashion.
What are DSL Discontinued Signal Line?
A lot of indicators are using signal lines in order to determine the trend (or some desired state of the indicator) easier. The idea of the signal line is easy : comparing the value to it's smoothed (slightly lagging) state, the idea of current momentum/state is made.
Discontinued signal line is inheriting that simple signal line idea and it is extending it : instead of having one signal line, more lines depending on the current value of the indicator.
"Signal" line is calculated the following way :
When a certain level is crossed into the desired direction, the EMA of that value is calculated for the desired signal line
When that level is crossed into the opposite direction, the previous "signal" line value is simply "inherited" and it becomes a kind of a level
This way it becomes a combination of signal lines and levels that are trying to combine both the good from both methods.
In simple terms, DSL uses the concept of a signal line and betters it by inheriting the previous signal line's value & makes it a level.
Included
2 Signal types
Alerts
Loxx's Expanded Source Types
Bar coloring
Variety MA Cluster Filter [Loxx]Variety MA Cluster Filter is one method of creating a low-lag digital filter. This is done by calculating two moving averages and then comparing their output to the past value of the combined output and then choosing the max and min between the two moving averages to then determine the combined output. I've included standard deviation filtering for smoothing.
What is a Standard Deviation Filter?
If price or output or both don't move more than the (standard deviation) * multiplier then the trend stays the previous bar trend. This will appear on the chart as "stepping" of the moving average line. This works similar to Super Trend or Parabolic SAR but is a more naive technique of filtering.
Included
Bar coloring
Signals
Alerts
Loxx's Expanded Source Types
Loxx's Moving Averages
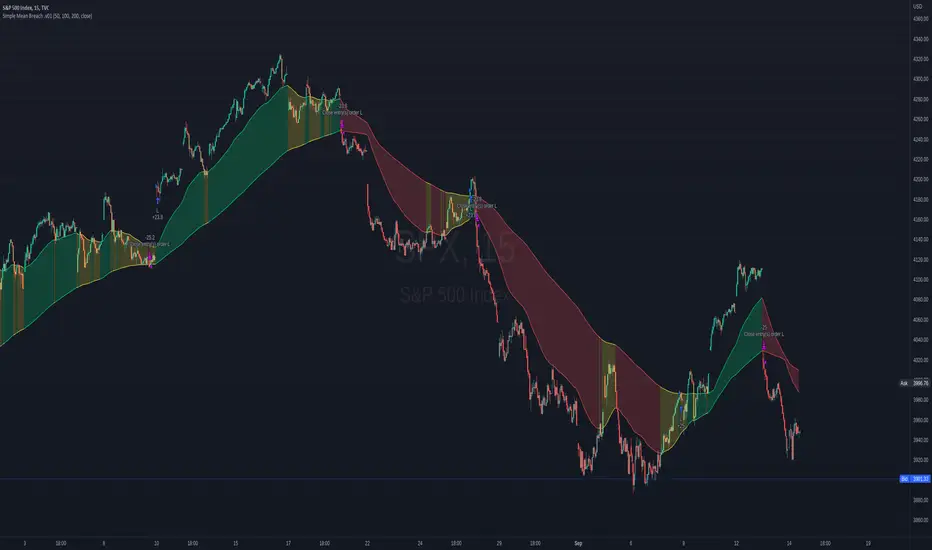
Simple Mean Breach .v01The script is based on moving averages, therefore the underbelly is no different from existing indicators. I've also borrowed ideas from existing scripts. However, this script is meant to help you automate your trading. I removed all the noise of multiple SMA lines, so it's easy to focus on what's important for entering or exiting the position; the top and bottom line at any point in time or price level.
Recommended use and markets:
You buy or sell when the price breaches the band. I would recommend focusing on one direction when using this indicator; I prefer going long. This works well with major indices (SPX, NDX, DJI) at 15m or 30m or even 10m, but not the crypto or individual stocks.
Notice that even when the S&P500 is in decline, you can still profit from the occasional powerful rally...if you stick to the script. This script is a visualisation that could help you take emotions out of your trading....you're welcome :)