Staple MAsThis is a useful indicator which allows you to plot multiple common predefined Moving Averages (Ema and Sma). Here are some of its features:
Ability to quickly display many common EMAs and SMAs.
Multiple timeframes.
Descriptive labels to avoid misreading.
Simple and well-organized Input Tab.
簡單移動平均線(SMA)

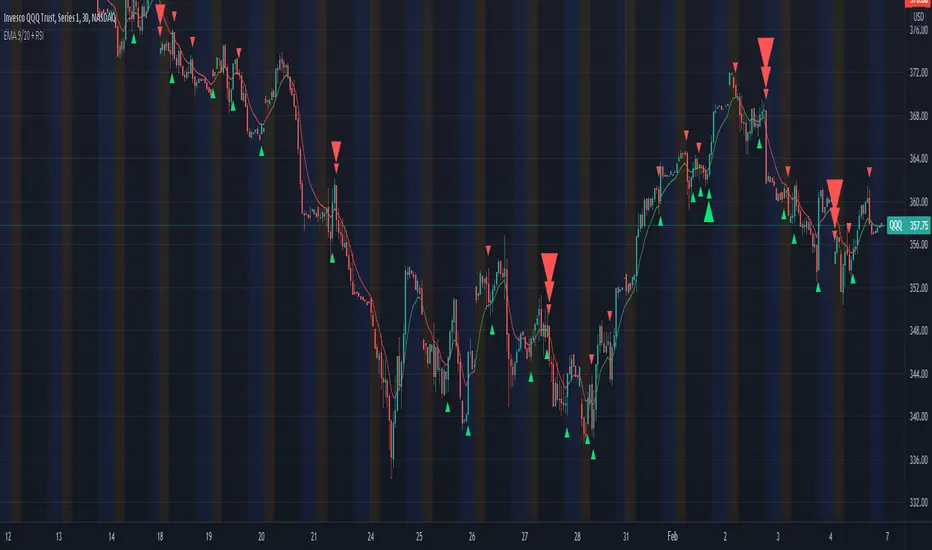
RinarBottombuyRSI, VWMA, MA.
Altcon bottom signals.
buy
White background - bottom point
Yellow - Buy zone
White triangles - a signal to place orders
Sell
Red - sale
RU
RSI , VWMA , MA.
Сигналы дна альтконов.
Buy
Белый фон -точка дна
Желтый - Зона покупки
Белые треугольники - сигнал выставить ордера
Sell
Красный - продажа

Bogdan Ciocoiu - CoordinatorDescription
The Coordinator is an indicator developed on the back of the RSI algorithm, modified substantially to form a cloud. In addition, the Coordinator uses EMA/SMA to compare the location of the RSI cloud with the chosen moving averages (EMA vs SMA).
This indicator is helpful as it confirms when a trader should enter a position or exit based on the proximity of the RSI cloud to the relevant MA.
Uniqueness
The Coordinator provides unique benefits, including:
It shows the strength of the RSI in the shape of the RSI cloud, using two sets of dimensions (one more long term and one more short-term oriented).
It indicates the positioning of the RSI cloud in conjunction with the relevant moving averages to help traders remain in positions for longer.
It shows the RSI 14 (useful when spotting divergences aligned with the price action).
Open-source
The Coordinator uses the following open-source scripts:
www.tradingview.com

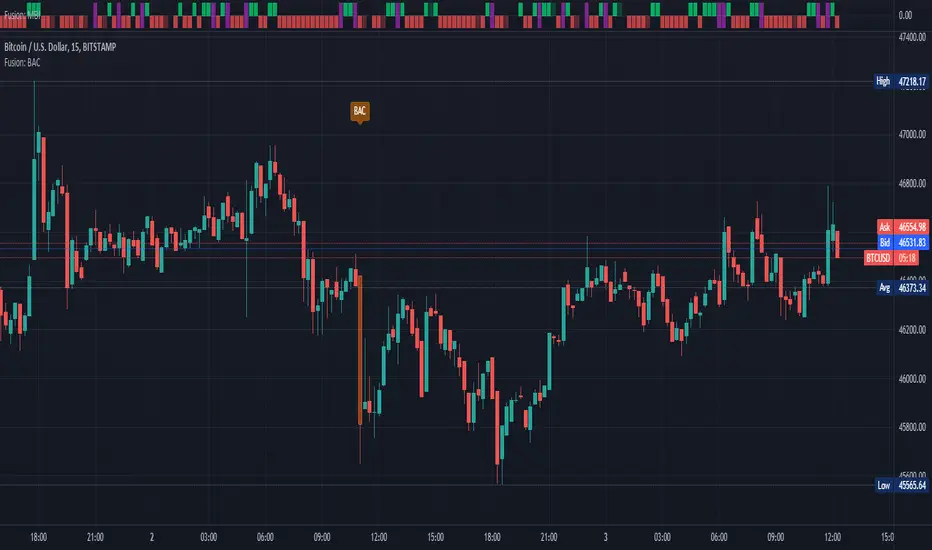
Fusion: Big Arty CandlesAnyone who follows Arty knows about his "Big A** Candle" strategies.
I didn't like the BAC indicators that had code available so I wrote this one that has some decent flexibility and display options.
You can use this to enter a trade immediately after a BAC, probably in the opposite direction and ride the pullback that usually occurs or just use it to avoid trading until things settle down. I use it to avoid trading for a few bars on the 15 minute timeframe on bitcoin.
The settings are certainly not optimized so set them to whatever suits your needs as the defaults will probably be wrong for you.
The code is structured to easily drop into a bigger system so use it as a lone indicator or add the code to some bigger project you are creating. If you do integrate it into something else then send me a note as it would be nice to know it's being well used.
Finally, if you find value please do make a comment, give a thumbs up etc.
Enjoy and good luck!
Bitcoin Risk Long Term indicatorOBJECTIVE:
The purpose of this indicator is to synthesize via an average several indicators from a wide choice with in order to simplify the reading of the bitcoin price and that on a long term vision.
Useful for those who want to see things simply, typically to make a smart DCA based on risk.
I originally used this script as a sandbox to understand and test the usefulness of several indicators, and to develop my PineScript skills, but finally the Risk Indicator output seems relevant so I decided to share it.
USAGE:
The selected indicators are the ones that I think give the best market bottoms, but the idea here is that anyone can try and use any set of indicators based on those preferences (post in comments if you find a relevant config)
Most of the indicator inputs are configurable. And some are not taken into account in the calculation of the Risk indicator because I consider them not relevant, this script is also a test more than a final version.
NOTES :
If you have any idea of adding an indicator, modification, criticism, bug found: share them, it is appreciated!
In the future I will create another more versatile Risk indicator that will not be focused on bitcoin in weekly. (this indicator is still usable on other assets and timeframe)
THANKS:
to Benjamin Cowen for inspiring me with his Bitcoin Risk metric
to Lazybear for his Wavetrend Indicator and all the scripts he shares
to Mabonyi for his Bitcoin Logarithmic Growth Curves & Zones script
to VuManChu for his VMC Cypher B Divergence
to the Trading view team for developing TV and PineScript
And to all the community for all the published codes that allowed me to progress and create this script
---- FR ----
OBJECTIF :
L'objectif de cet indicateur est de synthétiser via une moyenne plusieurs indicateurs parmi un large choix avec afin de simplifier la lecture du cours de bitcoin et cela sur une vision longue terme.
Utile pour ceux qui veulent voir les choses simplement, typiquement faire un DCA intelligent en fonction du risque.
À la base j'ai utilisé ce script comme un bac à sable pour comprendre puis tester l'utilité de plusieurs indicateurs, et développer mes compétences PineScript, mais finalement l'output Risk Indicateur me semble pertinent donc autant le partager.
UTILISATION :
Les indicateurs sélectionnés sont ceux qui permettent selon moi d'avoir les meilleurs point bas de marché, mais l'idée ici est que chacun puisse essayer et utiliser n'importe quel ensemble d'indicateur en fonction de ces préférences (poster en commentaire si vous trouvez une configuration pertinente)
La plupart des inputs indicateurs sont paramétrables. Et certains ne sont pas pris en compte dans le calcul du Risk indicateur car je les estime non pertinent, ce script est aussi un essai plus qu'une version finale.
NOTES :
Si vous avez la moindre idée d'ajout d'indicateur, modification, critique, bug trouvé : partagez-les, c'est apprécié !
à l'avenir je créerais un autre Risk indicator plus polyvalent qui ne sera pas focalisé sur bitcoin en weekly. (cet indicateur est tout de même utilisable sur d'autre actif et timeframe)
REMERCIEMENT :
à Benjamin Cowen pour m'avoir inspiré avec son Bitcoin Risk metric
à Lazybear pour son Wavetrend Indicator et globalement tout les scripts qu'il partage
à Mabonyi pour son script Bitcoin Logarithmic Growth Curves & Zones
à VuManChu pour son VMC Cypher B Divergence
à l'équipe Trading view pour avoir développé TV et PineScript
Et à toute la communauté pour tous les codes publiés qui m'ont permis de progresser et de créer ce script

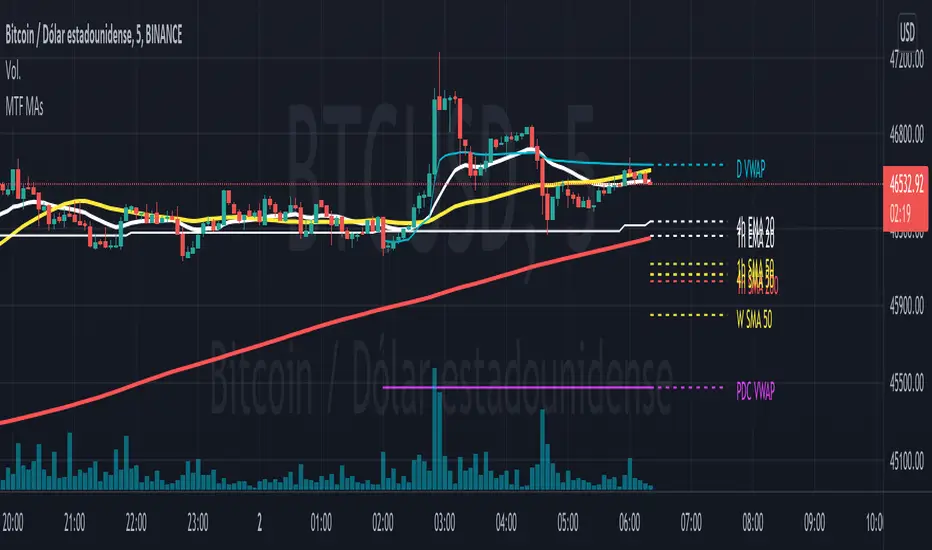
Multi Timeframe Moving AveragesI made this script to keep an eye on most important timeframes (1h, 4h, D, W, M)) moving averages while watching another timeframe. You can select what Ma's you want to be shown for each timeframe and some options to help your analysis (show history, show prices on mouse over label, etc...)
It includes 3 MA's:
- Fast (EMA)
- Middle (SMA)
- Slow (SMA)
You can configure length, source and color for each one.
Also includes a daily VWAP and an option to show the previous day close.
This script includes code from user Frien_dd-DisDev. I am very grateful to him
Thank you for interest.
Pablo.
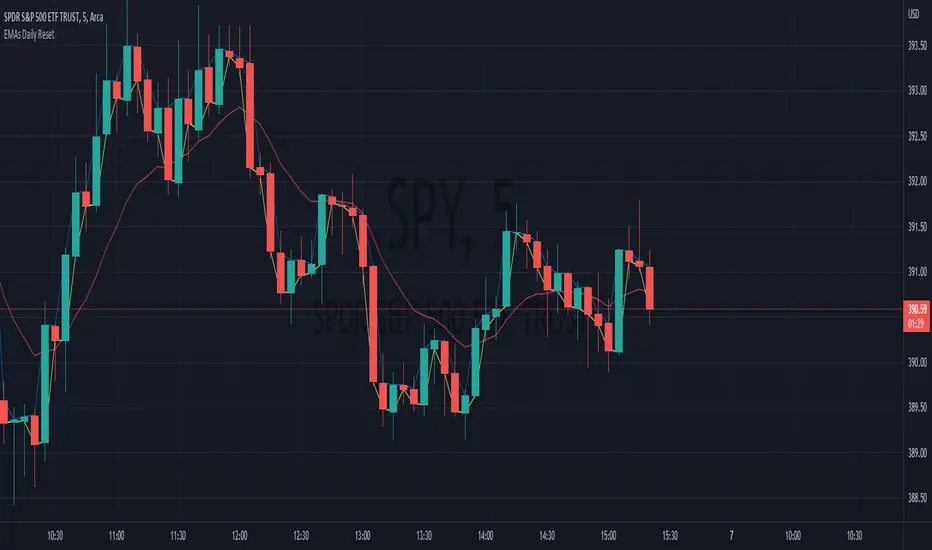
EMAs Daily ResetThis indicator displays 3 EMAs that recalculate every day.
This is useful for intraday trading by removing the bias of the previous day's ema price. This ensures your EMAs stay near the most current price action.
Note: If your length is larger than the number of bars in the day, your EMAs will not have time to properly catch up in the day.
Uptrend and Oversold Index Swing Trading System 8H--- Foreword ---
The Overbought and Oversold Index Swing Trading System or short: I11L Hypertrend primarily uses money management Strategies, EMA and SMA and my momentum Ideas for trying to produce satisfactory Alpha over a timespan of multiple years.
--- How does it Work? ---
It uses 20 different EMA's and SMA's to produce a score for each Bar.
It will credit one Point If the EMA is above the SMA.
A high score means that there is a strong Uptrend.
Spotting the strong Uptrend early is important.
The I11L Hypertrend System trys to spot the "UPTREND" by checking for a crossover of the Score(EMA) / Score(SMA).
A low score means that there is a strong Downtrend.
Its quite common to see a reversal to the mean after a Downtrend and spotting the bottom is important.
The System trys to spot the reversal, or "OVERSOLD" state by a crossunder of the Score(EMA) / Score(SMA).
--- What can i customize? ---
-> Trading Mode: You can choose between two different trading modes, Oversold and Overbought(trend) and Random Buys to check if your systems Profitfactor is actually better then market.
-> Work with the total equity: The system uses the initial capital per default for Backtesting purposes but seeing the maximum drawdown in a compounding mode might help!
-> Use a trailing SL: A TSL trys to not lose too much if the trade goes against your TP
-> Lookbackdistance for the Score: A higher Lookbackdistance results in a more lagging indicator. You have to find the balance between the confirmation of the Signal and the frontrunning.
-> Leverage: To see how your strategie and your maximum Drawdown with the total equity mode enabled would have performed.
-> Risk Capital per Trade unleveraged: How much the underlying asset can go against your position before the TSL hits, or the SL if no TSL is set.
-> TPFactor: Your risk/reward Ratio. If you risk 3% and you set the ratio to 1.2, you will have a TP at 3 * 1.2 = 3.6%
-> Select Date: Works best in the 8H Timeframe for CFD's. Good for getting a sense of what overfitting actually means and how easy one can fool themself, find the highest Profitfactor setting in the first Sector (Start - 2012) and then see if the second Sector (2012 - Now) produces Alpha over the Random Buy mode.
--- I have some questions about the System ---
Dear reader, please ask the question in the comment Section and i will do my best to assist you.


USFuturesInvestments Moving Averages - Exponencia and SimpleThis indicator contains the main exponential moving averages (9, 21 and 80) and the simple moving averages (200, 305 and 610), which I use in my operational.
It was developed by my friend Giovani, who is a 10 note guy!
I hope he can help you on your journey to becoming a Professional Trader.
You can modify it the way you prefer, it is very simple.
Neste indicador estão reunidas as principais médias móveis exponenciais (9, 21 e 80) e as médias móveis simples (200, 305 e 610), que uso em meu operacional.
Ele foi desenvolvido por meu amigo Giovani, que é um cara nota 10!
Espero que ele possa ajudar a você na jornada para se tornar um Trader Profissional.
Você pode modifica-la do jeito que preferir, é muito simples.


OZ Trade IndicatorThis is a simple indicator combining both Pivot Point SuperTrend and Madrid Moving Average Ribbon .
I also added some alerts when:
- Madrid Moving Average are all green (buy) and red (sell) lines.
- Madrid Moving Average MA05 and MA100 crossover (buy) and crossunder (sell)
Aside from this, all are unchanged for both indicators.
Idea:
BUY
- If SuperTrend printed Up
- If Madrid Ribbon lines are Green (🟢)
- If Madrid Ribbon MA05 and MA100 printed Crossover (▲)
SELL
- If SuperTrend printed Down
- If Madrid Ribbon lines are Red (🔴)
- If Madrid Ribbon MA05 and MA100 printed Crossover (🔻)

rsisma imkind dailyrsi 14
sma 8
time fram : weekly and daily
rsi 14
sma 8
time fram : weekly and daily
rsi 14
sma 8
time fram : weekly and daily
rsi 14
sma 8
time fram : weekly and daily

Find Best Performing MA For Price CrossoverHello!
This script calculates the average percentage gain/loss following a price crossover of a moving of any length, up until prices cross back under the MA.
The script calculates the average number of candles that the source (i.e. close, open, low, ohlc4) remains above the moving average until crossing back under, in addition to the number of crosses. Performance is listed from best to worst; descending order. Also listed is the HIGHEST cumulative gains of ALL tested moving averages.
The moving average length can be changed to any number, so long as there are enough data points, on ANY timeframe and the script will recalculate.

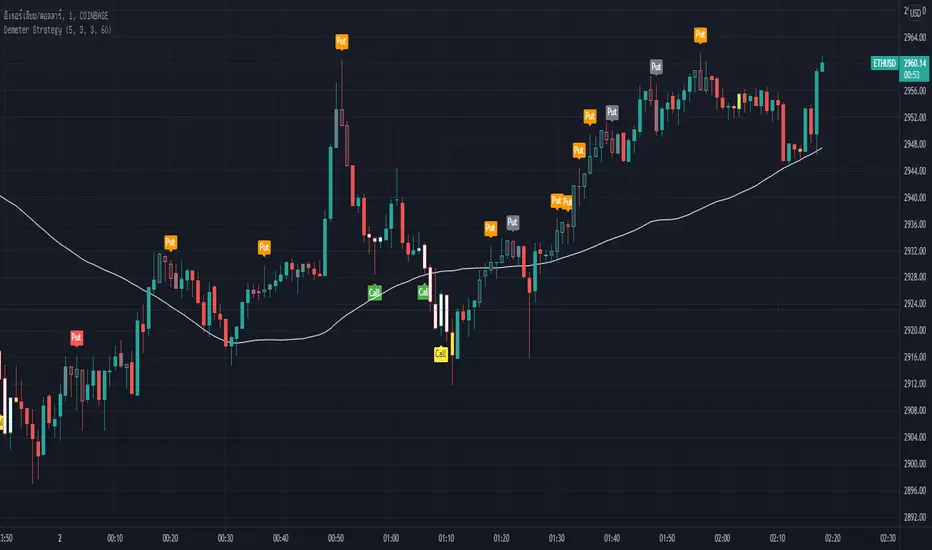
Demeter StrategyDemeter Strategy is Stochastic oscillator (5 3 3) and SMA (60) system with small modification.
This strategy has 6 signals.
(These 6 signals can be used in every market.)
Main signals :
Green Call : Call (Buy)
Reg Put : Put (Sell)
Secondary signal :
Yellow Call : Call (Buy)
Orange Put : Put (Sell)
Fast signal :
White Call : Call (Buy)
Gray Put : Put (Sell)
In trading, any signal can be used.
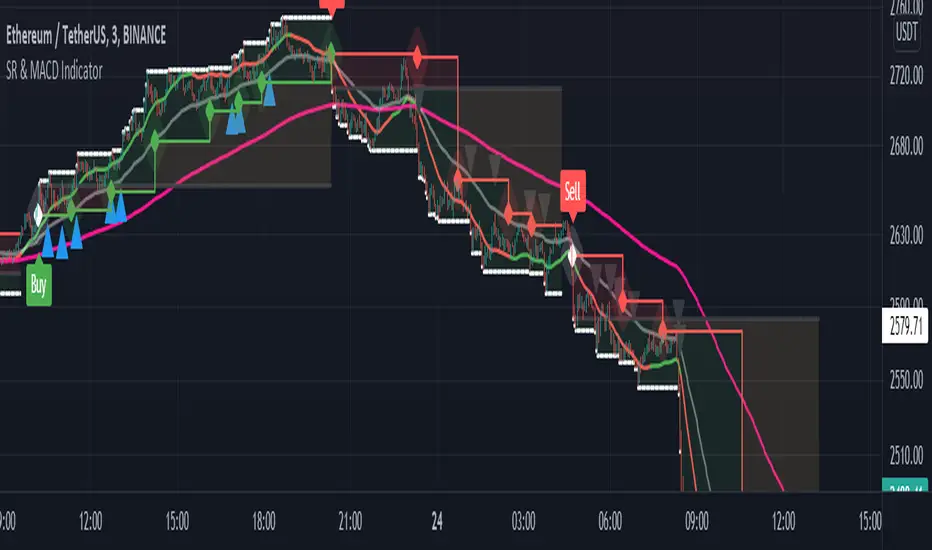
Support and Resistance with MACD IndicatorOriginal script from ©akpaswaniitk. I just added MACD to filter out bad trades and alert function so that we get notified whenever indicator gives us an entry signal. Most of the false breakout has been removed but the remaining ones only pop up during consolidation, so it's wait for the retest before entry. Works better in continuous market. Also look at the color of EMA for further confirmation, only focus on buy side when EMA is green and sell when EMA is red or when after the buy signal EMA changes color from red to green. These are the highly profitable setups I've found with this indicator.
Signals
Red or Green solid line with diamond are trailing stoploses
dotted black line is entry level
dotted white line is optimal exit
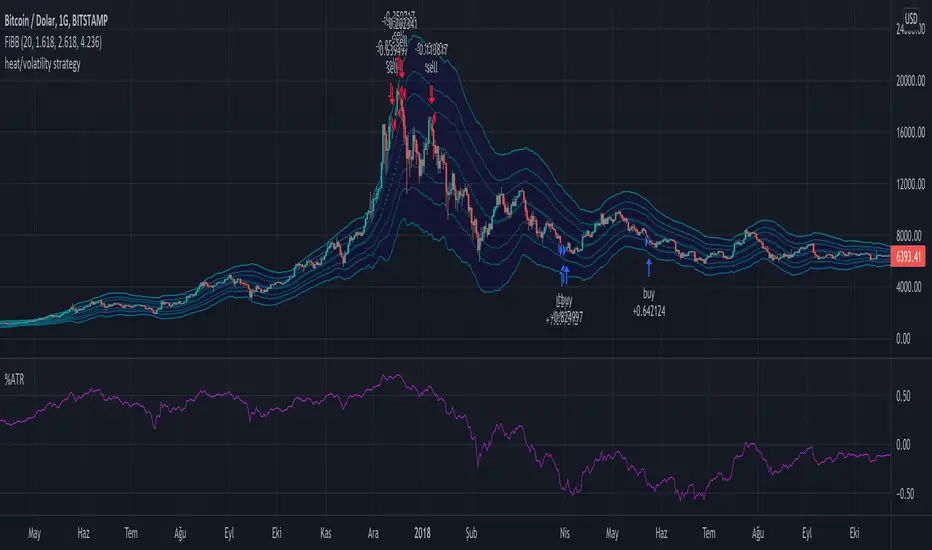
Long Term Heat/Volatility - Accumulation/Distribution v1This is a strategy specifically made for 1D BTC/USD with the aim of capturing cycle tops and bottoms. It's mainly based on two indicators: 21d average of ATR (volatility) and (BTC.price - 180d sma)/BTC.price (heat). The strategy only signals buys or sells after occurrences of high volatility, followed by extremely high or low heat values. It's optimized for utilizing accumulation and distribution at lower and higher prices respectively with respect to last 14 days. 2nd version will include dynamic dollar cost averaging during the accumulation and distribution periods.
Mix1 : Ema Cross + Trend Channel [Gu5] - BacktestBacktest of the indicator "Mix1: Ema Cross + Trend Channel "
Trend indicator, by the crossing of moving averages
SMA200 with a channel as a filter confirms the trend.
The crossing of two moving averages, give alert only in trend.

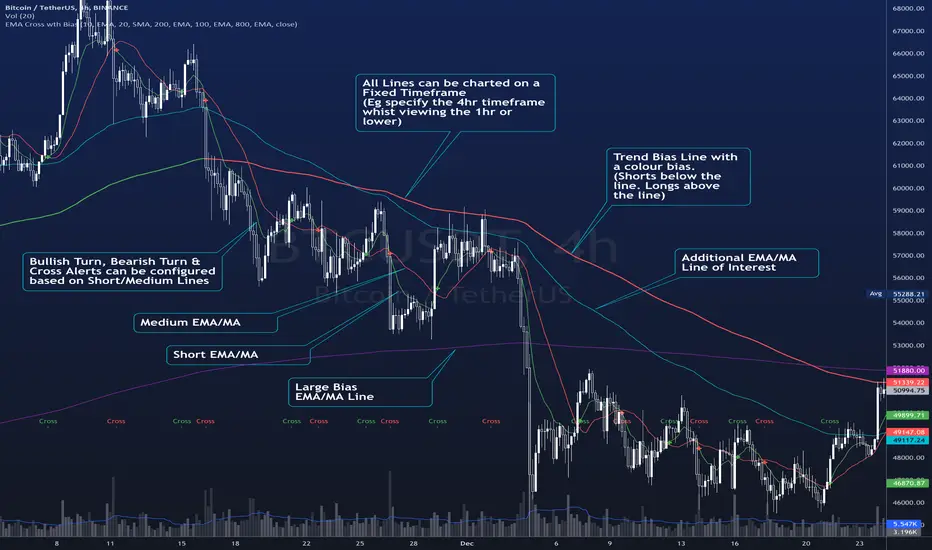
EMA Cross wth BiasThe Script plots 4 Moving averages.
1. Short Moving Average
2. Medium Moving Average
2. Trend Bias (Usually a much slower Moving Average) - Plots in Green when price action is above the line and Red for when price action is below the line.
3. Alerts are triggered when the short MA/ EMA turns. Can be used for Early Entry signals and Exits.
4. Alerts are triggered for Crosses of the Short and Medium MA
Each Moving average line can be confirmed to be a Simple MA or and EMA
Multiple Timeframe continuity with Crossover Alerts█ OVERVIEW
This Indicator calculates the EMA 9/20 and the RSI with its SMA on multiple timeframes and indicates their crossings. In addition this script alerts the user when crossings appear.
█ USAGE
Use the checkboxes to activate different timeframes. With the dropdown menu you can select the timeframe in minutes.
Furthermroie use the checkboxes to activate different crossovers. At the end of the settings you can find the same options for the RSI.
You can also let the script indicate only the overlapping of both indicator crossovers by using the combination option.
█ KNOWLEDGE
EMA: The ema function returns the exponentially weighted moving average. In ema weighting factors decrease exponentially. It calculates by using a formula: EMA = alpha * source + (1 - alpha) * EMA , where alpha = 2 / (length + 1).
SMA: The sma function returns the moving average, that is the sum of last y values of x, divided by y.
RSI: The RSI is classified as a momentum oscillator, measuring the velocity and magnitude of price movements. Momentum is the rate of the rise or fall in price. The RSI computes momentum as the ratio of higher closes to lower closes: stocks which have had more or stronger positive changes have a higher RSI than stocks which have had more or stronger negative changes.
RMA: Moving average used in RSI. It is the exponentially weighted moving average with alpha = 1 / length.
(Source: TradingView PineScript reference & en.wikipedia.org)
█ Credits
Thanks to @KhanPhelan with his EMA 9/20 trading idea
Credits to TradingView for their RSI function
█ Disclaimer
This is my first Script, any feedback is welcome.
Forex Dogs Moving Averages with Distance TableThis is an indicator based on the book【Forex】ForexDog’s Vacuum Zone Trading 2021: Trading Strategy to “not lose” based on Experience and Logic written by Forex Dog (yes, this is his author name on Amazon; he is a trader popular mostly in Japan). It consists of simple moving averages which should somewhat correspond to the higher timeframes moving averages. The original was traded on a 15m chart and the periods are as follows: 5, 20, 40, 50, 80, 100, 200, 400, 640, 1600, 1920, 3200.
Then, there is a big table with a distances overview. This should give you an idea of how far each average is in ticks. The minus in front of the ticks_total signifies direction.
I expect some feedback on this because I don't think the user convenience is very with tables being so bright. My goal is to create a system that limits the number of "noodles" on the chart but still carries the information via the tables on the side.
Moving Average Length is not adjustable by design. The book says to use these quite explicitly, although the logic would work just fine with some other levels, it would not be the original strategy.
Good luck!

Zeal Trade HelperOnce you have mastered a trading strategy, risk management is the most important aspect of trading that will enable and long and successful trading career. The Zeal Trade Helper is based on Van Tharp's theory of R. It provides an immediate visual trading plan, as well as sizing parameters for trading equity and options (.25 and .50 deltas) based on a number of inputs to help you avoid needing to do quick mental math in the moment of taking a trade.
HOW TO USE
- First, you will need to input your R value. To find your R value, divide your **average green day** by the **average number of trades you take in a day**. Once you have this number, enter it into the "Your R Value" field in the indicator settings.
- The indicator settings then provides you with 5 different setup entries. When you have your watchlist ready for the day, simply go through and choose the specific stock, enter your entry price, stop loss, target, and setup type (build, short, bounce, or reject).
OUTPUTS
**Trading Plan**
The indicator will display a visual trading plan based on the inputs you entered on each individual stock's chart. The trading plan will have a green box and red box to represent your entry, target, and stop loss.
**Risk Parameters**
The indicator will also display text outlining what your risk parameters and sizing should be for the trade based on your R value. You will see 3 different lines: the first line showing the number of shares you can trade, the second line showing the number of option contracts you can trade at .50 delta, and the third line showing the number of option contracts you can trade at .25 delta. For reference, at the money options are .50 deltas. Even if you aren't trading exactly .50 or .25 deltas, these values will still help as a frame of reference in the moment of putting on the trade.
**Note that you can toggle the appearance of either of these outputs by checking/un-checking the boxes next to "Display trading plan" and "Display risk parameters" in the indicator settings.
Examples:
1. "**240 shares with $1.25 risk**" means you can take 240 shares and risk $1.25 on the share's price based on your R value
2. "**4.8 Cons @ .50 delta with $0.62 risk**" means you can take either 4 or 5 at the money option contracts and risk $0.62 **on the option contract's value** based on your R value
3. "**9.8 Cons @ .50 delta with $0.31 risk**" means you can take either 9 or 10 option contracts that have a .25 delta (a bit out of the money) and risk $0.31 **on the option contract's value** based on your R value
Happy Trading!
