SMA + Trend Strength + Trailing Stop LossThe 'SMA + Trend Strength + Trailing Stop Loss' indicator was designed for swing trading long positions over the course of days/weeks. The benefit of the indicator is to identify areas where the market of a given asset is showing signs of a strong uptrend, divergences, and fear. A 13-bar simple moving average is color coded to four colors based on 5 given conditions at a time, which are represented as a trend meter on the bottom right of the screen. A trailing stop loss indicator is included to secure your profits or limit your loss in case the market reverses on you unexpected. Please use this indicator responsibly with proper risk management, and never rely on the indicator by itself for buy and sell signals.
When the simple moving average color is green, it means that at least 4 of 5 conditions are confirming a move upwards, this is when you can take an entry into a trade based on your entry strategy. As the trend continues, the color will eventually change to yellow signaling a divergence. This is when you can use your exit strategy to find a good point to sell. It is wise not to take new positions when the color is trending yellow.
If the color changes from yellow to orange, that is a warning sign that the trend is about to change or has begun to change. Prices may have already fallen. However, sometimes the color will change from yellow back to green signaling a continuation of the trend. You can either keep holding or take a new position in this instance.
When the color is red, this signals fear in the market, you should stay out of the market at first. However, as the market consolidates and the color starts changing back to orange, this is an opportunity to take a long position at a reasonably low price.
Simple Moving Average (13-Bar) Color Explanation:
The colors change based on 5 market conditions represented in the trend meter.
Green: Strong Uptrend
Yellow: Divergence Present
Orange: Warning
Red: Fear
Trend Meter Explanation:
The trend meter draws 5 arrows indicating bullish or bearish presence.
LL = Lower Lows - Detects when the market is trending with lower lows.
HH = Higher Highs - Detects when the market is trending with higher highs.
MA = SMA Direction - A formula is used to determine the direction of the SMA.
DI = Directional Index - Identifies when upwards momentum is trending.
RSI = Relative Strength Index - Identifies when the RSI is in an uptrend state.
Note: For advanced users, this indicator has a hidden DMI(4, 4, 4) and RSI(14) indicator used to determine the last two conditions. The Directional Index is based on a DI Plus momentum moving average to determine a momentum trend and the RSI trending over 50 will constitute an uptrend signal as below 50 it will point down.
Trailing stop loss:
The trailing stop loss is determined based on the lowest price of the last 8 bars.
A gray step-line is drawn at the suggested stop activation price.
A red step-line is drawn at the suggested stop limit price.
When the price breaches the trailing stop, a red X will appear below the bar.
You can turn each of these features on or off based on your preference. Happy trading!
Sma

7EMA_5MA with Next Openbased on storwize's EMA/SMA script. Added a forecasting for the where the EMAs/SMAs will be in the next bar assuming a close where it currently is.

3MA with Perfect Order Alert / 移動平均線パーフェクトオーダーJapanese below / 日本語説明は下記
This indicator shows 3 sets of MA(Moving Average) and perfect order alert.
What is Perfect Order?
Perfect order means that multiple MA(s) are in ascending order from short term MA to long term MA in upward trend and in descending order from long term MA to short term MA.
e.g. Let’s say you set 3 MA like;
MA1(short term): 5MA
MA2(mid term): 20MA
MA3(long term): 50MA
and if these MA are in ascending order from 5MA to 50M in upward trend, this is perfect order.
Likewise if 3MA get in descending order from 50MA to 5MA in downward trend, this is perfect order.
What does Perfect Order mean in trading?
Perfect order means that markets move with strong trend and good opportunities to trade following trends.
Specifications
-You can set 3 MA on this indicator, however, have to set periods of MA according to the label of each MA: short term, mid term and long term or the indicators cannot judge perfect order.
-Each MA can select SMA or EMA.
-If 3MA become perfect order(PO), then signal will be shown on the chart with green triangle for ascending perfect order which suggests potential buying opportunity and red triangle for descending perfect order which suggests potential selling opportunity.
-You can control display of the signal ticking/unticking the checkbox at parameter.
Sample chart with the indicator
——————————————————————————————
3本の移動平均線(MA)とパーフェクトオーダーのシグナルを表示するインジケーターです。
パーフェクトオーダーとは?
パーフェクトオーダーとは複数の移動平均線が、以下の順番に並んだ状態のことを指します。
・上昇トレンドの場合
移動平均線が上から短期・中期・長期の順番に並んだ状態
・下降トレンドの場合
移動平均線が上から長期・中期・短期の順番に並んだ状態
パーフェクトオーダーが意味するものは?
パーフェクトオーダーが発生した状態とはマーケットが非常に強いトレンドを伴って動いていることを示します。トレーダーにとってはトレンドフォローでトレードするチャンスとなります。
機能概要
・このインジケーターでは3本の移動平均線を設定することができます。ただしパラメーター設定画面で指定された、短期・中期・長期に合うように、それぞれの移動平均線の期間を設定する必要があります。
例えば5,20,50期間の3本の移動平均線を設定する場合、短期欄に5,中期欄に20,長期欄に50と設定する必要があります。(それ以外の場合はパーフェクトオーダーのシグナルが表示されません。)
・それぞれの移動平均線はSMAかEMAを設定することができます。
・移動平均線がパーフェクトオーダーとなった場合、ローソク足の近くにシグナルが表示されます。緑が上昇パーフェクトオーダー、赤が下降パーフェクトオーダーです。
・シグナルの表示有無をチェックボックスで制御できます。
チャート表示例

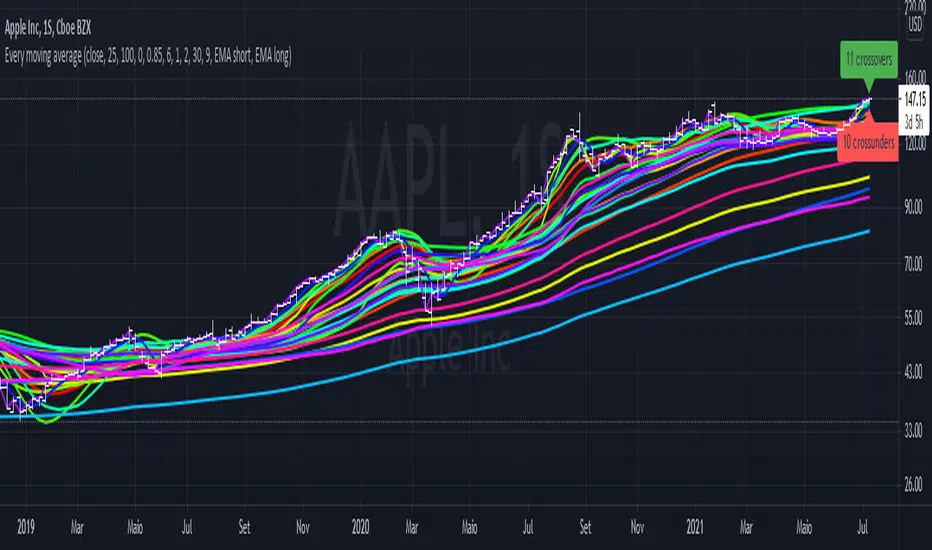
Crypto EMA+MA+MACS by hobbeLeThis is an indicator that includes several EMAs and MAs (Used in Cryptotrading).
In addition, the Golden and Death Cross are also displayed.
Used MAs
MA 7 - Orange Line
MA 21 - Yellow Line
MA 25 - Grey Line
MA 99 - Blue Line
MA 200 - Green Line
Used EMAs
EMA 200 - Grey Dotted Line
EMA 222 - Pink Dotted Line
Golden Cross
Crossover MA25 + MA200
Death Cross
Crossunder MA25 + MA200
What is a Moving Average (MA) ?
A moving average (MA) is a widely used indicator in technical analysis that helps smooth out price action by filtering out the “noise” from random short-term price fluctuations.
Moving average is a trend-following, or lagging, indicator because it is based on past prices. The most common applications of moving averages are:
to identify the trend direction
to determine support and resistance levels
The two basic and commonly used moving averages are the simple moving average ( SMA ), which is the arithmetic average of a security over a defined number of time periods, and the exponential moving average ( EMA ), which gives greater weight to more recent prices.
What is a Golden Cross?
The golden cross is a candlestick pattern that is a bullish signal in which a relatively short-term moving average crosses above a long-term moving average. The golden cross is a bullish breakout pattern formed from a crossover involving a security's short-term moving average (such as the 15-day moving average) breaking above its long-term moving average (such as the 50-day moving average) or resistance level. As long-term indicators carry more weight, the golden cross indicates a bull market on the horizon and is reinforced by high trading volumes.
What Is a Death Cross?
The death cross is a technical chart pattern indicating the potential for a major selloff. The death cross appears on a chart when a stock’s short-term moving average crosses below its long-term moving average.
Source; Investopedia

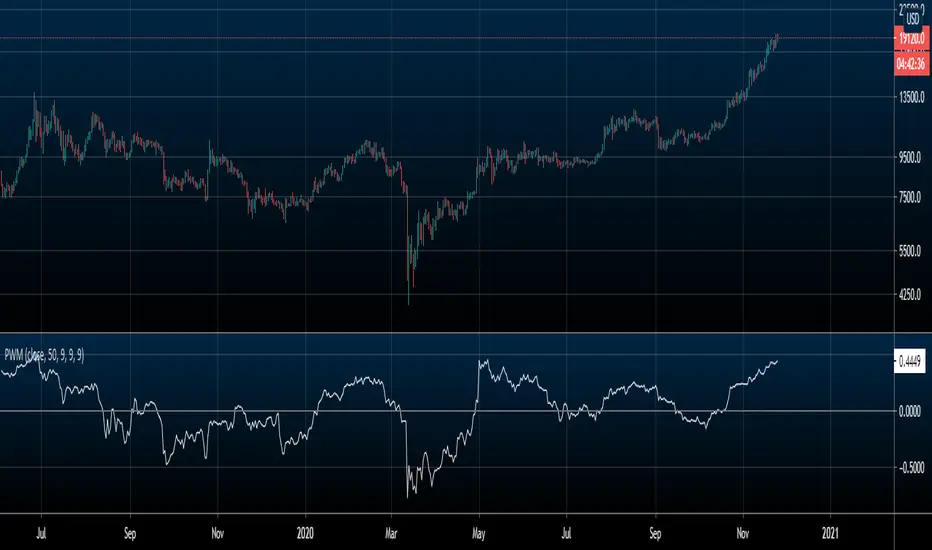
Price Weighted MomentumThis indicator is a momentum indicator that is standardized by price. A.K.A (momentum / price)
The purpose of this indicator is to compare momentum between different assets regardless of price.
EX: Bitcoin will always have more momentum than XLE because it's price is $19000 (as of writing this) compared to XLE's price of $40 (as of writing this). But if you divide the momentum by price, you get a standardized value to better compare the 2.
This indicator can be used to compare everything on TradingView.
HOW TO USE/INTERPRET
Positive values denote an uptrend
Negative values denote a downtrend
A value of 0 (or very very close to 0) denotes sideways price action
WHAT'S INCLUDED
Price Weighted Momentum (Unsmoothed by default)
Optional smoothing with either a simple or exponential moving average
Side note: I only added functionality of smoothing for EMA and SMA for my personal uses, but if you want a version of this with another way of smoothing (e.g. HMA, SSMA, etc.) that you would like, the cost of me adding that for you is a follow on Twitter. Just DM me there :)
Combo Backtest 123 Reversal & Volume SMA This is combo strategies for get a cumulative signal.
First strategy
This System was created from the Book "How I Tripled My Money In The
Futures Market" by Ulf Jensen, Page 183. This is reverse type of strategies.
The strategy buys at market, if close price is higher than the previous close
during 2 days and the meaning of 9-days Stochastic Slow Oscillator is lower than 50.
The strategy sells at market, if close price is lower than the previous close price
during 2 days and the meaning of 9-days Stochastic Fast Oscillator is higher than 50.
Second strategy
Volume and SMA
WARNING:
- For purpose educate only
- This script to change bars colors.

Array SMACalcuating SMA on an Array
In this script i show you how to calculate SMA on an array.
Several values are plotted just for illustration.
Steps to follow:
- make sure you have an array with values (source array)
- create a blank array (pref. with the same size)
- call the function array_sma
This function fills the empty array with the SMA values of the source array.

A Useful MA Weighting Function For Controlling Lag & SmoothnessSo far the most widely used moving average with an adjustable weighting function is the Arnaud Legoux moving average (ALMA), who uses a Gaussian function as weighting function. Adjustable weighting functions are useful since they allow us to control characteristics of the moving average such as lag and smoothness.
The following moving average has a simple adjustable weighting function that allows the user to have control over the lag and smoothness of the moving average, we will see that it can also be used to get both an SMA and WMA.
A high-resolution gradient is also used to color the moving average, makes it fun to watch, the plot transition between 200 colors, would be tedious to make but everything was made possible using a custom R script, I only needed to copy and paste the R console output in the Pine editor.
Settings
length : Period of the moving average
-Lag : Setting decreasing the lag of the moving average
+Lag : Setting increasing the lag of the moving average
Estimating Existing Moving Averages
The weighting function of this moving average is derived from the calculation of the beta distribution, advantages of such distribution is that unlike a lot of PDF, the beta distribution is defined within a specific range of values (0,1). Parameters alpha and beta controls the shape of the distribution, with alpha introducing negative skewness and beta introducing positive skewness, while higher values of alpha and beta increase kurtosis.
Here -Lag is directly associated to beta while +Lag is associated with alpha . When alpha = beta = 1 the distribution is uniform, and as such can be used to compute a simple moving average.
Moving average with -Lag = +Lag = 1 , its impulse response is shown below.
It is also possible to get a WMA by increasing -Lag , thus having -Lag = 2 and +Lag = 1 .
Using values of -Lag and +Lag equal to each other allows us to get a symmetrical impulse response, increasing these two values controls the heaviness of the tails of the impulse response.
Here -Lag = +Lag = 3 , note that when the impulse response of a moving average is symmetrical its lag is equal to (length-1)/2 .
As for the gradient, the color is determined by the value of an RSI using the moving average as input.
I don't promise anything but I will try to respond to your comments

Bollinger Band+ Multi EMA, SMAHello Everyone.
I make Bollinger band , 3 ema and 3 sma combined.
I think this indicator can use all timeframe.
--------------------------------------------------------------
Indicator will show you
1. Trend follow
2. Pullback catch
2. Market bounce.
1. Trend Follow
- Trend Follow for I used 3 terms. They are short, Mid and Long Trend.
2. Pullback Catch
- EMA for Save, take care, alert Zones.
- Mid Term Trend can be catch also.
3. Market Bounce
- Bollinger Band will show you market re-bounce point.
Final Notes
Indicator will show Trend, Pullback, Market bounce and some support and resistant level.

London breakout GBPUSD daytradeHello,
First I want to WARN THAT YOU NEED A MINIMUM OF 30X LEVERAGE FOR THIS STRATEGY IN ORDER TO WORK.
THE REASON IS THAT THE SIZE IS CALCULATED BASED ON A VERY SHORT STOP LOSS LEVEL IN PIPS
UTILIZE IT AT YOUR OWN RISK
This is a daytrading strategy, that's suited for GBPUSD 1H timechart.
It a very simple strategy that utilizes 2 moving averages : a very fast one and a very slow one.
It will always enter only at the beginning candle of London session, and it will always exit at the candle at the finish of London session.
So the rules are simple :
If its 8 am GMT and the candle close or high cross the slow moving average and we are above at the same over the slow moving average we make a long movement. The oposite condition is applied for short.
At the same time we always use a very small stop loss = 50-100 points ( 5-10 pips).
We dont have a take profit, in our case the trade ends always at the end of London session. In this case at 15h GMT
It might work on other currencies aswell, but it has to be tested first.
For any questions or suggestions, please let me know.

BB21_MA200_StrategyThis strategy follows the trend and keeps you in the trend until it breaks SMA 200
SMA setting is 200
BB setting is 21
BUY
====
when BB is (lower band and upper band) above SMA 200 and price crossing above BB middle line
Partial Exit
==========
When Lower BB crossing down SMA200 , exit 30%
Total Exit
=========
When BB middle band crosses down SMA200 , exit ALL
Stop Loss
======
default is set to 5%
Risk Management
================
This is new parameter I have introduced in my strategies. Default value is 10% . That means , if your capital is 10000 , you are willing to risk 10% of it ... i.e 1000.
It doesnot mean that you are buying shares/units for 1000 only. It is different ...see below
Your trade size is calculated based on Risk% .... capital x risk 5 / stop Loss units
for further explanation you can check Alexander Elder's risk management rule. He mentioned 2% rule for 100K account. But most of us dont have 100K accounts .. . so I have defaulted 10% on 10K account. You can change this values and see the results. It wont change the number of trades or profit factor. It will increase the net profit.
Warning
=======
For educational purposes only

4 Moving Exponential Average (EMA) indiactorWith this you can add four different EMA in single indicator.
You can also add different time frame EMA on different time frame charts.
This will help you to check EMA crossovers.
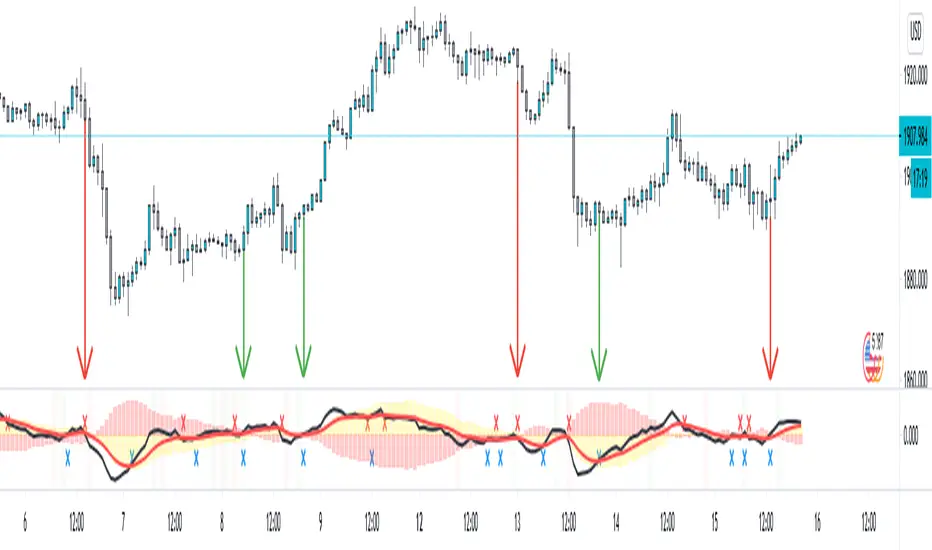
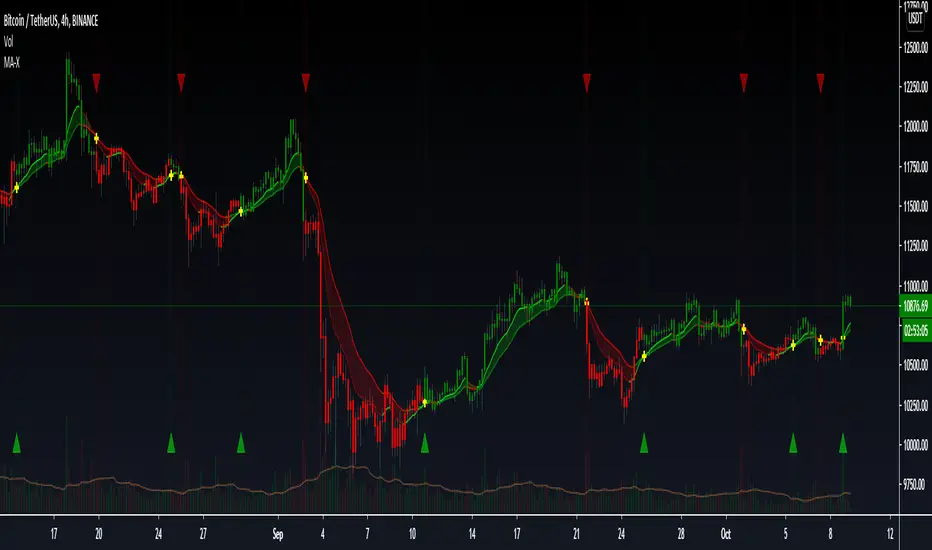
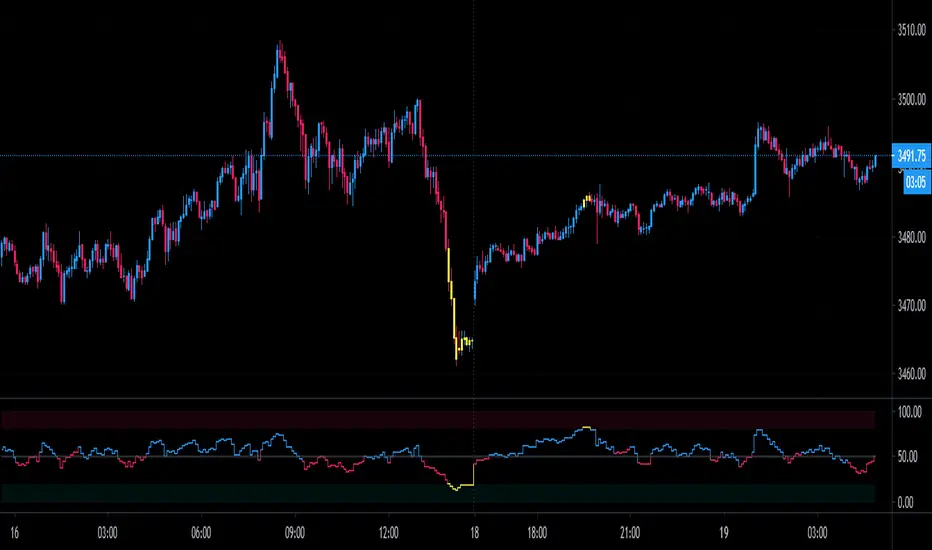
Pip RaidPIP RAID is another form of a macd Most indicator use close as their primary source which is good but side effect of it is the lag in 1-2 candles
I created in the past the VPT indicator which is a volume indicator similar to OBV and I tranform it to be ised as a source insted of close . the reason for it since it a volume based indicator it faster and can help in the lag issue
when you see a cross or plus sign appear it means that emas are touching not crossing so its sign of a potential move
when you see the highlighted red or green background appear it means that the emas have crossed
you can also see trend change , check columns if GOLD/RED if gold above 0 its a uptrend if it below its starting down trend ....
Easy System 420In this strategy, 15 indicators are used, each giving its results as a numerical value, which then is added or subtracted from the total points, gathered from all 15 indicators.
Many thanks to RafaelZioni for his great work making the EasySys1 script which i modified to create this script.
Onchart is drawn some of the indicators, but not all, a info panel is drawn showing the value each indicator has calculated. The info panel can be turned on or off.
Many of the indicator settings can be changed by user, and this is recommended, to tune the strategy to users chosen pair/timeframe.
Therefore any pair or timeframe can be used, the strategy tester results showing possible results, remember to set commission to match your broker. example chart settings here have common crypto exchange commission value: 0.25%
indicator list : SAR + STT + ZigZag + ROC + DMI + CCI + Weis + SMA + AO + MOM + Hist + BB + Ichimoku + HMA

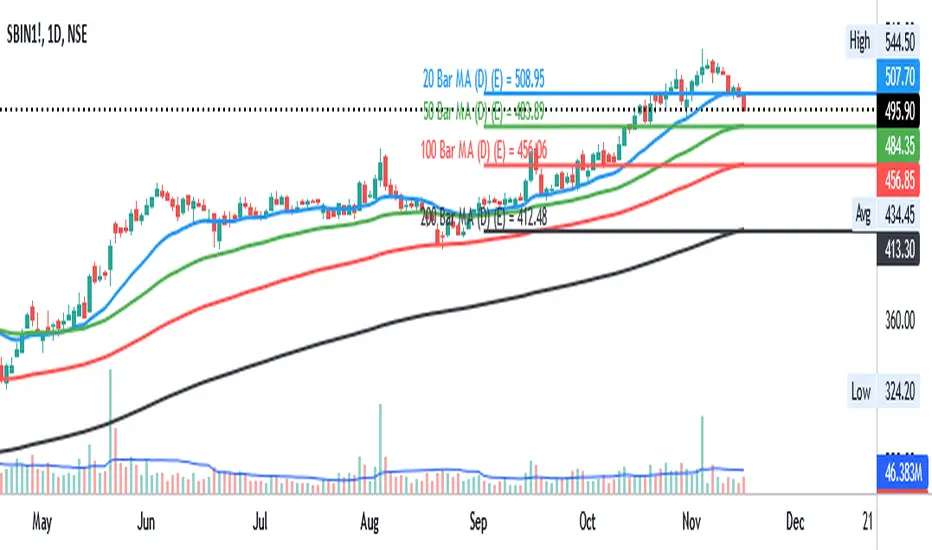
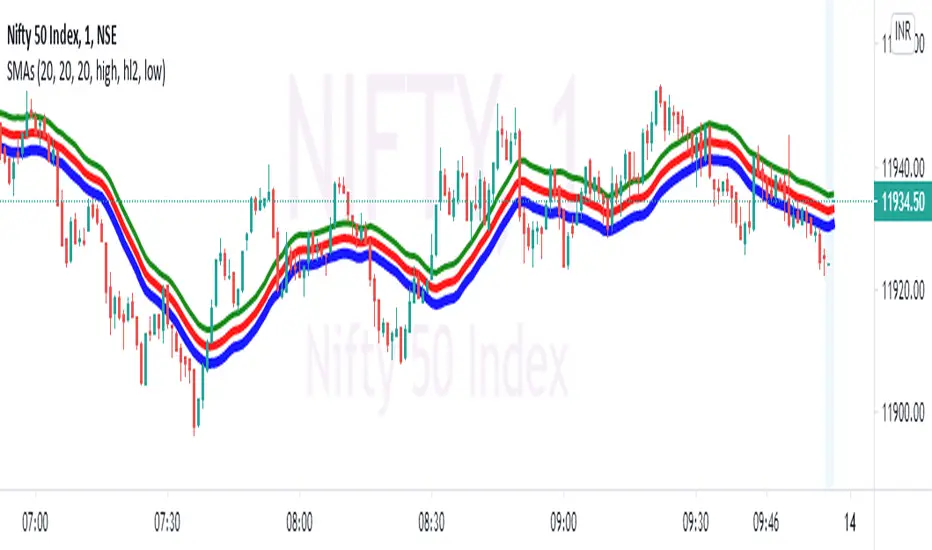
SMAs (20,20,20) by Ankitthis script is a combination of 3SMA"s of 20 period. it works very good in low time frame, the breakout candle will confirm the trade n also sl Will be sMall.
WMA DynamicDemonstration of a new feature that allows to change lookback period dynamically, used with WMAs. Rather than WMA any one can be used here (SMA, Alma,...) as long as its second argument supports dynamic change. If not, you have to use your own implementation of MA.

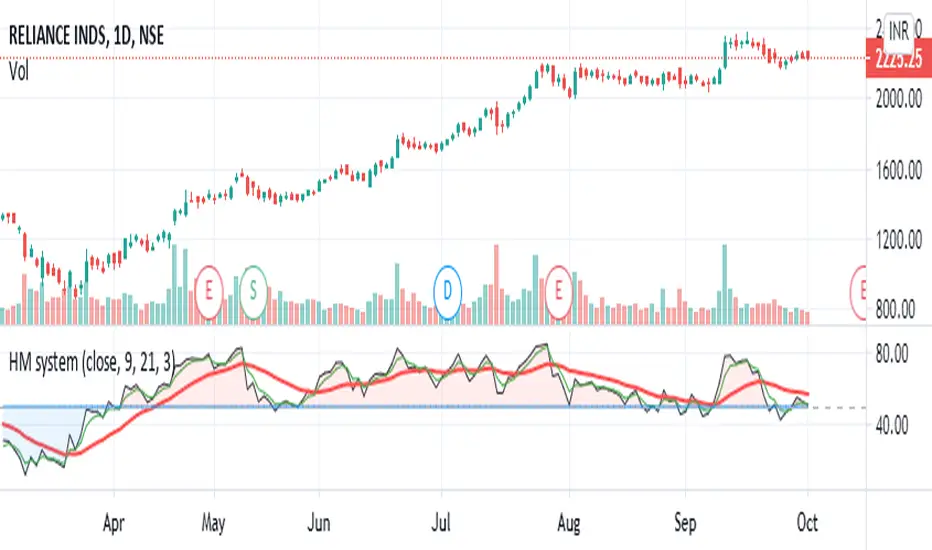
HM systemBlank line is RSI (9 days) line
Green line is EMA (3 days) line
Red line is WMA (21 days) line
when RSI EMA line above 50 & WMA is below both ,it is buy signal
when RSI EMA line below 50 & WMA is above both ,it is sell signal
MA Cross - Multi-Timeframe The MA cross is probably one of my favourite strategies because of its simplicity but it often gets overlooked for more complex strategies.
The original author of this script is ChartArt, I have just added some extra controls and functions which are outlined below. I would just like to add that this is my first published script, everything I have learned about coding has been from studying and tinkering with many of the publicly available scripts on TV so I would like thank all the authors who give out this knowledge so freely!
Updates
- Converted to v4
- Made some graphical changes and provided more control over plots
- Added RMA and VWMA
- Added alerts
Original script can be found here
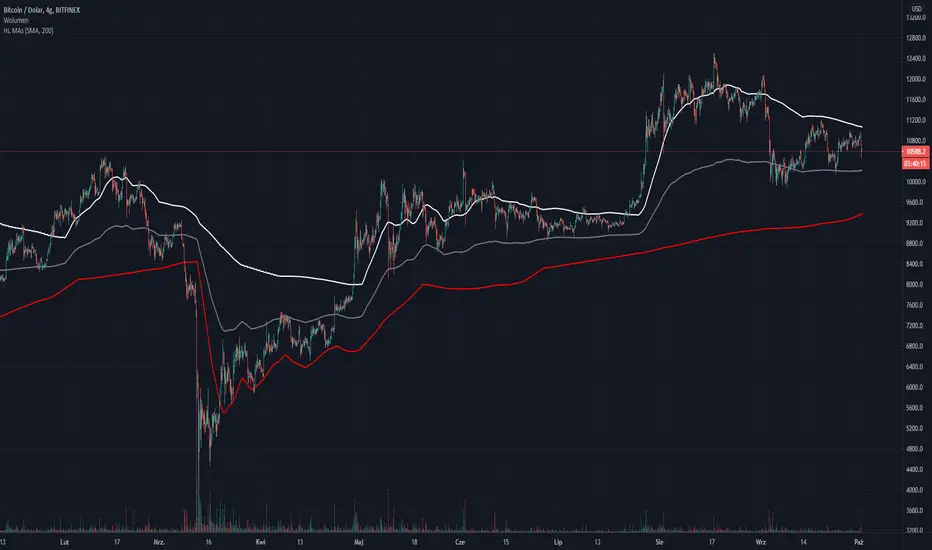
HL MAsMain features of this script are:
* To show always highest and lowest value from given Moving Averages of certain intervals (30min, 1h, 2h, 4h. 6h, 12h, 1D, 3D, 1W to choose from, multiple choices are possible and desired).
* It also draws the middle line made of highest and lowest MA lines.
* If you would like to see all the MAs to see how its working you can turn them on from the scripts options ("Show all MAs").
* You may switch between SMA and EMA.
* You may set the length of which MAs on all set intervals will be calculated.
* The plus of using this is also that no matter what interval you have on chart, you will always see MAs from set up intervals, so lines will be always in the same places on chart.
ps. This script is invite-only for the members of our trading group (info in signature, group is free of charge).
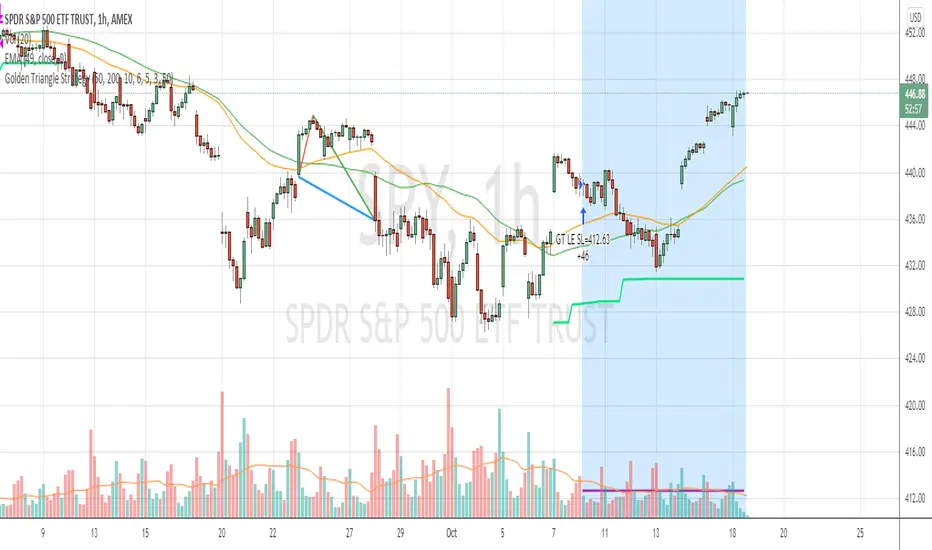
Golden Triangle StrategyGolden Triangle strategy setup is a variation of the buy-the-dip strategy, by Charlotte Hudgin.
You can find the detailed explanation here by Thomas N. Bulkowski thepatternsite.com
BUY
===
1. price should be trading above sma50
2. when it touches sma50 first time , check the starting rallypoint of where it initiated
3. from the above point to current close , see if you have white space , then draw the triangle
4. then check for volume confirmation ( current volume should be greater than last 4 ) --- I have slightly changed this to fit into hourly strategy by adding condition close>vwap
EXIT
====
1. Exit when close crossing down sma50 with at least 2% profit (slightly modified original condition)
StopLoss
========
2. stop loss is set to 6%
Warning
=======
For the use of educational purposes only
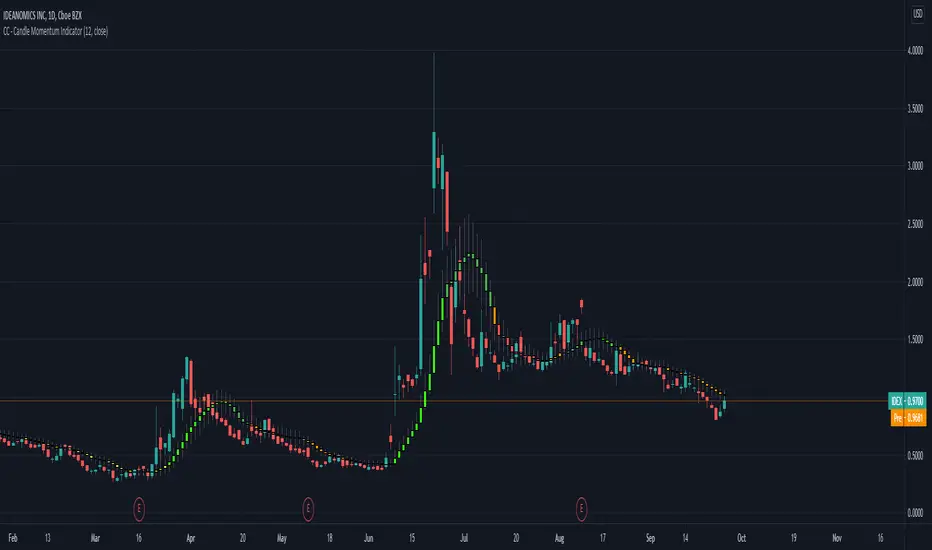
CC - Candle Momentum IndicatorA simple VWAP and SMA smoothing on the candles along with some momentum coloring. Basically, if the "slider" is slid all the way up and it turns red, moving down or losing volume t's probably going down. If it's all the way down and starts turning green, getting bigger and seeing volume, it's probably going up. this is a prototype indicator that I plan to extend using arrays and averages if it is seen as something useful.
GMS: The OscillatorThis is my version of an RSI. Basically treat it the same way, but needless to say there's a few more things going into it than just the closing price.
The color of the line is based on my HAMA JAMMA indicator so they could be used in conjunction to help pick potential trend reversals in either direction, overbought and oversold levels will turn the line yellow.
The "Make that a combo?" selection will change the curve and make it more sensitive to sharper price movements.
This works on any time frame as well as any bar type, although for certain bar types you'll probably have to tweak the settings to see what works.
I hope it helps,
Andre
Every single moving average (ALMA, EMA, HMA, KAMA, RMA, SMA...)So you may be looking at the graph and thinking "this is a mess", and I agree.
The purpose of this script is to plot in the same graph every single type of moving average that I could think of, so you can find the ones that are better for your timeframe and for your asset. Once you add it, disable those types that doesn't seem to serve your purpose, until you can select one you like.
The average types are: ALMA, EMA, HMA, KAMA, RMA, SMA, SWMA, VIDYA, VWAP, VWMA, and WMA. Each one is ploted two times (except SWMA and VWAP), one with a short period, and another with a long, both of which you can configure.