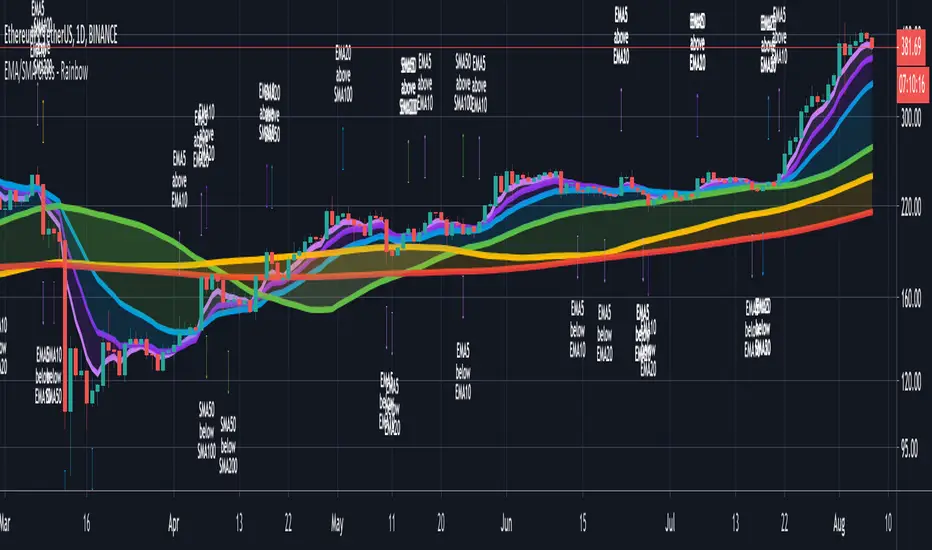
CryptoSignalScanner - Advanced Moving Averages - Cross & RainbowDESCRIPTION:
With this script you can plot 6 moving averages.
You can decide which Moving Average you want to show or hide.
For every plot you can decide to display the Simple Moving Average ( SMA ) or Exponential Moving Average ( EMA ).
It provides CrossOver and CrossUnder labels when loading the script. Those labels you can show or hide.
You have the possibility to show or hide the rainbow colors. This rainbow function gives you a clear view of the current trend.
HOW TO USE:
• When one Moving Average crosses above another Moving Average it signals an uptrend.
• When one Moving Average crosses below another Moving Average it signals a downtrend.
• The higher to length of the Moving Average the stronger the trend.
FEATURES:
• You can show/hide the preferred Moving Averages.
• You can set the length, type and source for every Moving Average.
• You can show/hide the rainbow colors.
• You can show/hide the CrossUp labels.
• You can show/hide the CrossDown labels.
• You can set alerts for every Moving Average.
• Etc...
DEFAULT SETTINGS:
• MA1 => EMA5
• MA2 => EMA10
• MA3 => EMA20
• MA4 => SMA50
• MA5 => SMA100
• MA6 => SMA200
Simple Moving Average vs. Exponential Moving Average:
SMA and EMA are calculated differently. The exponential moving average ( EMA ) focuses more on recent prices than on a long series of data points, as the simple moving average required.
The calculation makes the EMA quicker to react to price changes and the SMA react slower. That is the main difference between the two.
One is not necessarily better than another. It comes down to personal preference. Plot an EMA and SMA of the same length on a chart and see which one helps you make better trading decisions.
Moving Average Trading Strategies:
The first strategy is a price crossover, when the price crosses above or below a moving average, it signals a potential change in trend.
The second strategy applies when one moving averages crosses another moving average.
• When the short-term MA crosses above the long-term MA, it signals a buy signal.
• When the short-term MA crosses below the long-term MA, it signals a sell signal.
REMARKS:
• This advice is NOT financial advice.
• We do not provide personal investment advice and we are not a qualified licensed investment advisor.
• All information found here, including any ideas, opinions, views, predictions, forecasts, commentaries, suggestions, or stock picks, expressed or implied herein, are for informational, entertainment or educational purposes only and should not be construed as personal investment advice.
• We will not and cannot be held liable for any actions you take as a result of anything you read here.
• We only provide this information to help you make a better decision.
• While the information provided is believed to be accurate, it may include errors or inaccuracies.
If you like this script please donate some coins to share your appreciation.
Good Luck,
SEOCO
Sma
EMA_VTX
Abbreviations:
EMA - Exponential Moving Average
SMA - Simple Moving Average
WMA - Weighted Moving Average
VWMA - Volume-Weighted Moving Average
TP - TimePeriod (1m,2m,5m,1h....)
TP Steps - 1m,3m,12m,1h,5h,D (This steps i use)
Use-case:
Moving Average Exponential is a good indicator of Support and Resistance Level. Giving us average price level in particular moment.
This script calculates and plots Moving Average with minute precision, even if you want to see 21 EMA level from 1H chart.
So you can accommodate all important information on one chart with best precision.
Made for Intraday Perioads.
Best used for DayTrading, when you need to make quick and efficient decisions.
EMA_VTX = Preferred resolution * Length / Present resolution.
In addition to plotting EMA , you can quickly switch between SMA, WMA, VWMA .
Settings:
Resolution - Most used TP included, plus some exclusive paid plans (1m, 2m, 3m, 5m, 12m, 15m, 1h, 4h, 5h, Daily). Default set to 1h
Use - Bonus function for EMA indicator. You can quickly switch type from EMA to SMA, WMA,VWMA
Length - standard function. Default set to 144
Offset - standard function. Default set to 0
Source - standard function. Default set to hlc3
Why to use it ?
Yes, i know that variable TP is standard now in TradingView. But there are some limitations, especially for DayTraders.
Problem:
Imagine you are trading/scalping on 1m.. 5m.. 15.. charts and you want to see where are your Higher TP MAs.
-- You can change to 1h and check it, but you will loose the picture from smaller TP.
-- You can use Standard EMA TP function, but your MAs data will update every 15m, 1h (depends on TP)
Solution:
This script help to solve this problem, by breaking information down to 1m and building from there.
So whatever Intraday TP you choose to trade, your MAs will be updated with minute precision.
Limitations:
Sadly nothing without limitations.
1. You can experience "Reference too many candles in history" around 5K - This means that too many candles are used to plot MAs.
-- Quick fix: Reduce "Length" or Step down TP (best experience when projecting MAs 1-2 TP Steps up)
2. For Best performance use only Higher TP dividable By Yours (ex. You use 3m chart, then you can plot 12m, 15m, 1h / You use 5m chart, then you can plot 15m, 1h. 12m will already have 3m of information lost using 5m Chart )

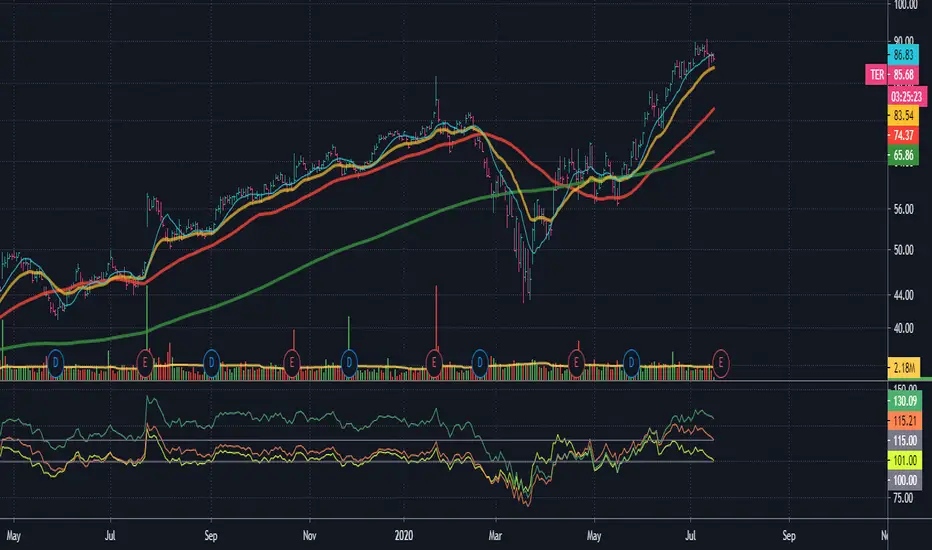
Weekly & Daily SMA 50/100/200The daily and weekly simple moving averages (SMA) are displayed in all timeframes.
The SMAs can be used for support and resistance. The lines of the past 50, 100 and 200 days and weeks are considered strong supports and resistances.
The daily lines are yellow and the weekly lines are green. The thicker and more visible a line is, the more important it is in the chart.

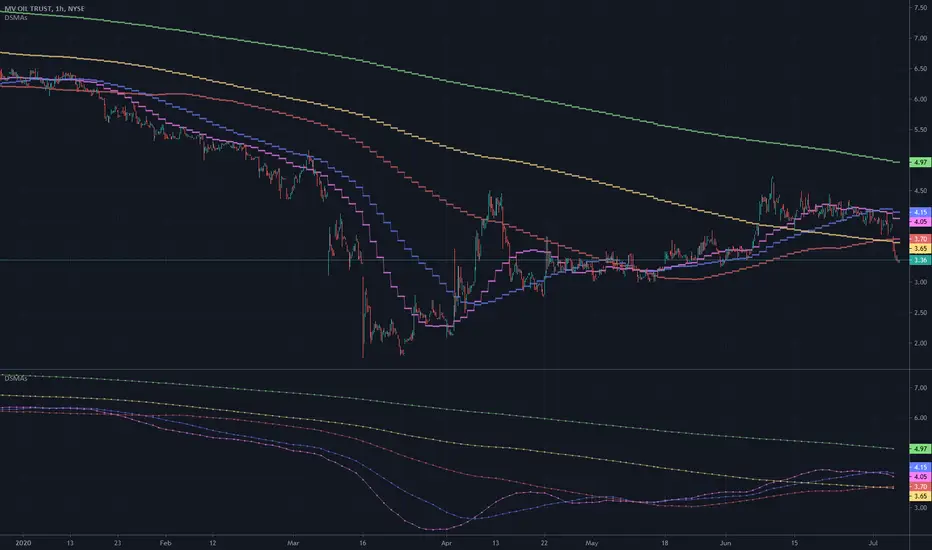
Moving Average DoublesThis script plots multiple moving averages each source based on its previous MA, all having the same length.
Input options:
Simple Moving Average ( SMA ) or Exponential Moving Average ( EMA )
One adjustable look back period
Choose how many MA's to display, max. 50
One adjustable line width
It probably works best for long term views to find trends or zones of confluence, and it looks awesome :)
Don't be afraid to share your thoughts or settings in the comments. Enjoy!

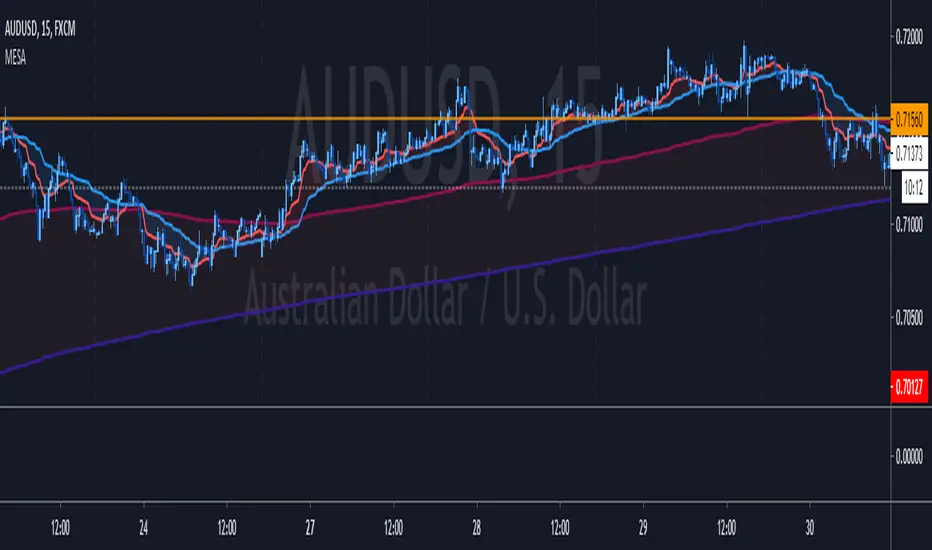
MESA Adaptive Moving Average - Improved MTFThis indicator is a huge upgrade to my original MTF MESA
Plots are now extremely smooth and accurate on all timeframes **
Missing data points are automatically filled with the "best fit"
This is a Trend indicator and should be used to trade "top-down" aka:
Start with the Daily chart to confirm a trend
Move to 4H
2H
Etc...
Use your favorite entry method or simply watch for wicks forming when the price gets near the MESA adaptive moving average.
This is one of the few indicators that I've been using for years with success. Being able to plot both the current & higher timeframe MESA
can sometimes feel like cheating.
Due to the nature of the recursive calculation, you may notice slight differences between this version of MESA and others that either
approximate higher timeframes with fewer samples or make use of the latest "Resolution" argument in Pinescript V4. Both of which are
fine, until you start looking at M5 charts while plotting the Daily MESA.
As always, happy trading!
** Currently supports
M 1,3,5,15,30,45
H 1,2,3,4
Day 1
Week 1
Month 1
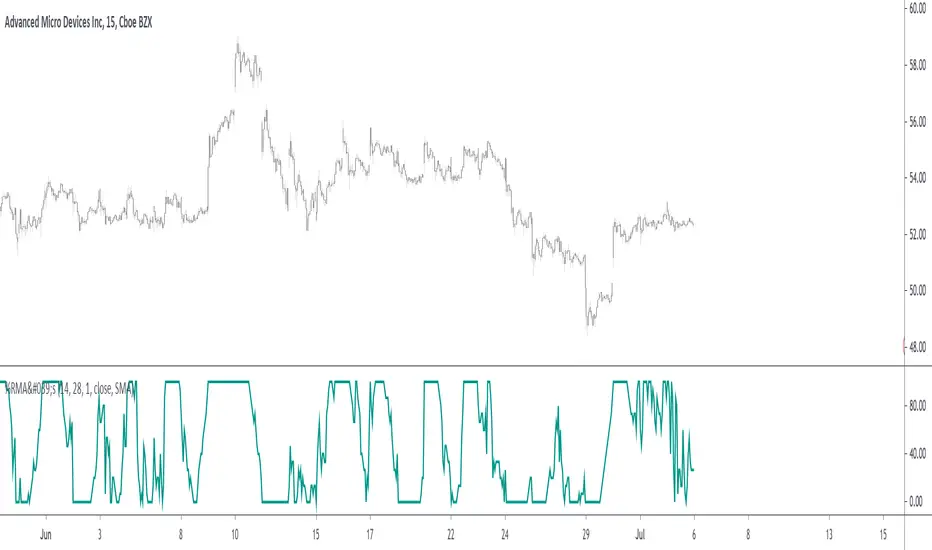
Percentage Price Over SMAReturn the percentage of closing prices greater than SMA's with periods within a user-selected range. An exponential moving average applied to these results is also displayed (in orange).
Settings
Min : Minimum period of the SMA in the range
Max : Maximum period of the SMA in the range
Smooth : Period of the EMA
Src : Input series of the indicator
Usage
The indicator is a normalized oscillator. A value of 100 indicates that 100% of the current closing price is over SMA's with periods ranging from min to max , this indicates a bullish market, while a value of 0 would indicate a bearish market.
In this image the indicator use min = 50 and max = 200, here AMD has been strongly bullish at the start, and ended being strongly bearish at the end, during this bullish period the indicator is over its overbought level, while it is under its oversold level during the bearish period.
In case the market is ranging we can expect the indicator to be around 50%, using the smoothed result might be more useful to detect ranging markets with this indicator.
If the smoothed result is within the overbought/oversold levels, then we can say that the market is either ranging or transitioning from a bullish/bearish market to an opposite one.

Scalpy MFI*Modified version of my Scalpy indicator replacing RSI with MFI*
It is made up of a 2 main parts.
- The cloud comprising of a 10 period SMA and a 30 period SMA .
- When the cloud is green you should be looking for long entries.
- When the cloud is red you should be looking for short entries.
- Price is most bullish above a green cloud and most bearish below a red cloud.
- Being within the cloud indicates indecision.
The red line represents the MFI

Rockstar - Pullback FlagSimple script to identify pullbacks in an uptrend.
Indicator will add yellow flags if ideal conditions are met.
Additionally plots SMA20, SMA50 and SMA200.
Use this indicator in combination with observed price action and your own strategy.
Do no trade blindly on this indicator.
Conditions:
Price above 200MA
50MA above 200MA
20MA near 50MA
RSI reset below 55
Price delta is close to delta between 20MA and 50MA (trying to filter out volatile moves)
Closed price is near 20MA (setting up again for a move)

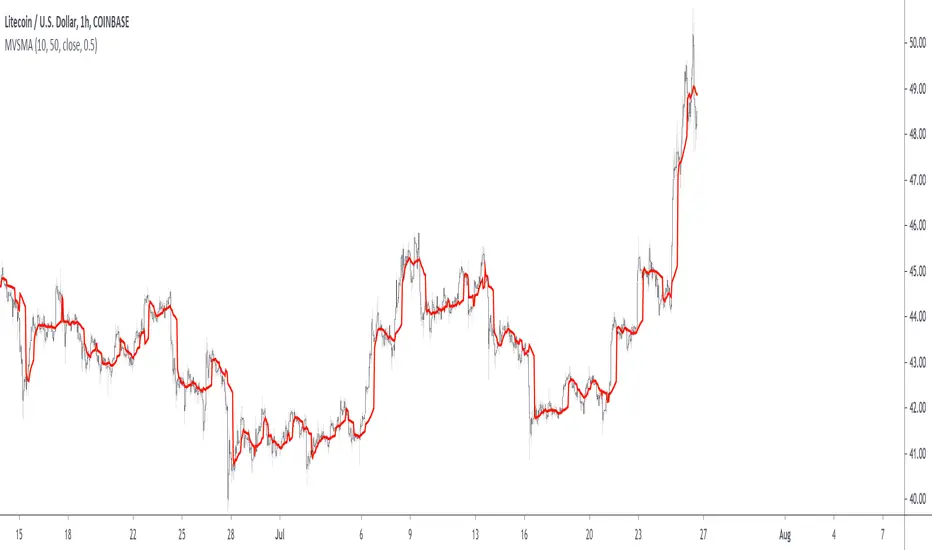
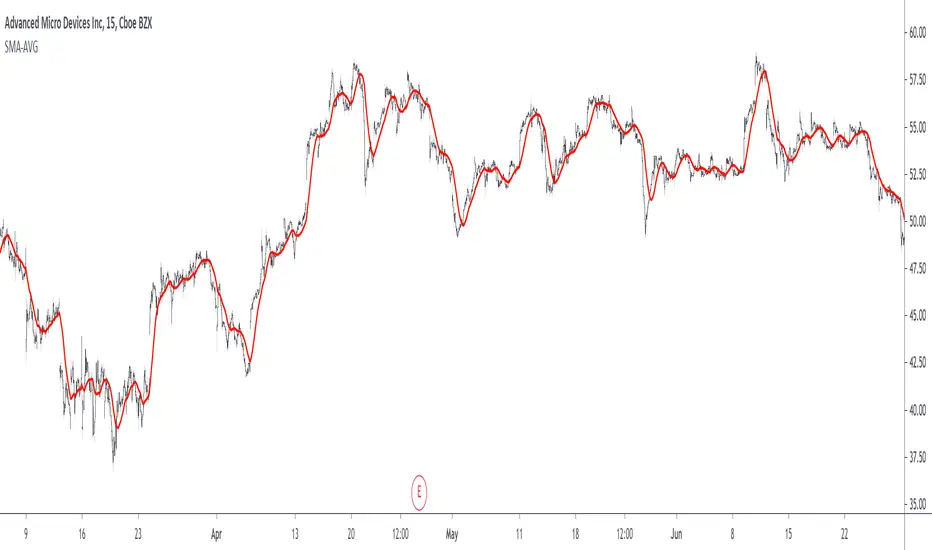
Minimum Variance SMAReturn the value of a simple moving average with a period within the range min to max such that the variance of the same period is the smallest available.
Since the smallest variance is often the one with the smallest period, a penalty setting is introduced, and allows the indicator to return moving averages values with higher periods more often, with higher penalty values returning moving averages values with higher periods.
Because variances with smaller periods are more reactive than ones with higher periods, it is common for the indicator to return the value of an SMA of a higher period during more volatile market, this can be seen on the image below:
here variances from period 10 to 15 are plotted, a blueish color represents a higher period, note how they are the smallest ones when fluctuations are more volatile.
Indicator with min = 50, max = 200 and penalty = 0.5
In blue the indicator with penalty = 0, in red with penalty = 1, with both min = 50 and max = 200.
On The Script
The script minimize Var(i)/p with i ∈ (min,max) and p = i^penalty , this is done by computing the variance for each period i and keeping the smallest one currently in the loop, if we get a variance value smaller than the previously one found we calculate the value of an SMA with period i , as such the script deal with brute force optimization.
For our use case it is not possible to use the built-in sma and variance functions within a loop, as such we use cumulative forms for both functions.
Z+ Trend Finder & Breakout 3in1 for Crypto Stock & Forex TradingDear all,
If you like this indicator please hit the like button and do follow me. It takes lot of effort & calculations to bring some good strategy on charts. Keep Supporting & will update this indicator regularly.
Z+ Trend Finder Pro🚀 by Zia 💎 a combination of RSI+MACD+SMA
Z+ Trend Finder Pro is a 3in1 Indicator for Crypto, Stock Market & Forex Trading. This indicator is a combination of RSI , MACD , SMA & few other important settings with unique strategy keeping scalping & intraday trading in mind. Please read all points below for better understanding of how this indicator works. I'll make it very simple and easy to understand.
When you load the indicator on chart, you will see candles in 2 colors blue & dark brown (You can change color from settings if you want).
Blue means price is going up
Brown means price is going down
On Top you will see thick Red line - Overbought , means if price is above this line ( RSI above 80) - market is overbought and RSI is too high and chances market will reverse.
Bottom you will see thick Green line - Oversold , means if price is below this line - market is oversold & RSI very low around 20 & chances market will reverse.
In-between you will thick Green/Red line called breakout line . If price is below this line, color will red means market is in downtrend and will further go down.
If price is above this line, its color will be green & means market is in up trend and will go further up.
Breakout Line -
Whenever price break the Breakout line upside, up breakout will come means open long position, if downside, down breakout will come means open short.
Rest things are self explanatory.
Apart from this, you will see green and red bands. The wider the band indicates trend is strong, & if bands width is getting narrow means trend is fading - Get out of trade at that time.
Market overview Display Box
On the right side, you will see yellow box with particular coin details along with other market top performing coins in terms of MarketCap. From settings you will change it to either Crypto, Stock or Forex. You can control the display of this box from script setting.
Which is the best timeframe to use with this indicator?
I personally check things first at 1hr chart, to know how market is performing in broad time frame.
Next if you see more volatility in market, you can use 15min time frame too.
Also it depends from coin 2 coin and market conditions too. Sometimes you will find things are pretty good with 5 min and sometimes 15min, and sometimes you might stick with 1hr.
EURUSD Example
NIFTY Example
What is the accuracy?
Personally when i use it with 1hr TF for intraday swing calls, i see pretty good result & accuracy almost above 90%.
But do keep in mind, its not a magical stick - always DYOR fully after seeing any type of recommendation from this indicator either on buy/long or sell/short side.
Disclaimer:- This indicator is just for educational purpose and does not guarantee to make you rich overnight. It only helps you to understand market trend, so you take prefect entry. Anyone who guarantees you will make money, is pretty much guaranteeing that you will lose money. Trading and technical analysis is extremely difficult, it takes patience, discipline and most people do not make it. Applying these tools and investing in your trading education can help put the odds in your favor but will only assist the individual in their execution, decision making, thought process and executing their own individual trades, NOT make them for you.
You're always welcome to share any type of suggestion & feedback.
To access this indicator, Interested traders can pm me our use below links.

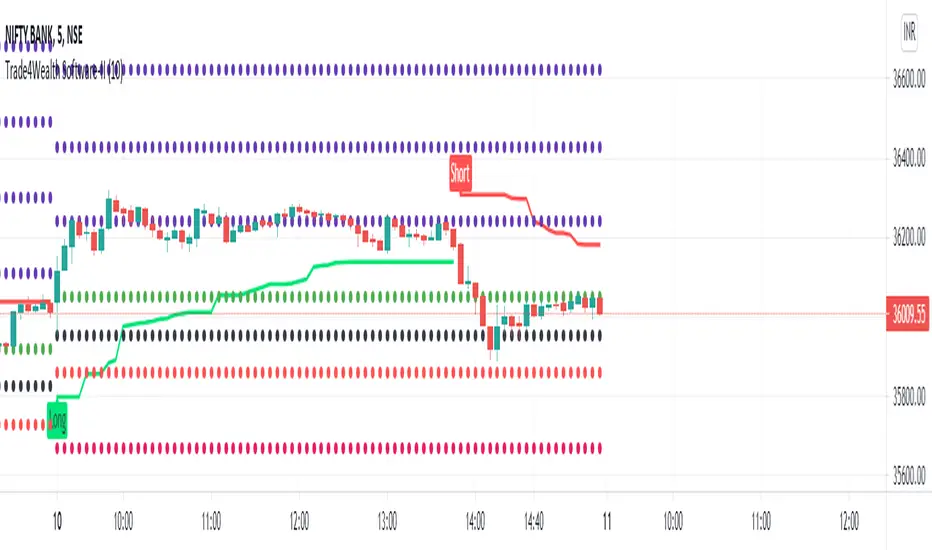
Trade4Wealth Software-IITrade4wealth Software-II
DESCRIPTION:
This Alert indicator utilizes the Heiken Ashi with non-lag EMA was a scalping and intraday trading. There is also included filtering on MACD direction and trend direction as indicated by two MA: SMA (20) and EMA (50). The Heiken Ashi candles are great as price action trending indicator, they shows smooth strong and clear price fluctuations with price.
Financial Markets: NSE/BSE/MCX
> Optimised settings for 3 min, 5 min and 15 min Time Frame.
Indicators used in calculations:
> MACD 2 colour (5,9,3)
> EMA, period 50
> SMA, period 20
> Non lag EMA , period 20
Generate Alerts use the following Trading Rules:
> Heiken Ashi with non-lag dot
> Trade only in direction of the trend.
> UP trend : MA 20 period is above EMA 50 period.
> Down trend : MA 20 period is below EMA 50 period.
How to use:
> Use software with Default Settings.
For Buy :
> If 20 SMA (i.e. Green Line) Crosses 50 EMA (i.e. Red Line) from lower to upper side than Buy.
> Zone & Parabolic Sar both must be Green for Buy.
For Sell :
> If 20 SMA (i.e. Green Line) Crosses 50 EMA (i.e. Red Line) from upper to lower side than Sell.
> Zone & Parabolic Sar both/ must be Red for Sell.
HINTS:
- Good positions occur when MACD crosses the Zero line.
- Large Heikin Ashi candles with small wicks in direction of trend are good strong trends.
How to get access:
Please click on the link in the signature or send me a private message to get access.
MA Crossover IndexJust 3 Moving Averages with adjustable settings, plus signals crossover between price and MA Media.
Types of MAs supported:
SMA, EMA, WMA, VWMA, SMMA, DEMA, TEMA, Hull/MA, ZEMA, TMA, SSMA
The signal is given when the price crosses the MA Average.
The random line only works on indices, it indicates that if the price exceeds it, the continuation of that movement is possible.
Option to place TP and SL recommended only on Indices.

Index SMA vs. CloseVery simple script that index the close price with the SMA 20,50 and 200. It is very useful to plot and see if stocks are extended vs. de SMAs.
pivXmaspivXmas is a combined Moving Average based indicator.
pivXmas adds the following graphic functionalities to your chart:
- Adjustable Pivot-Bands with optional up-down-colored Middle-Line
- 4 Simple Moving Averages and/or 4 Exponential Moving Averages
OR an 8-segment Moving Average Ribbon
The Pivot-Bands are calculated by using time-spreaded averaged Lows and Highs.
The Length of the basic number of periods can be modified.
The brightness of all Pivot-Bands elements can be adjusted with one single control and a choice between
different color schemes is provided for convenience.
The Pivot-Bands Exponentialty can be set from 0 (Simple Moving Average) to 100 (Exponential Moving Average).
Furthermore, the Pivot-Bands Distance, the space between the upper and lower band, can be altered.
Depending on the timeframe, settings and other signals, part of a typical trading strategy could consist of
a long/buy when the price crosses the lower band from below back into the bands-range and a short/sell when
the price crosses the upper band from above back into the bands-range.
Roughly following the Middle Line curve and color also gives a good insight whether something is in an uptrend,
downtrend or in between.
The brightness of all Moving Averages can be adjusted with one single control.
The length and appearance for each Moving Average, 4 SMA's and 4 EMA's, can be modified individually.
The MA-Ribbon can be set to use simple or exponential Moving Averages. The MA-Ribbon uses the SMA/EMA 4 length
as the maximum length and the SMA/EMA 4 length divided by 8 (rounded) as the minimum length.
The MA-Ribbon consists of 8 subsequent Moving Averages. Color filling can be switched on and off.
Books have been written and many articles and videos have been made about the meaning and possible applications
of Moving Averages in trading.
A combination of these functions within pivXmas, together with the simple, yet quite usefull, visual options,
make it to a versatile indicator on every timeframe on any chart.

SIMPLE MOVING AVG 10,20,50,100,200 with RESOLUTIONThis indicator is the best than all other sma indicators.Because in just one click you can change all the resolution /time frames for all the sma .
Multitime frame analysis can be done in just one click. just change the resolution to
15 min/30 min/1hr- if you intraday trader
1D- LONG TERM INVESTORS.
Multi-timeframe analysis (MTF) is a process in which traders can view the same ticker/indicator using a higher time frame than the chart’s, for example, displaying a daily moving average on a one-hour chart in just two clicks.
How to Use this to Buy Stocks ?
The technical indicator known as the Death cross occurs when the 50-day SMA crosses below the 200-day SMA => Bearish Signal.
An opposite indicator, known as the Golden cross, occurs when the 50-day SMA crosses above the 200-day SMA => Bullish Signal.
Crossovers are one of the main moving average strategies.
1st Strategy is the first type is a price crossover, which is when the price crosses above the sma => Buy signal
when the price crosses below the sma => Sell signal
2nd Strategy is to apply two moving averages to a chart: one longer and one shorter.
When the shorter-term MA (100) crosses above the longer-term MA (200), it's a buy signal, indicates trend is shifting up.
This is known as a "Golden cross."
Meanwhile, when the shorter-term MA (100) crosses below the longer-term MA (200), it's a sell signal, indicates trend is shifting down.
This is known as a "Dead/death cross."
The time frame or length you choose for a moving average, also called the "look back period," can play a big role in how effective it is.
An MA with a short time frame will react much quicker to price changes than an MA with a long look back period. In the figure below, the 20-day moving average more closely tracks the actual price than the 100-day moving average does.
A 20-day MA = more beneficial to a shorter-term trader, since it follows the price more closely.
A 100-day MA = more beneficial to a longer-term trader.
Moving averages work quite well in strong trending conditions but poorly in choppy or ranging conditions.
use this indicator along with Price action theory and not alone.
Moving average crossovers are a popular strategy for both entries and exits. MAs can also highlight areas of potential support or resistance
Happy Trading

Median Absolute Deviation Filtered SMA & BBMedian Absolute Deviation (MAD) is a robust measurement of variability and more resilient against outliers and small samples.
This experiment uses MAD as a means of filtering outliers from an SMA calculation. First we construct the equivalent of a Bollinger Band, but based on the median as the basis and a multiple( k ) of MAD as the outlier cutoff.
k can be set a number of ways. As a simple multiple (3 - very conservative / 2.5 - moderately conservative / 2 - poorly conservative). Alternatively MAD can be used as an estimator of standard deviation by using a multiple of 1.4826 (SD1 - 1.4826 / SD2 - 2.9652 / SD3 - 4.4478).
Once we have a cutoff range an SMA is calculated with the outliers filtered out. Additionally a Bollinger band can be output using the filtered SMA as the basis and a multiple of the MAD instead of SD for the bands.

Daily SMAs 10/20/50/100/200This is one of the oldest and simplest trading tools still utilized today, having an ancillary role with long term trading and analyst's commentary in media/news. It's a multicator employing PSv4.0, freely available to ALL, with numerous simple moving averages(SMAs) that use different historical periods of observation in their formulations to portray trading bias. I have revived this tool to my modern expectations of what it could be, embellished with the "Power of Pine".
I provided these moving averages in pastel colors with dotted step-lines as an attempt to not interfere with other "more important indicators" that may exist in your overlay pane. In "Settings" with the "Time Frame" input() set to "Daily", while inspecting much smaller time frames other than daily candles, you may use the sampling quantization tweak to smooth out those step-lines for a different visual appeal. This is exemplified in the lower indicator pane of the chart demonstration above. Also, the brightness control can be quickly and easily fine tuned to your personal preference of visibility that is not distracting. The moving averages are all independently adjustable if you require more responsive calculations with shorter periods of time, or longer...
Features List Includes:
"Daily" or "Chart" time frames
Brightness control
Line thickness adjustment
Sampling quantization tweak
Adjustable periods for the SMAs
The comments section below is solely just for commenting and other remarks, ideas, compliments, etc... regarding only this indicator, not others. When available time provides itself, I will consider your inquiries, thoughts, and concepts presented below in the comments section if you do have any questions or comments regarding this indicator. When my indicators achieve more prevalent use by TV members, I may implement more ideas when they present themselves as worthy additions. As always, "Like" it if you simply just like it with a proper thumbs up, and also return to my scripts list occasionally for additional postings. Have a profitable future everyone!
Percentage Of Rising MA'sReturn the percentage of rising moving averages with periods in a custom range from min to max , with the possibility of using different types of moving averages.
Settings
Minimum MA Length Value : minimum period of the moving average.
Maximum MA Length Value : maximum period of the moving average.
Smooth : determine the period of an EMA using the indicator as input, 1 (no smoothing) by default.
Src : source input for the moving averages.
Type : type of the moving averages to be analyzed, available options are "SMA", "WMA" and "TMA", by default "SMA".
Usages
The indicator can return information about the main direction of a trend as well as its overall strength. A value of the indicator above 50 implies that more than 50% of the moving averages from period min to max are rising, this would suggest an uptrend, while a value inferior to 50 would suggest a down-trend.
On the chart, a ribbon consisting of simple moving averages from period 14 to 19, with a color indicating their direction, below the indicator with min = 14 and max = 19
The strength of a trend can be determined by how close the indicator is to 0 or 100, a value of 100 would imply that 100% percent of the moving averages are rising, this indicates a strong up-trend, while a value of 0 would suggest a strong down-trend.
Using different types of moving averages can allow to have more reactive or on the contrary, less noisy results.
Here the type of moving average used by both the ribbon and the indicator is the WMA, the WMA is more reactive than the SMA at the cost of providing less amount of filtering. On the other hand, using a triangular moving average (TMA) provide more filtering at the cost of being less reactive.
Finally, irregularities in the indicator output can be removed by using the smooth setting.
Above smooth = 50.
Details
The indicator is based upon a for loop, this implies that both the sma, wma or change functions are not directly usable, fortunately for us, it is possible to get the first difference of both the SMA, WMA and TMA without relying on a loop by using simple calculations.
The first difference of an SMA of period p is simply a momentum oscillator of period p divided by p , there are two ways to explain why this is the case, first, simple math can prove this, the first difference of an SMA is given by:
(x + x + ... + x )/p - (x + x + ... + x )/p
The repeating terms cancel each other out, as such, we end up with
(x - x )/p
which is simply a momentum oscillator divided by p , since this division doesn't change the sign of the output we can leave it out. We can also use impulses responses to prove this, the impulse response of a simple moving average is rectangular, taking the first difference of this impulse response will give the impulse response of a momentum oscillator, with the only difference being that the non-zero values of the result will be equal to 1/p instead of 1.
The same thing applies to the WMA
above the impulse response of the first difference of a WMA, we can see it is extremely similar to the one of a high pass SMA, only 1 bar longer, as such we can have the first difference of a WMA quite easily. The TMA is simply a 2 pass SMA (the SMA of an SMA), as such the solution is also simple.
Simple SMA Strategy Backtest Part 4Added Take Profit and Stop Loss logic.
Part 4 :
www.tradingview.com
Part 3:
www.tradingview.com


SMA's AverageReturn the average of simple moving averages with periods starting from min to max that is:
avg(sma(src,min),sma(src,min+1),...,sma(src,max))
The user can choose three types of weightings for the average, "simple", "linear", and "least squares".
Settings
Min : minimum period of the sma
Max : maximum period of the man, must be higher than "Min"
Src : input data of the indicator
Type : type of weighting, available options are "Simple", "Linear" or "Least Squares", by default "Simple"
Usage
The moving average can be used like any other classical moving average. The different types of weightings change the behavior of the moving average, the simple weighting will weight all the moving averages equally, a linear weighting will use the weighting function of a WMA, as such moving averages with lower periods will receive higher weights, this decrease the lag of the moving average. Finally, the least-squares weighting uses the weighting function of a least-squares moving average, this allows to drastically reduce the lag of the moving average.
in red the moving average using simple weighting, in blue linear weighting, and in orange least squares weighting, with all using min = 14 and max = 28.
In red the moving average with min = 50 and max = 200, in blue a LSMA of period 200, notice how the moving average has less overshoots.
Details
Computing the average of various simple moving averages is simple, remember that a simple moving average can be computed using a cumulative sum:
Sma = change(cum(src),length)/length
we can't compute various "sma" functions with changing length argument within a for loop, but we can still differentiate within it, as such the cumulative sum method is super efficient and convenient.
The impulse response of this moving average is rectangular for the first "min" values, then the impulse is tailed, with the weighting method defining the shape of the tail.
in red the simple weighting method, in blue the linear method, and in orange the least-squares method.
Our moving average is an FIR moving average, as such the output lag is a linear characteristic of the moving average, which imply that:
Lag = Avg(lag(Sma(min)),lag(Sma(min+1))...,lag(max))
where lag is the lag of the moving average, in the case of a simple weighting we have:
Lag = Avg((min-1)/2,(min+1-1)/2,...,(max-1)/2) = Avg((min-1)/2,(max-1)/2)
a linear weighting gives a lag of:
Lag = Avg((min-1)/3,(min+1-1)/3,...,(max-1)/3) = Avg((min-1)/3,(max-1)/3)
Summary
A script computing the average of various moving averages has been presented, this MA might not be super useful to the everyday analyst but it stills have some great potential. Thx for reading.
This indicator is dedicated to my sister Lea, happy birthday kokoro
Trend AssessmentThis indicator helps to identify the trend direction and wether the trend is still accelerating or not. The calculation is based on two SMAs and uses the difference between those SMAs.
An accelerating bullish trend is indicated by a green background and green triangles over the candles.
An accelerating bearish trend is indicated by a red background and red triangles over the candles.

Simple SMA Strategy BacktestAdded strategy logic.
Part 3:
www.tradingview.com
Part 2:
www.tradingview.com
Part 1:
Simple SMA Indicator
www.tradingview.com
WARNING:
- For purpose educate only
