Dane - MA StrategyThis strategy has been developed as a development service. It is published for customer acceptance and verification. As such, I am unable to provide access to anyone other than the paying customer. Sorry about that.
For those interested in development services, please check out the backtest-rookies (.com) website.
MA Strategy
A Moving average crossover strategy using Heikin-ashi candles for confirmation. The strategy makes trading decisions based on Heikin-ashi data but trades on real candlestick charts to avoid incorrect backtest results.
The strategy includes optional plotting of HK candles on an overlay to help with strategy verification.
Sma

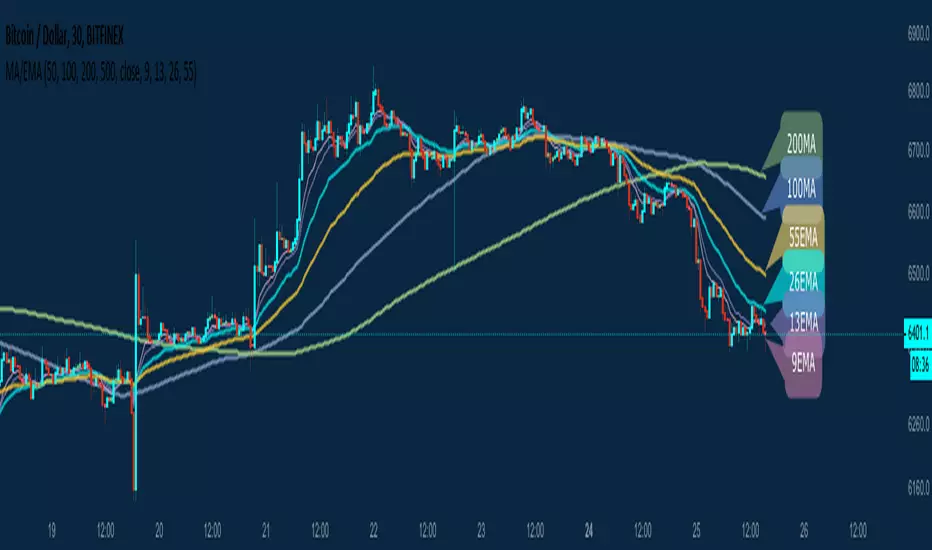
Ruler's Multiple Moving Averages - 8 EMA/MAA handy tool for those who need Multiple Moving Averages in a single indicator!
A great collection of 8 very powerful EMAs and SMAs including:
50MA 9EMA
100MA 13EMA
200MA 26EMA
500MA 55EMA
Of course, completely customizable to your own needs. No need to upgrade your Tradingview account to be able to use multiple MA indicators when you can have all of them in a single Indicator.
All feedback is welcome of course! Enjoy.
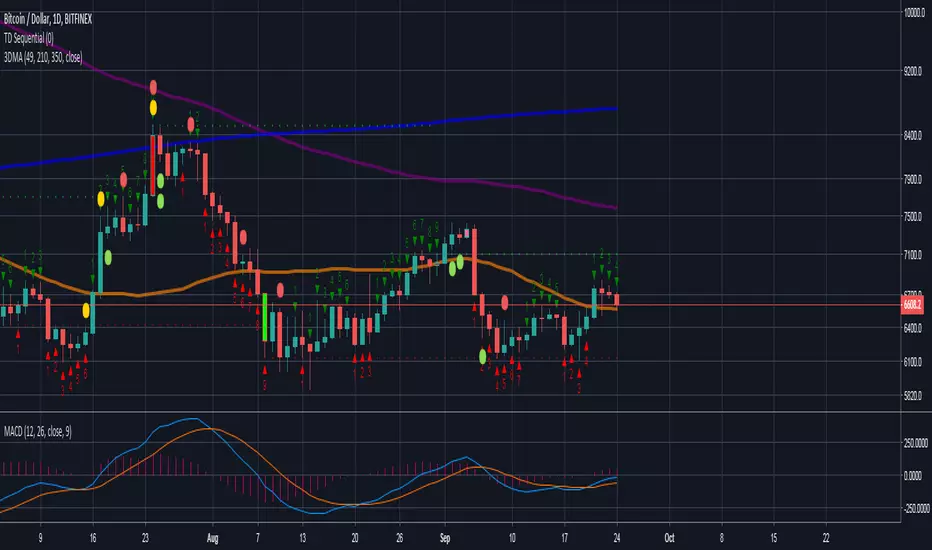
Daily Triple Moving AveragesDisplays triple moving average (SMA calculation method) intended for use daily time frames. Equivalent to 7,30, & 50 on weekly time frame.
Orange = 49
Purple = 210
Blue = 350
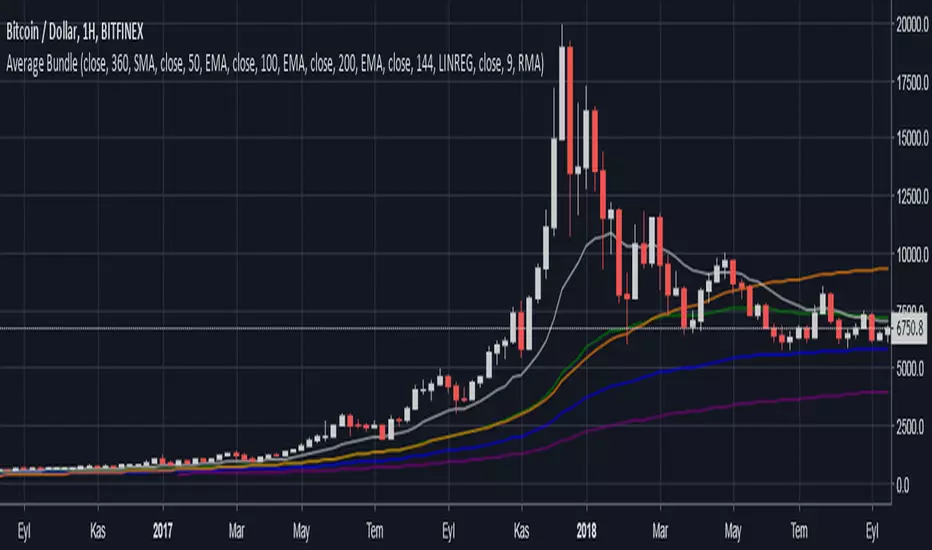
Average BundleSix (6) average indicators in single package.
All averages have adjustable source, length and type individually
Every average can be enabled or disabled individually.
Color, thickness and other style parameters are adjustable on Style section.
Supported types are:
EMA - Exponential Moving Average
SMA - Simple Moving Average
RMA - Running Moving Average
WMA - Weighted Moving Average
LINREG - Linear Regression
Investopedia is a good source to learn about moving average types.

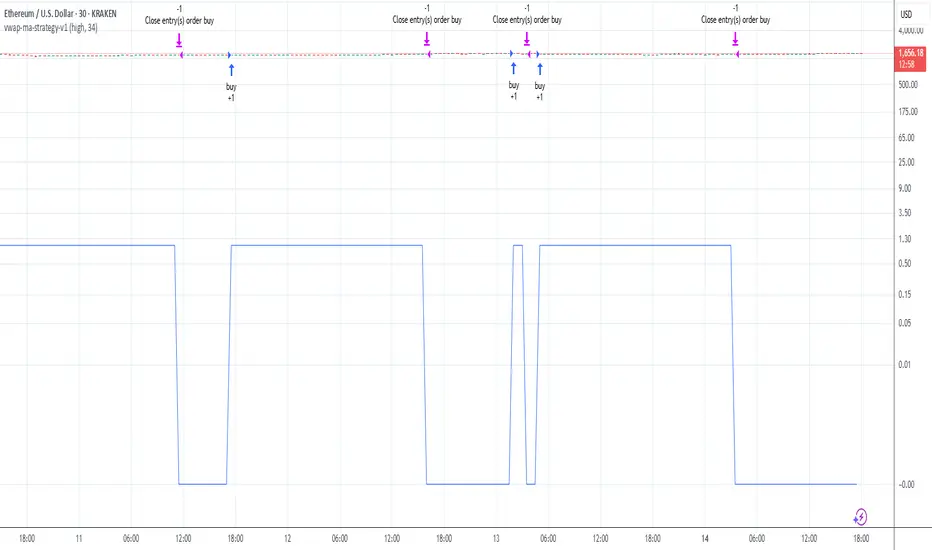
vwap-ma-strategy-v0.7This strategy was inspired by my Israeli fellow iAtiya.
I love it because it's my first pine v3 script that actually works.
Powerful with respect to it's simplicity.
Rainbow Moving AveragesThis script draws a box tower of moving averages. Each box is a unique color from the rainbow, and there are seven moving averages total. By default, 5, 10, 20, 50, 100, 150, 200 day simple moving averages are used. You could configure the numbers as you wish and also choose EMA, WMA, VWMA, or HullMA. If the price closes at or above a moving average, its box is colored otherwise the box will be gray.

Seven Simple Moving AveragesBy default, this script overlays seven simple moving averages (5, 10, 20, 50, 100, 150, 200) and allows you to customize the SMA values as you wish. If a candle closes at or above a moving average, the plot for that SMA is colored green for that candle otherwise it's red.

Octal EMA + SMAThis script gives the most required moving averages in one indicator.
Designed in a better way to make traders experience easier in tradingview.
Gives the traders to find the support and resistance.
Offers better flexibility to the traders to choose their preferred moving averages.
Traders can choose EMA or SMA for every moving average separately.
Hope you like my indicator. Keep trading. Gain profits.
Kindly support me with your likes.

Multi SMA EMA WMA HMA BB (4x3 MAs Bollinger Bands) Pro MTF - RRBMulti SMA EMA WMA HMA 4x3 Moving Averages with Bollinger Bands Pro MTF by RagingRocketBull 2018
Version 1.0
This indicator shows multiple MAs of any type SMA EMA WMA HMA etc with BB and MTF support, can show MAs as dynamically moving levels.
There are 4 MA groups + 1 BB group. You can assign any type/timeframe combo to a group, for example:
- EMAs 50,100,200 x H1, H4, D1, W1 (4 TFs x 3 MAs x 1 type)
- EMAs 8,13,21,55,100,200 x M15, H1 (2 TFs x 6 MAs x 1 type)
- D1 EMAs and SMAs 12,26,50,100,200,400 (1 TF x 6 MAs x 2 types)
- H1 WMAs 7,77,231; H4 HMAs 50,100,200; D1 EMAs 144,169,233; W1 SMAs 50,100,200 (4 TFs x 3 MAs x 4 types)
- +1 extra MA type/timeframe for BB
compile time: 25-30 sec
full redraw time after parameter change in UI: 3 sec
There are several versions: Simple, MTF, Pro MTF, Advanced MTF and Ultimate MTF. This is the Pro MTF version. The Differences are listed below. All versions have BB
- Simple: you have 2 groups of MAs that can be assigned any type (5+5)
- MTF: +2 custom Timeframes for each group (2x5 MTF)
- Pro MTF: +4 custom Timeframes for each group (4x3 MTF), MA levels and show max bars back options
- Advanced MTF: +2 extra MAs/group (4x5 MTF), custom Ticker/Symbol, backreferences for type, TF and MA lengths in UI
- Ultimate MTF: +individual settings for each MA, custom Ticker/Symbols
Features:
- 4x3 = 12 MAs of any type including Hull Moving Average (HMA)
- 4x MTF groups with step line smoothing
- BB +1 extra TF/type for BB MAs
- 12 MA levels with adjustable group offsets, indents and shift
- show max bars back
- you can show/hide both groups of MAs/levels and individual MAs
Notes:
1. based on 3EmaBB, uses plot*, barssince and security functions
2. you can't set certain constants from input due to Pinescript limitations - change the code as needed, recompile and use as a private version
3. Levels = trackprice implementation
4. Show Max Bars Back = show_last implementation
5. uses timeframe textbox instead of input resolution to allow for 120 240 and other custom TFs. Also supports TFs in hours: 2H or H2
6. swma has a fixed length = 4, alma and linreg have additional offset and smoothing params
7. Smoothing is applied by default for visual aesthetics on MTF. To use exact ma mtf values (lines with stair stepping) - disable it
MTF Notes:
- uses simple timeframe textbox instead of input resolution dropdown to allow for 120, 240 and other custom TFs, also supports timeframes in H: 2H, H2
- Groups that are not assigned a Custom TF will use Current Timeframe (0).
- MTF will work for any MA type assigned to the group
- MTF works both ways: you can display a higher TF MA/BB on a lower TF or a lower TF MA/BB on a higher TF.
- MTF MA values are normally aligned at the boundary of their native timeframe. This produces stair stepping when a higher TF MA is viewed on a lower TF.
Therefore X Y Point Density/Smoothing is applied by default on MA MTF for visual aesthetics. Set both to 0 to disable and see exact ma mtf values (lines with stair stepping and original mtf alignment).
- Smoothing is disabled for BB MTF bands because fill doesn't work with smoothed MAs after duplicate values are replaced with na.
- MTF MA Value fluctuation is possible on the current bar due to default security lookahead
Smoothing:
- X,Y == 0 - X,Y smoothing disabled (stair stepping on high TFs)
- X == 0, Y > 0 - X,Y smoothing applied to all TFs
- Y == 0, X > 0 - X smoothing applied to all TFs < deltaX_max_tf, Y smoothing disabled
- X > 0, Y > 0 - Y smoothing applied to all TFs, then X smoothing applied to all TFs < deltaX_max_tf
X Smoothing with Y == 0 - shows only every deltaX-th point starting from the first bar.
X Smoothing with Y > 0 - shows only every deltaX-th point starting from the last shown Y point, essentially filling huge gaps remaining after Y Smoothing with points and preserving the curve's general shape
X Smoothing on high TFs with already scarce points produces weird curve shapes, it works best only on high density lower TFs
Y Smoothing reduces points on all TFs, removes adjacent points with prices within deltaY, while preserving the smaller curve details.
A combination of X,Y produces the most accurate smoothing. Higher delta value - larger range, more points removed.
Show Max Bars Back:
- can't set plot show_last from input -> implemented using a timenow based range check
- you can't delete/modify history once plotted, so essentially it just sets a start point for plotting (from num_bars bars back) that works only in realtime mode (not in replay)
Levels:
You can plot current MA value using plot trackprice=true or by checking Show Price Line in Style. Problem is:
- you can only change color (not the dashed line style, width), have both ma + price line (not just the line), and it's full screen wide
- you can't set plot trackprice from input => implemented using plotshape/plotchar with fixed text labels serving as levels
- there's no other way of creating a dynamic level: hline, plot, offset - nothing else works.
- you can't plot a text var - all text strings must be constants, so you can't change the style, width and text labels without recompiling.
- from input you can only adjust offset, indent and shift for each level group, and change color
- the dot below each level line is the exact MA value. If you want just the line swap plotshape with plotchar, recompile and save as your private version, adjust Y shift.
To speed up redraw times: reduce last_bars to ~2000, recompile and use as your own private version
Pinescript is a rudimentary language (should be called Painscript instead) that can basically only plot data. You can't do much else. Please see the code for tips and hints.
Certain things just can't be done or require shady workarounds and weeks of testing trying to resolve weird node.js compiler errors.
Feel free to learn from/reuse/change the code as needed and use as your own private version. See comments in code. Good Luck!

BandsPlus Triple Moving Average SMAAdds up to 3 SMA on the current timeframe (1D, 1H, etc). A band can be added to each SMA to offset the lines by a specified percentage. This makes it easier to identify targets near the SMA, in addition to the SMA itself.

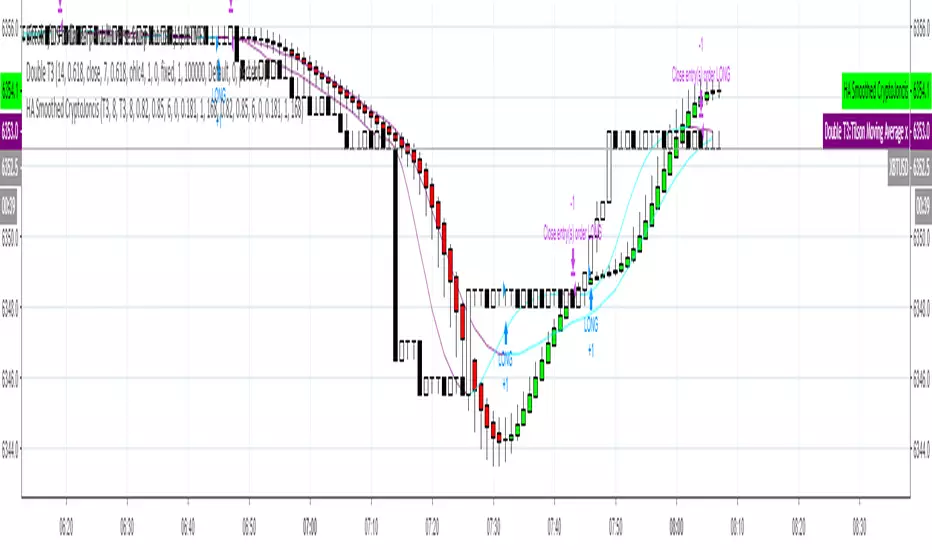
Heikin-Ashi Smoothed with option to change MA types CryptoJoncisPine Script version=3
Author CryptoJoncis
Heikin-Ashi Smoothed
The Heikin-Ashi Smoothed study is based upon the standard Heikin-Ashi study with additional moving average calculations. The following is the calculation formula for the bars:
1. The current bar Open, High, Low, Close values are smoothed individually by using the moving average type specified by the Moving Average Type 1 Input with a length/period specified by the Moving Average Period 1 Input.
2. The Heikin-Ashi bar Open, High, Low, Close values are set using the smoothed values from step 1. This is performed using the standard Heikin-Ashi formula.
3. The final Heikin-Ashi Open, High, Low, Close values are calculated by doing a second smoothing of the bar values from step 2 by using the moving average type specified by the Moving Average Type 2 Input with a length/period specified by the Moving Average Period 2 Input.
If you choose to tick the box where it offers to use only one smoothed HA then it skips the third/final step and you do not need to choose the second MA type for it to work.
Remember, using FRAMA, always make sure you use even number for length.
For simple Heikin-Ashi, please tick single smoothed and DEFAULT (Not smoothed as there are no MA used)
Heikin-Ashi bars are calculated:
1. Close = (Open + High + Low + Close) / 4
This is the average price of the current bar.
2. Open = (Open of Previous Bar + Close of Previous Bar) / 2
This is the midpoint of the previous bar.
3. High = Max of (High, Open, Close)
Highest value of the three.
4. Low = Min of (Low, Open, Close)
Lowest value of the three.
Any questions/suggestions/errors or spelling mistakes? Please leave a comment and let me know. I will try to fix it.
This took me few days to finish, so I hope you will find it useful.
Would you like to have more MA type choices? Please comment down with any other which aren't included in this indicator and I will research them and add.
MA included in this script:
Tillson Moving Average (T3)
Double Exponential Moving Average (DEMA)
Arnaud Legoux Moving Average (ALMA)
Least Squares Moving Average (LSMA)
Simple Moving Average (SMA)
Exponential Moving Average (EMA)
Weighted Moving Average (WMA)
Smoothed Moving Average (SMMA)
Triple Exponential Moving Average (TEMA)
Hull Moving Average (HMA)
Adaptive moving average (AMA)
Fractal Adaptive Moving Average (FAMA)
Variable Index Dynamic Average (VIDYA)
Triangular Moving Average (TRIMA)
You can use,publish,modify this code in any way as you wish, but only if you reference me after.
You are not allowed to sell it as it is.
If this code is useful to you, then consider to buy me a coffee (or better a pint of beer) by donating Bitcoin or Etherium to:
BTC: 3FiBnveHo3YW6DSiPEmoCFCyCnsrWS3JBR
ETH: 0xac290B4A721f5ef75b0971F1102e01E1942A4578
References:
www.sierrachart.com
www.investopedia.com
www.binarytribune.com
www.investopedia.com
www.stockfetcher.com
www.mql5.com
www.incrediblecharts.com
help.cqg.com
www.blastchart.com
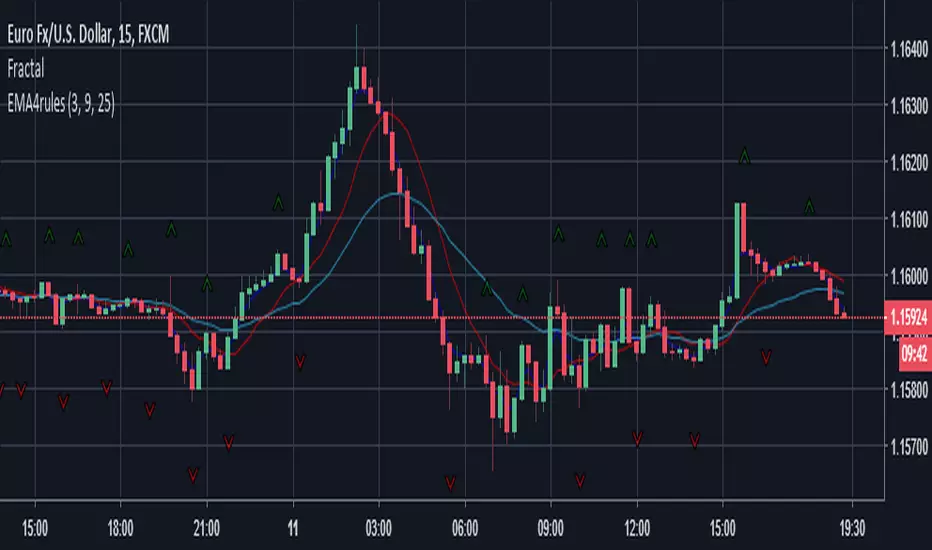
Emas 4 RulesThis script is one of those that complements the strategy of the 4 rules of Daven Icao, summarizes the MA 9, the EMA 3 and the EMA 25. It is used as confirmation of purchase or sale the crossing of the EMA3 with the MA 9 and the EMA 25 in some cases as take profit since the fractal is also used for the same and for the stop loss. The values can be changed but keep in mind that where the MA 9 will always be an SMA and not an EMA.
DYNAMIC SUP/RESDynamic Support / Resistance Indicator.
Dynamic volume based support/resistance levels.
Plots also4 EMA and 2 SMA.
Best used for scalping ranging price but can also help find trade entries for trending market.
White area represents current range. Red lines are Stop Loss levels based on range and Risk to Reward ratio which you can change in settings.
Trade Safe and DYOR!


8-10 MAs Net chart ema/smatihs script can select SMA/EMA's Moving Average Net chart , anyone you want.
Basically this net chart supply 8 MAs and also you can use additionally 2 more Moving Averages.

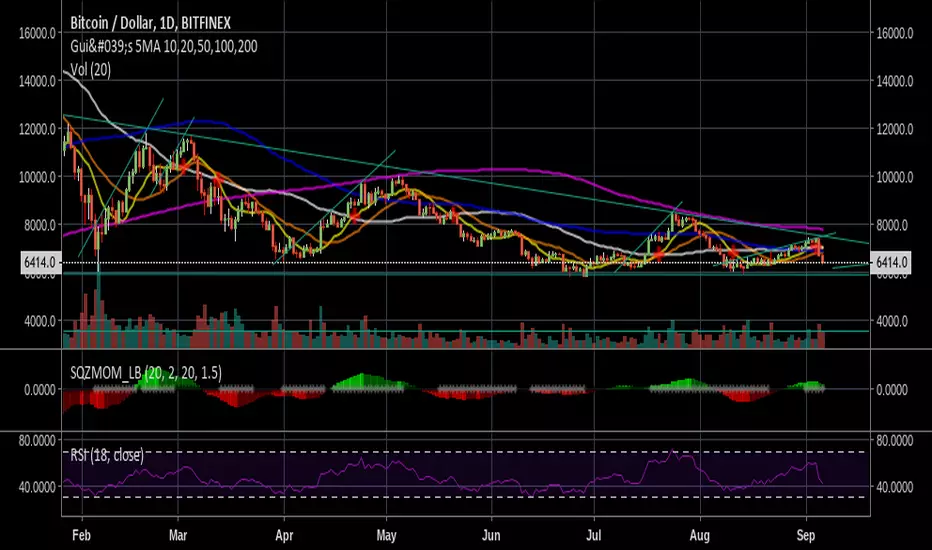
Gui's 5MA 10,20,50,100,2005 Simple Moving Averages for the 10, 20, 50, 100 and 200 day and a cross for whatever you want to read:P
Use it well! Buy high and sell low. Jk:P
Thank you!

Multi SMA EMA WMA HMA BB (5+5 MAs + Bollinger Bands) MTF by RRBMulti SMA EMA WMA HMA BB (5+5 Moving Averages of Any Type with Bollinger Bands) MTF by RagingRocketBull 2018
Version 1.0
This indicator shows multiple MAs of any type (SMA EMA WMA HMA etc) with BB and MTF support
There are several versions: Simple, MTF, Pro MTF and Ultimate MTF. This is the MTF version. The Differences are listed below. All versions have BB
- Simple: you have 2 groups of MAs that can be assigned any type (5+5)
- MTF: +assign 1 custom Timeframe to any group combo (5+5 Custom TF)
- Pro MTF: +multiple Timeframes for multiple MA groups (4*3 MTF), horizontal levels and show max bars back options
- Ultimate MTF: +individual settings for each MA, multiple Timeframes
There are 2 groups of MAs, 3rd group is BB. You can:
- show/hide all MAs in a group. Use length 0 to hide a particular MA independently or uncheck in Style.
- apply any MA type to all MAs in a particular MA group. For example, you can assign all EMAs the HMA type. Groups are called EMAs and SMAs just for reference.
- assign Custom Timeframe to a particular MA/BB group combination or all groups. For example, show daily (D) EMAs+SMAs on H1 Timeframe, or only H4 (240) BB on H1.
You can use different types of MAs as dynamic S/R levels to trade of off and MA crosses as signals for possible trend change (golden/death bull/bear crosses).
Current Timeframe MAs can be used together with Custom Timeframe MAs on a single chart. Higher TF MAs are more important than lower TF MAs.
Most common MA types are: SMA, EMA, WMA, HMA.
Most common MA lengths are: 12, 20, 26, 30, 50, 100, 200, 400 etc.
MTF Notes:
- Script UI uses simple timeframe textbox instead of input resolution dropdown to allow for 240 120 and other custom TFs
- Groups that are not assigned a Custom TF will use Current Timeframe (0).
- MTF will work for any MA type assigned to the group. BB group always uses SMA type.
- MTF works both ways: you can display a higher TF MA/BB on a lower TF or a lower TF MA/BB on a higher TF.
- MTF MA values are normally aligned at the boundary of their native timeframe. This produces stair stepping when a higher TF MA is viewed on a lower TF.
Therefore Point Density/Smoothing is applied by default on MA MTF for visual aesthetics. Set to 0 to disable and see exact ma mtf values (lines with stair stepping and original mtf alignment).
- Smoothing is disabled for BB MTF because fill doesn't work with smoothed MAs after duplicate values are replaced with na.
- MTF MA Value fluctuation is possible on the current bar due to default security lookahead
Features:
- 2 groups of custom 5+5 MAs of any type including Hull Moving Average (HMA)
- BB
- 1x Custom Timeframe with step line smoothing for 3 groups (MAs + BB)
1. based on 3EmaBB, uses plot, fill, security, change, barstate, stdev and custom hma functions
2. you can't set certain constants from input due to Pinescript limitations - change the code as needed, recompile and use as a private script version
3. you can't have plot* inside ?/if/for/function, and implementing condition forks using 2 sets of plots (na vs non-na) doubles indicator params and styles - confusing
4. swma has a fixed length = 4, alma and linreg have additional offset and smoothing params
Feel free to use. Good Luck!
