Hourly Volatility Bands (StdDev)real mathematical stdv based on research conducted by me. if you find that anything is wrong feel free to reach out to me and correct me.
標準差(StdDev)

Session Ranges Pro+Session Range Zones – Professional Edition
OVERVIEW
Professional visualization of the classic opening-range / Initial Balance concept across Asian, London, and Regular (US) sessions.
Displays the high/low of the user-defined opening window as thick, hierarchical filled zones with optional Fibonacci and standard-deviation extensions plus full alerting.
CONCEPT BACKGROUND
Using the high and low of the first 30–60 minutes of a session as key support/resistance is public-domain knowledge that has been standard in institutional trading for decades (Initial Balance, Opening Range, Session Range, etc.).
On TradingView the same principle was popularized under the name “Defining / DealingRange / DR/IDR” by TheMas7er and others.
IMPLEMENTATION & VALUE ADDED
This indicator follows the established, public-domain range-calculation methodology but has been completely rewritten with the following original enhancements:
• Clean, filled High / Mid / Low zones for instant visual hierarchy
• Intuitive Asian / London / Regular session labelling and fully custom timing
• Comprehensive dynamic & static Fibonacci and 50%/100% standard-deviation extensions
• Alert conditions on every zone, midline, opening level, and extension line
• Modern, modular code architecture using arrays and custom drawing functions
• No repainting, lightweight performance on any intraday timeframe
HOW TO USE
Apply to 1–15 min charts. Select desired sessions and formation period (30 or 60 min typical).
Shaded zones serve as primary support/resistance; extensions provide measured-move targets.
CREDIT & TRANSPARENCY
Core methodology: public domain (Initial Balance / Opening Range / Session Range).
Early TradingView popularization of the DR/IDR naming and feature set: TheMas7er **(with thanks to community contributors like bmsitiaan and trading-guide for refinements)**.
**Utilizes PineCoders' VisibleChart library for optimized chart rendering.**
This script uses the same foundational principle and logical input options but is an independent implementation. All visual presentation, zone system, multi-session handling, extension systems, alerting framework, and underlying code structure are original.
DISCLAIMER
For educational and informational purposes only. Not financial advice. Past performance is no guarantee of future results. Test thoroughly on your instruments and timeframes.

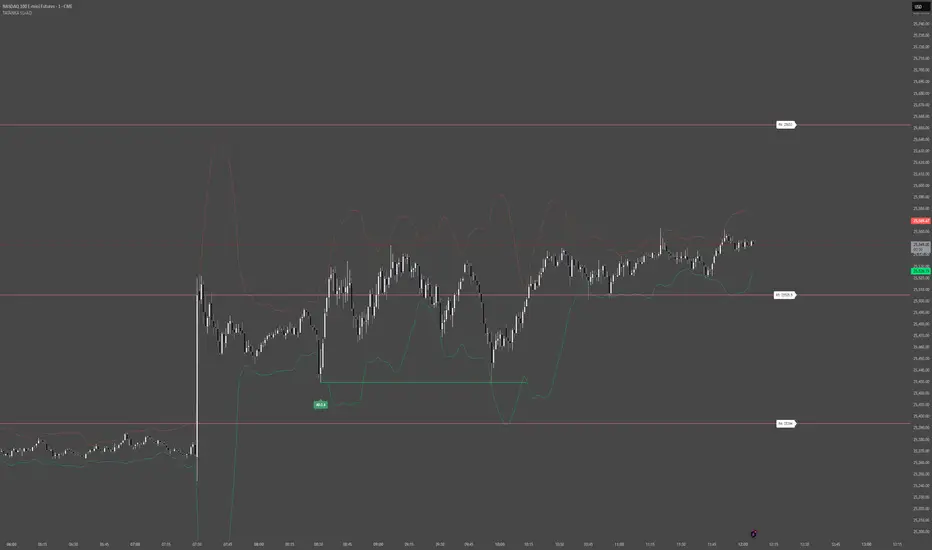
PonoTrading WDRWeekly Dealing Range Indicator
Overview
The Weekly Dealing Range indicator identifies range + volatility based pivot levels that form at the close of the first trading session and extend for the entire week. This tool provides key reference points for both trending and range-bound market conditions.
What It Provides
Range High & Low: Weekly session extremes
Median Level: Mid-point of the weekly range
Weekly Open: First session opening price
Standard Deviation Extensions: Calculated levels above the high and below the low
Practical Application
These levels serve as:
Reversal zones for mean reversion setups
Support/resistance reference points
Target levels for existing positions
Framework for building trade ideas around high-probability pivot areas
Key Features
Traditional price crosses level alerts
Automatically updates each week
Clean, uncluttered chart display
Works across all timeframes
Suitable for all markets and instruments

LGZ – Liquidity Gravity Zones v1 📌 LGZ – Liquidity Gravity Zones (SVI + Net CVD + Volume)
Original Liquidity-Driven Price Magnet Model by Thomas Aaroon
📘 Concept Overview
LGZ (Liquidity Gravity Zones) is a new, original liquidity-based price-attraction model built using three core components:
SVI (Shock Volume Index) – measures abnormal volume spikes at each strike
Net CVD (NCP = CE_CVD − PE_CVD) – the real directional order-flow imbalance
Total Volume (CE + PE) – true liquidity density at each strike
Using these three elements, the indicator calculates Liquidity Gravity Weight (LGW) for every strike and identifies the strongest zones that attract price during the session.
🧠 Why This Indicator?
Traditional OI-based methods (long build-up, short build-up, OI change etc.) often lag.
LGZ focuses only on:
Real traded volume
Actual buy/sell aggression (CVD)
Shock events
Dealer hedging pressure
Strike-level liquidity clusters
This makes it far more responsive for intraday traders.
⭐ Core Formula
Liquidity Gravity Weight (LGW)
LGW = |SVI| × |Net CVD| × Total Volume
Where:
SVI = Shock Volume Index (Z-score based)
Net CVD (NCP) = CE_CVD − PE_CVD
Total Volume = CE_volume + PE_volume
LGW indicates how strongly a strike is pulling price toward it.
🎯 What the Indicator Shows
✔ Top Liquidity Gravity Zones (LGZ-1, LGZ-2, LGZ-3)
These are the strongest price magnets for the day.
✔ Gravity Lines on Chart
Each LGZ is plotted as a horizontal magnet line extending to the right.
✔ Strike-Level Liquidity Table
Shows:
Strike
SVI (Shock intensity)
LGW (Gravity strength)
This table gives a complete picture of the intraday liquidity landscape.
📈 How to Use (Intraday Trading Strategy)
🔵 1. Price gravitates toward LGZ-1
If price is below LGZ-1 → upward pull
If price is above LGZ-1 → downward pull
🔵 2. LGZ Flips = Trend Change
If LGZ-1 suddenly jumps to a different strike:
→ strong trend acceleration
🔵 3. LGZ Cluster = Reversal / Consolidation Zone
Multiple LGZ levels around the same strike indicate
→ liquidity saturation → reversal or slowdown.
🔵 4. Combine with Price Action
Best clarity on 5-minute timeframe
Use 1-minute only for entry.
🔬 Why LGZ Works
The indicator models the same reality driving option markets:
Where option volume + orderflow (CVD) + shock liquidity concentrate,
market makers hedge, and price moves toward that strike.
This is the foundation of dealer hedging mechanics and liquidity-based price movement.
🔧 Inputs
Symbol prefix (e.g., NIFTY)
Expiry (YYMMDD)
Center strike & range
Number of gravity zones
Color customization

TVB - Thomas Volatility Bands v2.0TVB – Thomas Volatility Bands v2.0
Author: Thomas Aaroon
Concept: CIV-Driven Volatility Bands with Adaptive Vomma Scaling
Overview
TVB – Thomas Volatility Bands v2.0 is an advanced volatility-adaptive band system built on two core elements:
CIV (Composite Implied Volatility) – manually provided or proxied using an external IV index
Dynamic Vomma Scaling – a higher-order volatility response factor that adjusts band width based on the convexity of implied volatility changes
Together, these components create a continuously adapting volatility envelope that reacts smoothly to market regime shifts.
Key Features
1. Flexible CIV Input
Manual CIV mode: Enter your own CIV value (decimal or %)
Proxy CIV mode: Pulls IV data from INDIA_VIX or any custom IV symbol
Weighted blending: Adjustable α-weight for proxy influence
Automatic normalization ensures stable and bounded CIV values.
2. Adaptive Volatility Engine
CIV is smoothed using EMA for intraday and SMA for higher-timeframes
Vomma coefficient dynamically adjusts based on CIV percentile and short-term CIV volatility
Produces a volatility surface that expands during stress and contracts during calm periods.
3. Time-Scaled Band Construction
Bands automatically scale their width according to:
Timeframe multiplier
Estimated bars-per-day
Annualized volatility normalization (√252 rule)
This ensures consistent volatility geometry across all chart timeframes.
4. Dual-Layer Volatility Bands
Inner Bands (±3σ): Tactical mean-reversion boundaries
Outer Bands (±4σ): Structural deviation zones for extreme price dislocations
Smooth color-coded volatility regimes (low/moderate/high CIV).
5. Re-Entry Logic (34% Rule)
A clean, rule-based mechanism inspired by distributional penetration depth:
Tracks bars that break the ±4σ outer band
Looks for 34% penetration back toward the ±3σ region
Generates optional visual markers (buy/sell re-entry)
Designed to highlight volatility compression opportunities after extreme expansions.
6. Optional CIV Diagnostic Label
Shows:
CIV and smooth CIV
Vomma coefficient
Effective band width
Useful for strategy development and volatility research.
Intended Use
TVB v2.0 is designed for:
Volatility-based trading models
Mean-reversion and re-entry systems
Volatility regime identification
Institutional-grade market structure research
This indicator does not repaint and does not generate trade signals by default (signals can be enabled via optional shapes).
Disclaimer
This tool is for educational and analytical purposes only.
It is not financial advice, and the author is not responsible for any trading outcomes.

Order-Flow Proxy (VWAP Deviation Zones)Order-Flow Proxy (VWAP Deviation Zones) helps traders visualize when market price moves unusually far away from its Volume-Weighted Average Price (VWAP) — a key fair-value level used by institutional participants.
When price stretches too far above or below VWAP, it often signals temporary imbalance between buying and selling pressure.
This tool highlights those moments using simple color zones and an optional statistical Z-Score filter for deeper precision.
In short: it’s a clean, minimal mean-reversion indicator showing when price is statistically “too far” from fair value.
Red zone → Price extended above VWAP → possible buyer exhaustion or short setup.
Green zone → Price extended below VWAP → possible seller exhaustion or long setup.
VWAP line → Acts as a dynamic fair-value anchor.
Concept:
VWAP combines both price and traded volume to define where most transactions occurred.
Deviations from it — measured either by a fixed distance (1%) or by Z-Score — can reveal overvaluation or undervaluation zones used by professional traders for contrarian setups.
How to use:
Apply the indicator to any intraday chart (1m–1h recommended).
Watch for background color shifts — red or green.
Optionally enable the Z-Score filter to focus only on statistically extreme deviations.
Combine with volume spikes, liquidity sweeps, or your own order-flow tools for confirmation.
Tip:
Best used as a visual overlay for detecting stretched markets and potential reversals.

VWAP Reversion (Sequential Stats + Profit/Loss Points)First time posting. This is my attempt to evaluate the effectiveness of VWAP reversion. I decided to make this an indicator with its own integrated stats.
If you set the session length to lets say 100, but choose a 1 minute timeframe, it will only load as many sessions as the chart will allow for that timeframe. increasing the timeframe will allow you to go back further with more sessions.
I plan to implement more and more as I refine it. I just wanted to get my working copy out into the universe. I'd like to add some method of "scaling in". Perhaps if the price goes further and further away from the original entry, say for each additional std. deviation band further, it could add another entry signal.
My trading journey is just beginning, I've never coded before, and this was made entirely through the fusion of my attempt to communicate the ideas in my head for ChatGPT to turn into code!


Volume Weighted Volatility RegimeThe Volume-Weighted Volatility Regime (VWVR) is a market analysis tool that dissects total volatility to classify the current market 'character' or 'regime'. Using a Linear Regression model, it decomposes volatility into Trend, Residual (mean-reversion), and Within-Bar (noise) components.
Key Features:
Seven-Stage Regime Classification: The indicator's primary output is a regime value from -3 to +3, identifying the market state:
+3 (Strong Bull Trend): High directional, upward volatility.
+2 (Choppy Bull): Moderate upward trend with noise.
+1 (Quiet Bull): Low volatility, slight upward drift.
0 (Neutral): No clear directional bias.
-1 (Quiet Bear): Low volatility, slight downward drift.
-2 (Choppy Bear): Moderate downward trend with noise.
-3 (Strong Bear Trend): High directional, downward volatility.
Advanced Volatility Decomposition: The regime is derived from a three-component volatility model that separates price action into Trend (momentum), Residual (mean-reversion), and Within-Bar (noise) variance. The classification is determined by comparing the 'Trend' ratio against the user-defined 'Trend Threshold' and 'Quiet Threshold'.
Dual-Level Analysis: The indicator analyzes market character on two levels simultaneously:
Inter-Bar Regime (Background Color): Based on the main StdDev Length, showing the overall market character.
Intra-Bar Regime (Column Color): Based on a high-resolution analysis within each single bar ('Intra-Bar Timeframe'), showing the micro-structural character.
Calculation Options:
Statistical Model: The 'Estimate Bar Statistics' option (enabled by default) uses a statistical model ('Estimator') to perform the decomposition. (Assumption: In this mode, the Source input is ignored, and an estimated mean for each bar is used instead).
Normalization: An optional 'Normalize Volatility' setting calculates an Exponential Regression Curve (log-space).
Volume Weighting: An option (Volume weighted) applies volume weighting to all volatility calculations.
Multi-Timeframe (MTF) Capability: The entire dual-level analysis can be run on a higher timeframe (using the Timeframe input), with standard options to handle gaps (Fill Gaps) and prevent repainting (Wait for...).
Integrated Alerts: Includes 22 comprehensive alerts that trigger whenever the 'Inter-Bar Regime' or the 'Intra-Bar Regime' crosses one of the key thresholds (e.g., 'Regime crosses above Neutral Line'), or when the 'Intra-Bar Dominance' crosses the 50% mark.
Caution: Real-Time Data Behavior (Intra-Bar Repainting) This indicator uses high-resolution intra-bar data. As a result, the values on the current, unclosed bar (the real-time bar) will update dynamically as new intra-bar data arrives. This behavior is normal and necessary for this type of analysis. Signals should only be considered final after the main chart bar has closed.
DISCLAIMER
For Informational/Educational Use Only: This indicator is provided for informational and educational purposes only. It does not constitute financial, investment, or trading advice, nor is it a recommendation to buy or sell any asset.
Use at Your Own Risk: All trading decisions you make based on the information or signals generated by this indicator are made solely at your own risk.
No Guarantee of Performance: Past performance is not an indicator of future results. The author makes no guarantee regarding the accuracy of the signals or future profitability.
No Liability: The author shall not be held liable for any financial losses or damages incurred directly or indirectly from the use of this indicator.
Signals Are Not Recommendations: The alerts and visual signals (e.g., crossovers) generated by this tool are not direct recommendations to buy or sell. They are technical observations for your own analysis and consideration.

Volume Weighted Intra Bar LR Standard DeviationThis indicator analyzes market character by providing a detailed view of volatility. It applies a Linear Regression model to intra-bar price action, dissecting the total volatility of each bar into three distinct components.
Key Features:
Three-Component Volatility Decomposition: By analyzing a lower timeframe ('Intra-Bar Timeframe'), the indicator separates each bar's volatility into:
Trend Volatility (Green/Red): Volatility explained by the intra-bar linear regression slope (Momentum).
Residual Volatility (Yellow): Volatility from price oscillating around the intra-bar trendline (Mean-Reversion).
Within-Bar Volatility (Blue): Volatility derived from the range of each intra-bar candle (Noise/Choppiness).
Layered Column Visualization: The indicator plots these components as a layered column chart. The size of each colored layer visually represents the dominance of each volatility character.
Dual Display Modes: The indicator offers two modes to visualize this decomposition:
Absolute Mode: Displays the total standard deviation as the column height, showing the absolute magnitude of volatility and the contribution of each component.
Normalized Mode: Displays the components as a 100% stacked column chart (scaled from 0 to 1), focusing purely on the percentage ratio of Trend, Residual, and Noise.
Calculation Options:
Statistical Model: The 'Estimate Bar Statistics' option (enabled by default) uses a statistical model ('Estimator') to perform the decomposition. (Assumption: In this mode, the Source input is ignored, and an estimated mean for each bar is used instead).
Normalization: An optional 'Normalize Volatility' setting calculates an Exponential Regression Curve (log-space).
Volume Weighting: An option (Volume weighted) applies volume weighting to all intra-bar calculations.
Multi-Component Pivot Detection: Includes a pivot detector that identifies significant turning points (highs and lows) in both the Total Volatility and the Trend Volatility Ratio. (Note: These pivots are only plotted when 'Plot Mode' is set to 'Absolute').
Note on Confirmation (Lag): Pivot signals are confirmed using a lookback method. A pivot is only plotted after the Pivot Right Bars input has passed, which introduces an inherent lag.
Multi-Timeframe (MTF) Capability:
MTF Analysis: The entire intra-bar analysis can be run on a higher timeframe (using the Timeframe input), with standard options to handle gaps (Fill Gaps) and prevent repainting (Wait for...).
Limitation: The Pivot detection (Calculate Pivots) is disabled if a Higher Timeframe (HTF) is selected.
Integrated Alerts: Includes 9 comprehensive alerts for:
Volatility character changes (e.g., 'Character Change from Noise to Trend').
Dominant character emerging (e.g., 'Bullish Trend Character Emerging').
Total Volatility pivot (High/Low) detection.
Trend Volatility pivot (High/Low) detection.
Caution! Real-Time Data Behavior (Intra-Bar Repainting) This indicator uses high-resolution intra-bar data. As a result, the values on the current, unclosed bar (the real-time bar) will update dynamically as new intra-bar data arrives. This behavior is normal and necessary for this type of analysis. Signals should only be considered final after the main chart bar has closed.
DISCLAIMER
For Informational/Educational Use Only: This indicator is provided for informational and educational purposes only. It does not constitute financial, investment, or trading advice, nor is it a recommendation to buy or sell any asset.
Use at Your Own Risk: All trading decisions you make based on the information or signals generated by this indicator are made solely at your own risk.
No Guarantee of Performance: Past performance is not an indicator of future results. The author makes no guarantee regarding the accuracy of the signals or future profitability.
No Liability: The author shall not be held liable for any financial losses or damages incurred directly or indirectly from the use of this indicator.
Signals Are Not Recommendations: The alerts and visual signals (e.g., crossovers) generated by this tool are not direct recommendations to buy or sell. They are technical observations for your own analysis and consideration.

Volume Weighted Intra Bar Standard DeviationThis indicator provides a high-resolution analysis of market volatility by dissecting each bar on the chart into its fundamental components. It uses data from a lower, intra-bar timeframe to separate the total volatility of a single bar into its 'directional' and 'non-directional' parts.
Key Features:
Intra-Bar Volatility Decomposition: For each bar on the chart, the indicator analyzes the underlying price action on a smaller timeframe ('Intra-Bar Timeframe') and quantifies two types of volatility:
Between-Bar Volatility (Directional): Calculated from price movements between the intra-bar candles. This component represents the directional, trending price action within the main bar.
Within-Bar Volatility (Non-Directional): Calculated from price fluctuations inside each intra-bar candle. This component represents the choppy, noisy, or ranging price action.
Dual Display Modes: The indicator offers two modes to visualize this information:
Absolute Mode: Plots the total standard deviation as a stacked column chart, showing the absolute magnitude of volatility and the contribution of each component.
Normalized Mode: Plots the components as a 100% stacked column chart (scaled from 0 to 1), focusing purely on the percentage ratio of 'between-bar' (trending) and 'within-bar' (choppy) volatility.
Calculation Options:
Statistical Model: The 'Estimate Bar Statistics' option (enabled by default) uses a statistical model ('Estimator') to perform the decomposition. (Assumption: In this mode, the Source input is ignored, and an estimated mean for each bar is used instead).
Normalization: An optional 'Normalize Volatility' setting calculates volatility in percentage terms (log-space).
Volume Weighting: An option (Volume weighted) applies volume weighting to all intra-bar volatility calculations.
Volatility Pivot Detection: Includes a built-in pivot detector that identifies significant turning points (highs and lows) in the total volatility line. (Note: This is only visible in 'Absolute Mode').
Note on Confirmation (Lag): Pivot signals are confirmed using a lookback method. A pivot is only plotted after the Pivot Right Bars input has passed, which introduces an inherent lag.
Multi-Timeframe (MTF) Capability:
MTF Analysis Lines: The entire intra-bar analysis can be run on a higher timeframe (using the Timeframe input), with standard options to handle gaps (Fill Gaps) and prevent repainting (Wait for...).
Limitation: The Pivot detection (Calculate Pivots) is disabled if a Higher Timeframe (HTF) is selected.
Integrated Alerts: Includes 6 alerts for:
Volatility character changes (e.g., 'Character Change from Choppy to Trend').
Dominant character emerging (e.g., 'Trend Character Emerging').
Total Volatility pivot (High/Low) detection.
Caution: Real-Time Data Behavior (Intra-Bar Repainting) This indicator uses high-resolution intra-bar data. As a result, the values on the current, unclosed bar (the real-time bar) will update dynamically as new intra-bar data arrives. This behavior is normal and necessary for this type of analysis. Signals should only be considered final after the main chart bar has closed.
DISCLAIMER
For Informational/Educational Use Only: This indicator is provided for informational and educational purposes only. It does not constitute financial, investment, or trading advice, nor is it a recommendation to buy or sell any asset.
Use at Your Own Risk: All trading decisions you make based on the information or signals generated by this indicator are made solely at your own risk.
No Guarantee of Performance: Past performance is not an indicator of future results. The author makes no guarantee regarding the accuracy of the signals or future profitability.
No Liability: The author shall not be held liable for any financial losses or damages incurred directly or indirectly from the use of this indicator.
Signals Are Not Recommendations: The alerts and visual signals (e.g., crossovers) generated by this tool are not direct recommendations to buy or sell. They are technical observations for your own analysis and consideration.

Volume Weighted LR Standard DeviationThis indicator analyzes market character by decomposing total volatility into three distinct, interpretable components based on a Linear Regression model.
Key Features:
Three-Component Volatility Decomposition: The indicator separates volatility based on the 'Estimate Bar Statistics' option.
Standard Mode (Estimate Bar Statistics = OFF): Calculates volatility based on the selected Source (dies führt hauptsächlich zu 'Trend'- und 'Residual'-Volatilität).
Decomposition Mode (Estimate Bar Statistics = ON): The indicator uses a statistical model ('Estimator') to calculate within-bar volatility. (Assumption: In this mode, the Source input is ignored, and an estimated mean for each bar is used instead). This separates volatility into:
Trend Volatility (Green/Red): Volatility explained by the regression's slope (Momentum).
Residual Volatility (Yellow): Volatility from price oscillating around the regression line (Mean-Reversion).
Within-Bar Volatility (Blue): Volatility from the high-low range of each bar (Noise/Choppiness).
Dual Display Modes: The indicator offers two modes to visualize this decomposition:
Absolute Mode: Displays the total standard deviation as a stacked area chart, partitioned by the variance ratio of the three components.
Normalized Mode: Displays the direct variance ratio (proportion) of each component relative to the total (0-1), ideal for identifying the dominant market character.
Calculation Options:
Normalization: An optional 'Normalize Volatility' setting calculates an Exponential Regression Curve (log-space), making the analysis suitable for growth assets.
Volume Weighting: An option (Volume weighted) applies volume weighting to all regression and volatility calculations.
Multi-Component Pivot Detection: Includes a pivot detector that identifies significant turning points (highs and lows) in both the Total Volatility and the Trend Volatility Ratio. (Note: These pivots are only plotted when 'Plot Mode' is set to 'Absolute').
Note on Confirmation (Lag): Pivot signals are confirmed using a lookback method. A pivot is only plotted after the Pivot Right Bars input has passed, which introduces an inherent lag.
Multi-Timeframe (MTF) Capability:
MTF Volatility Lines: The volatility lines can be calculated on a higher timeframe, with standard options to handle gaps (Fill Gaps) and prevent repainting (Wait for...).
Limitation: The Pivot detection (Calculate Pivots) is disabled if a Higher Timeframe (HTF) is selected.
Integrated Alerts: Includes 9 comprehensive alerts for:
Volatility character changes (e.g., 'Character Change from Noise to Trend').
Dominant character emerging (e.g., 'Bullish Trend Character Emerging').
Total Volatility pivot (High/Low) detection.
Trend Volatility pivot (High/Low) detection.
DISCLAIMER
For Informational/Educational Use Only: This indicator is provided for informational and educational purposes only. It does not constitute financial, investment, or trading advice, nor is it a recommendation to buy or sell any asset.
Use at Your Own Risk: All trading decisions you make based on the information or signals generated by this indicator are made solely at your own risk.
No Guarantee of Performance: Past performance is not an indicator of future results. The author makes no guarantee regarding the accuracy of the signals or future profitability.
No Liability: The author shall not be held liable for any financial losses or damages incurred directly or indirectly from the use of this indicator.
Signals Are Not Recommendations: The alerts and visual signals (e.g., crossovers) generated by this tool are not direct recommendations to buy or sell. They are technical observations for your own analysis and consideration.

Volume Weighted Standard DeviationThis indicator calculates the Standard Deviation and decomposes total volatility into its core components, allowing to analyze the underlying character of the market.
Key Features:
Volatility Decomposition: The indicator separates volatility based on the 'Estimate Bar Statistics' option.
Standard Mode (Estimate Bar Statistics = OFF): Calculates a simple (Volume-Weighted) Standard Deviation of the selected Source.
Decomposition Mode (Estimate Bar Statistics = ON): The indicator uses a statistical model ('Estimator') to calculate within-bar volatility (choppiness, noise) and between-bar volatility (trending moves). (Assumption: In this mode, the Source input is ignored, and an estimated mean for each bar is used instead).
Dual Display Modes: The indicator offers two modes to visualize this information:
Absolute Mode: Plots the total standard deviation as a stacked area chart, showing the proportional contribution of the 'Between' and 'Within' components.
Normalized Mode: Plots the direct ratio of each component's variance (from 0 to 1), making it easy to identify which character is dominant.
Calculation Options: The volatility calculation can be optionally Volume weighted. An optional Normalize Volatility setting performs the calculation in logarithmic space, making volatility comparable across different price scales.
Volatility Pivot Detection: Includes a built-in pivot detector that identifies significant turning points (highs and lows) in the total volatility line. (Note: This is only visible in 'Absolute Mode').
Note on Confirmation (Lag): Pivot signals are confirmed using a lookback method. A pivot is only plotted after the Pivot Right Bars input has passed, which introduces an inherent lag.
Multi-Timeframe (MTF) Capability:
MTF Volatility Lines: The volatility lines can be calculated on a higher timeframe, with standard options to handle gaps (Fill Gaps) and prevent repainting (Wait for...).
Limitation: The Pivot detection (Calculate Pivots) is disabled if a Higher Timeframe (HTF) is selected.
Integrated Alerts: Includes 6 alerts for:
Volatility character changes (e.g., 'Trend Character Emerging', 'Character Change from Trend to Choppy').
Volatility pivot (high or low) detection.
DISCLAIMER
For Informational/Educational Use Only: This indicator is provided for informational and educational purposes only. It does not constitute financial, investment, or trading advice, nor is it a recommendation to buy or sell any asset.
Use at Your Own Risk: All trading decisions you make based on the information or signals generated by this indicator are made solely at your own risk.
No Guarantee of Performance: Past performance is not an indicator of future results. The author makes no guarantee regarding the accuracy of the signals or future profitability.
No Liability: The author shall not be held liable for any financial losses or damages incurred directly or indirectly from the use of this indicator.
Signals Are Not Recommendations: The alerts and visual signals (e.g., crossovers) generated by this tool are not direct recommendations to buy or sell. They are technical observations for your own analysis and consideration.

Volatility Cones **Volatility Cones - Interactive**
This indicator visualizes volatility cones based on historical or manual volatility and projects them up to 252 trading days into the future.
**Features:**
- Automatic start at the first trading day of the year (customizable)
- Volatility calculation from historical data or manual input
- Display of ±1σ, ±2σ, and ±3σ bands
- Projection of expected price movements based on volatility
**Use Case:**
Ideal for options traders and risk management to assess expected price movements over different time horizons.

Smart Levels V8 + Anomaly Detection CombinedTATANKA Smart Levels + Anomaly Detection
A comprehensive analysis tool combining manual level tracking with statistical anomaly detection for identifying high-probability trading opportunities.
CORE FEATURES:
Manual Level System:
• Plot custom support/resistance levels with automatic inflection point tracking
• Color-coded bull/bear level visualization with adjustable positioning
• Real-time level crossing alerts with directional confirmation
• Multi-timeframe pivot integration for additional context
Anomaly Detection Engine:
• Identifies statistical deviations from price equilibrium
• Generates scored signals based on multiple confirmation factors
• Visual threshold bands show deviation zones
• Horizontal projection lines from anomaly points until broken or session end
Session Management:
• RTH/OVN session filtering with multiple timezone support
• Enhanced scoring during key market hours (opening hour, power hour)
• Option to block signals outside regular trading hours
• Session-specific visual backgrounds for clarity
Signal Intelligence:
• Automated confluence scoring combining price action, volume, and momentum
• Multiple signal types: bounces, breakouts, reversals, exhaustion patterns
• RSI and ADX integration for regime awareness
• Customizable cooldown periods to reduce signal noise
• Quality thresholds to filter low-probability setups
Market Bias Panel:
• Real-time display of current market sentiment
• Shows distance to key levels and signal readiness
• Configurable positioning and visibility options
Visual Customization:
• Adjustable signal sizes, colors, and transparency
• Optional large circles for high-quality setups
• Directional arrows and score labels
• Clean interface with minimal chart clutter
BEST PRACTICES:
• Recommended for 1m-15m timeframes on liquid futures/forex markets
• Paste your key levels at session start or when levels update
• Adjust sensitivity based on asset volatility (lower multipliers = more signals)
• Use signals as reference points within your overall trading plan
• Combine with additional confirmation from order flow or other tools
IMPORTANT NOTES:
• This is an indicator, not an automated strategy
• Signals represent potential opportunities requiring discretionary analysis
• Past performance does not guarantee future results
• Adjust parameters through backtesting on your specific instruments
Statistical Price Deviation Index (MAD/VWMA)SPDI is a statistical oscillator designed to detect potential price reversal zones by measuring how far price deviates from its typical behavior within a defined rolling window.
Instead of using momentum or moving averages like traditional indicators, SPDI applies robust statistics - a rolling median and Mean Absolute Deviation (MAD) - to calculate a normalized measure of price displacement. This normalization keeps the output bounded (from −1 to +1 by default), producing a stable and consistent oscillator that adapts to changing volatility conditions.
The second line in SPDI uses a Volume-Weighted Moving Average (VWMA) instead of a simple price median. This creates a complementary oscillator showing statistically weighted deviations based on traded volume. When both oscillators align in their extremes, strong confluence reversal signals are generated.
How It Works
For each bar, SPDI calculates the median price of the last N bars (default 100).
It then measures how far the current bar’s midpoint deviates from that rolling median.
The Mean Absolute Deviation (MAD) of those distances defines a “normal” range of fluctuation.
The deviation is normalized and compressed via a tanh mapping, keeping the oscillator in fixed boundaries (−1 to +1).
The same logic is applied to the VWMA line to gauge volume-weighted deviations.
How to Use
The blue line (Price MAD) represents pure price deviation.
The green line (VWMA Disp) shows the volume-weighted deviation.
Overbought (red) zones indicate statistically extreme upward deviation -> potential short-term overextension.
Oversold (green) zones indicate statistically extreme downward deviation -> potential rebound area.
Confluence signals (both lines hitting the same extreme) often mark strong reversal points.
Settings Tips
Lookback length controls how much historical data defines “normal” behavior. Larger = smoother, smaller = more sensitive.
Smoothing (RMA length) can reduce noise without changing the overall statistical logic.
Output scale can be set to either −1..+1 or 0..100, depending on your visual preference.
Alerts and color fills are fully customizable in the Style tab.
Summary:
SPDI transforms raw price and volume data into a statistically bounded deviation index. When both Price MAD and VWMA Disp reach joint extremes, it highlights probable market turning points - offering traders a clean, data-driven way to spot potential reversals ahead of time.

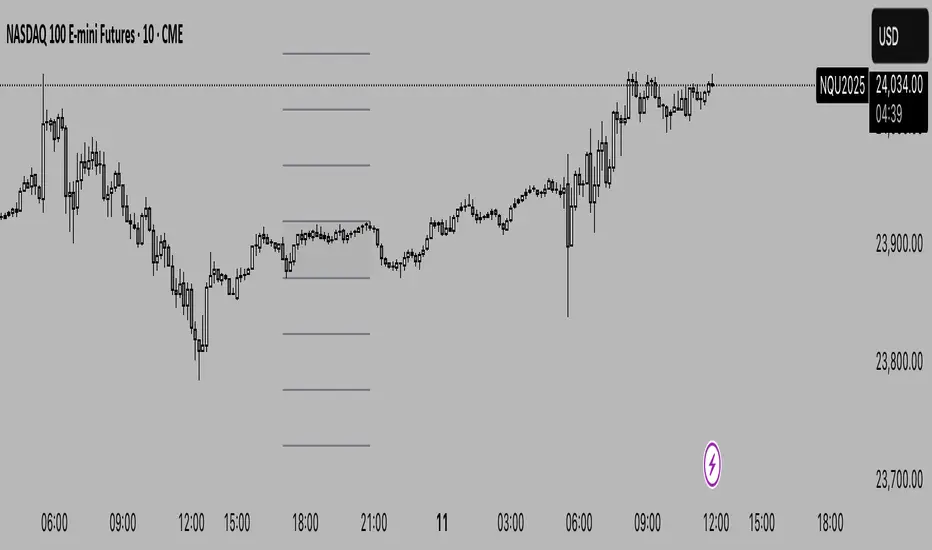
TBR Pro+marks session ranges and standard deviation levels to help you calculate where price could go next. You could also use it to top and bottom tick entries for indicies and CFDs!
Double Median SD Bands | MisinkoMasterThe Double Median SD Bands (DMSDB) is a trend-following tool designed to capture market direction in a way that balances responsiveness and smoothness, filtering out excessive noise without introducing heavy lag.
Think of it like a house:
A jail (too restrictive) makes you miss opportunities.
No house at all (too unsafe) leaves you exposed to false signals.
DMSDB acts like a comfortable house with windows—protecting you from the noise while still letting you see what’s happening in the market.
🔎 Methodology
The script works in the following steps:
Standard Deviation (SD) Calculation
Computes the standard deviation of the selected price source (ohlc4 by default).
The user can choose whether to use biased (sample) or unbiased (population) standard deviation.
Raw Bands Construction
Upper Band = source + (SD × multiplier)
Lower Band = source - (SD × multiplier)
The multiplier can be adjusted for tighter or looser bands.
First Median Smoothing
Applies a median filter over half of the length (len/2) to both bands.
This reduces noise without creating excessive lag.
Second Median Smoothing
Applies another median filter over √len to the already smoothed bands.
This produces a balance:
Cutting the length → maintains responsiveness.
Median smoothing → reduces whipsaws.
The combination creates a fast yet clean band system ideal for trend detection.
📈 Trend Logic
The trend is detected based on price crossing the smoothed bands:
Long / Bullish (Purple) → when price crosses above the upper band.
Short / Bearish (Gold) → when price crosses below the lower band.
Neutral → when price remains between the bands.
🎨 Visualization
Upper and lower bands are plotted as colored lines.
The area between the bands is filled with a transparent zone that reflects the current bias:
Purple shading = Bullish zone.
Golden shading = Bearish zone.
This creates a visual tunnel for trend confirmation, helping traders quickly identify whether price action is trending or consolidating.
⚡ Features
Adjustable Length parameter (len) for dynamic control.
Adjustable Band Multiplier for volatility adaptation.
Choice between biased vs. unbiased standard deviation.
Double median smoothing for clarity + responsiveness.
Works well on cryptocurrencies (e.g., BTCUSD) but is flexible enough for stocks, forex, and indices.
✅ Use Cases
Trend Following → Ride trends by staying on the correct side of the bands.
Entry Timing → Use crossovers above/below bands for entry triggers.
Filter for Other Strategies → Can serve as a directional filter to avoid trading against the trend.
⚠️ Limitations & Notes
This is a trend-following tool, so it will perform best in trending conditions.
In sideways or choppy markets, whipsaws may still occur (although smoothing reduces them significantly).
The indicator is not a standalone buy/sell system. For best results, combine with volume, momentum, or higher-timeframe confluence.
All of this makes for a really unique & original tool, as it removes noise but keeps good responsitivity, using methods from many different principles which make for a smooth a very useful tool

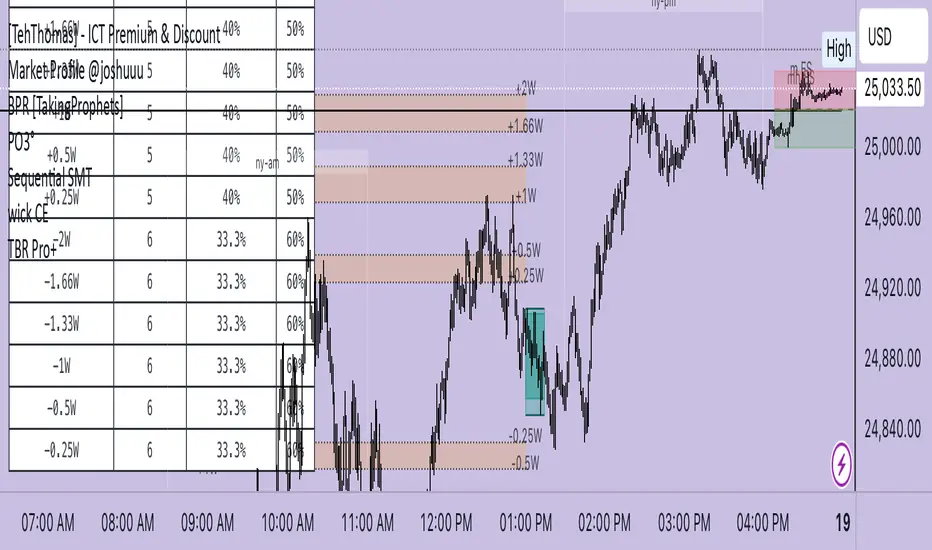
Auto Hourly Deviations {Module+}Description
This indicator automatically calculates and visualizes the prior hour’s price structure and its deviation levels. By combining core reference lines (high, low, EQ, quarters, open) with dynamic deviation levels and shaded zones, it provides a framework for understanding intraday price behavior relative to the most recent hourly range.
The tool has three functional sections that work together:
Core Hourly Structure – Captures the prior hour’s high, low, EQ (50%), and quarter levels (25% and 75%), plus the current open.
Deviation Levels – Projects standardized deviation multiples (±0.33, ±0.5, ±0.66, ±1.0, ±1.33, ±1.66, ±2.0) above and below the prior hour’s range.
Shading & Anchoring – Fills zones between key deviation levels for visual emphasis, while allowing projection offsets and anchor line references for precise chart alignment.
Together, these layers give traders a structured map of price movement around hourly ranges, making it easier to track expansion, retracement, and trend continuation.
1. Core Hourly Structure
Plots the prior hour’s high and low as key reference points.
Automatically calculates EQ (midpoint), 25%, and 75% levels.
Tracks the open of the current hour for immediate orientation.
Optional anchor line marks the start of each hourly window for time alignment.
Use: Frames the “hourly box” and subdivides it for intraday structure analysis.
2. Deviation Levels
Uses the prior hour’s range as a baseline.
Projects deviation levels above and below: ±0.33, ±0.5, ±0.66, ±1.0, ±1.33, ±1.66, and ±2.0.
Each level can be individually toggled with full line/label styling.
Use: Quantifies how far price is moving relative to the last hour’s volatility — useful for spotting overextensions, retraces, and probable reaction zones.
3. Shading & Anchoring
Shaded zones between selected deviation bands (e.g., +0.33 to +0.66 or +1.33 to +1.66) highlight potential liquidity or reaction areas.
Projection offsets allow levels to extend forward into future bars for planning.
Labels and color controls make the chart highly customizable.
Use: Provides quick visual cues for potential trading ranges and deviations without clutter.
Intended Use
This is a visualization tool, not a buy/sell system. Traders can use it to:
Track how price interacts with the prior hour’s high/low.
Measure hourly expansion through deviation levels.
Spot retracements or continuation zones inside and beyond the prior hour’s range.
Limitations & Disclaimers
Levels are derived from completed hourly candles; they do not predict outcomes.
Deviations are static calculations and do not account for fundamentals or volatility shifts.
This indicator does not provide financial advice or trading signals.
For informational and educational purposes only.
Trading involves risk; always apply proper risk management.
Closed-source (Protected): Logic is accessible on charts, but the source code is hidden. A TradingView paid plan is required for protected indicators.

Implied Volatility RangeThe Implied Volatility Range is a forward-looking tool that transforms option market data into probability ranges for future prices. Based on the lognormal distribution of asset prices assumed in modern option pricing models, it converts the implied volatility curve into a volatility cone with dynamic labels that show the market’s expectations for the price distribution at a specific point in time. At the selected future date, it displays projected price levels and their percentage change from today’s close across 1, 2, and 3 standard deviation (σ) ranges:
1σ range = ~68.2% probability the price will remain within this range.
2σ range = ~95.4% probability the price will remain within this range.
3σ range = ~99.7% probability the price will remain within this range.
What makes this indicator especially useful is its ability to incorporate implied volatility skew. When only ATM IV (%) is entered, the indicator displays the standard Black–Scholes lognormal distribution. By adding High IV (%) and Low IV (%) values tied to strikes above and below the current price, the indicator interpolates between these inputs to approximate the implied volatility skew. This adjustment produces a market-implied probability distribution that indicates whether the option market is leaning bullish or bearish, based on the data entered in the menu:
ATM IV (%) = Implied volatility at the current spot price (at-the-money).
High IV (%) = Implied volatility at a strike above the current spot price.
High Strike = Strike price corresponding to the High IV input (OTM call).
Low IV (%) = Implied volatility at a strike below the current spot price.
Low Strike = Strike price corresponding to the Low IV input (OTM put).
Expiration (Day, Month, Year) = Option expiration date for the projection.
Once these inputs are entered, the indicator calculates implied probability ranges and, if both High IV and Low IV values are provided, adjusts for skew to approximate the option market’s distribution. If no implied volatility data is supplied, the indicator defaults to a lognormal distribution based on historical volatility, using past realized volatility over the same forward horizon. This keeps the tool functional even without implied volatility inputs, though in that case the output represents only an approximation of ATM IV, not the actual market view.
In summary, the Implied Volatility Range is a powerful tool that translates implied volatility inputs into a clear and practical estimate of the market’s expectations for future prices. It allows traders to visualize the probability of price ranges while also highlighting directional bias, a dimension often difficult to interpret from traditional implied volatility charts. It should be emphasized, however, that this tool reflects only the market’s expectations at a specific point in time, which may change as new information and trading activity reshape implied volatility.

CISD SDICT CISD SD – Manipulation Swing Standard Deviations for Change in State of Delivery
Overview:
The ICT CISD SD indicator is a professional ICT tool designed to define the Manipulation Swing and automatically plot its Standard Deviation levels. Focused on intraday ICT analysis, this script dynamically updates toward the current bar, giving traders precise visual guidance on key swing levels and projected targets.
Key Features:
Define ICT Manipulation Swing:
Set the start and end time to define the Manipulation Swing.
Choose your timezone for accurate ICT intraday tracking.
Automatically calculates the High, Low, and optional Equilibrium (EQ) level of the Manipulation Swing.
Dynamic ICT Manipulation Lines:
Plots High, Low, and optional EQ lines of the Manipulation Swing.
Lines update dynamically with each new bar.
Fully customizable line color, style (solid, dashed, dotted), and width.
Labels feature configurable text color, background color, transparency, size, and placement.
Optional left-side trimming keeps charts clean and readable.
Manipulation Swing Standard Deviation Levels:
Automatically plots Standard Deviation levels as multipliers of the Manipulation Swing range (0.5x to 4.5x by default).
Levels can be plotted up from the swing low or down from the swing high, giving probabilistic target areas or key support/resistance zones.
Customizable line and label styling for all Standard Deviation levels, including color, transparency, width, style, and size.
Optional Shading for Visual Clarity:
Shade areas between the Manipulation Swing and a chosen Standard Deviation level for easy visualization.
Customizable shading color and opacity.
Professional ICT Usability:
Designed for clarity and minimal chart clutter.
Stick labels to the right of the current bar for maximum readability.
Dynamically adjusts with new bars, keeping all Manipulation Swing lines and Standard Deviation levels up-to-date.
Ideal For:
ICT intraday traders analyzing Manipulation Swings for Change in State of Delivery.
Traders seeking visual Standard Deviation levels for breakout, reversal, or continuation strategies.
Analysts who want clean, professional charts with full control over Manipulation Swing and Standard Deviation visualization.
How It Works:
User defines the ICT Manipulation Swing time to identify the swing.
The script calculates the High, Low, and optional EQ of the swing.
Swing lines are drawn and dynamically updated.
Standard Deviation levels are plotted based on user-defined multipliers.
Optional shading can highlight areas from the Manipulation Swing to selected Standard Deviation levels.
Customization Options Include:
ICT Manipulation Swing time and timezone.
Line and label styling for Manipulation Swing and Standard Deviation levels.
Left-side trimming to reduce chart clutter.
Enable/disable EQ line, Standard Deviation levels, and shading.
Direction of Standard Deviation levels (up from low or down from high).
Multipliers and shading transparency for professional ICT charting.
Conclusion:
The ICT CISD StdDev indicator offers a complete, professional solution for ICT intraday analysis, allowing traders to define the Manipulation Swing and visualize its Standard Deviation levels dynamically, enhancing precision and clarity in real-time trading.

CandelaCharts - Projections 📝 Overview
Projections turns a hand-picked swing window into clean, forward price levels. You pick a time range and an anchor (wick or body); the tool finds that window’s reference extremes (Level 0 & Level 1) and then projects directional extensions (e.g., −1, −2, −2.5, −4) in the chosen bias (Auto / Bullish / Bearish). It draws flat lines across the chart with optional labels so you can plan targets, fade zones, or continuation levels at a glance.
📦 Features
This section highlights the core capabilities you’ll rely on most.
Window-based engine — Define a start/end time; the script records open/high/low/close inside that window and builds levels from those extremes.
Two anchor styles — Project from Wick extremes (Hi/Lo) or Body extremes (max/min of OHLC at the high/low bars).
Directional bias — Auto (up if net up; doji resolves by wick dominance), or force Bullish/Bearish for one-sided extensions.
Default & Custom levels — Toggle pre-sets (−1/−2/−2.5/−4) or enter your own comma-separated list (decimals supported).
Readable drawings — Per-level colors (defaults) or unified bull/bear color (custom), with label size, line style, and width controls.
⚙️ Settings
Use these controls to define the window, pick the projection style, and customize the visuals.
Settings (Core)
From / To — Start and end timestamps of the capture window (everything is computed from this segment).
Bias — Auto / Bullish / Bearish. Guides which way negative levels extend (up for bull, down for bear).
Anchor — Wick uses Hi/Lo; Body uses the body extremes at the high/low bars.
Levels
Levels = Default — Enable any of −1, −2, −2.5, −4 and set each color.
Levels = Custom — Provide your own list (e.g., “−0.5, −1, −1.5, −3”) and pick Bullish/Bearish colors. (Custom uses one color per side.)
Style
Labels — Show/Hide the numeric level tag at the line’s right edge; choose label size.
Lines — Pick solid/dashed/dotted and line width.
⚡️ Showcase
Bearish Projection
Bullish Projection
📒 Usage
Follow these steps to set the window, generate levels, and turn them into a trade plan.
1) Mark the window — Set From/To around the swing you want to project (e.g., prior day, news impulse, weekly move).
2) Choose bias — Auto adapts; or lock Bullish/Bearish if you only want upside or downside projections.
3) Pick anchor — Wick = raw extremes; Body = more conservative reference. Body helps when single-print wicks distort levels.
4) Select levels — Toggle defaults or add a custom list. Negative values (−1, −2, …) extend beyond the reference extreme in the bias direction. (Level 0 and 1 are always drawn as the reference pair.)
5) Style it — Turn labels on, adjust size, and set line style/width for visibility on your timeframe.
6) Trade plan — Treat projections as reaction/continuation zones: scale out into −1/−2/−2.5, watch for fades back into the band, or ride continuation when price accepts beyond a level.
🚨 Alerts
There are no built-in alerts in this version.
⚠️ Disclaimer
Trading involves significant risk, and many participants may incur losses. The content on this site is not intended as financial advice and should not be interpreted as such. Decisions to buy, sell, hold, or trade securities, commodities, or other financial instruments carry inherent risks and are best made with guidance from qualified financial professionals. Past performance is not indicative of future results.

@M5V | Standard Deviation (Basic) | GCTStandard Deviation (Basic) — Patch Notes
What’s new
• Two custom sessions (A & B) only—no presets.
• Timezone-aware sessions (IANA, e.g., America/New_York, Europe/London).
• Exact width matching: SD lines span exactly from the session’s first bar to its last bar
(same as the box).
• Start/End verticals control: None, Start only, End only, or Both.
• Anchor choice: Build ranges from either Wicks or Bodies.
• Deviation style: Full (1.0× steps) or Half (0.5× steps), with adjustable count.
• Optional Equilibrium (midline).
• Global line style and box visibility toggles.
How it works (under the hood)
1. Session tracking:
• At each session start (based on your Session + Timezone) the script stores the start bar and initializes hi/lo.
• While the session is active, it updates hi/lo using Wicks or Bodies (your choice) and extends the box to the current bar.
• On session end, it records the end bar.
2. Deviation drawing:
• Computes range = high − low.
• Draws symmetric SD bands above/below using your Full/Half setting and count.
• All SD lines are drawn from start bar → end bar so they match the box width exactly.
• If Equilibrium is on, the midline (avg of high/low) is drawn across the same width.
3. Start/End lines:
• According to Start/End Lines setting, verticals are drawn at the start bar, end bar, both, or not at all—each spanning from session low to high.
Quick use
• Pick Session windows for A/B and set each Timezone.
• Choose Wicks or Bodies, Full/Half deviations, Count, Color, and whether to show
Equilibrium and Boxes.
• Set Start/End Lines to control the vertical markers.
• Optional: change Line Style (solid/dotted/dashed).