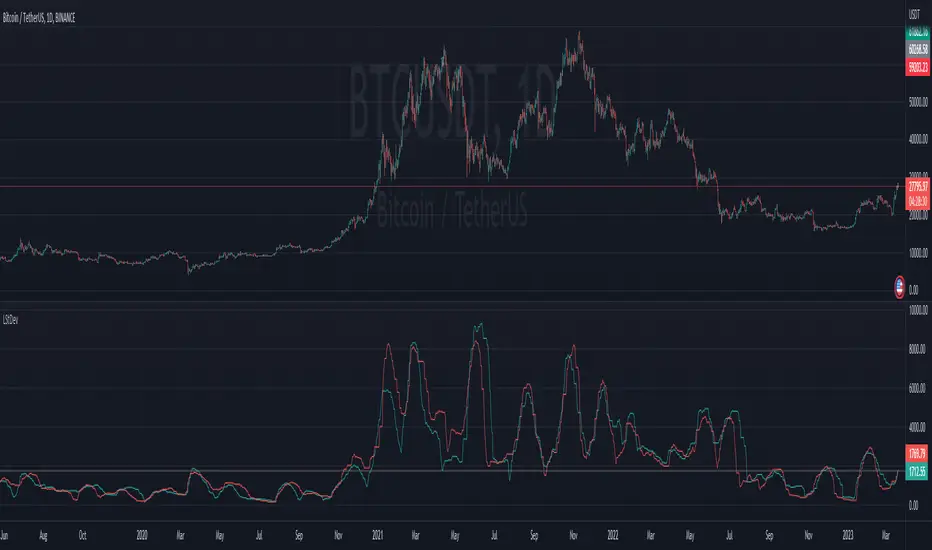
Ladder StDevThis indicator shows the upwards (green) and downward (red) volatility of the market. It is a standard deviation of the price but with a twist! For the upwards volatility , only the green candles are taken into account, and for the downwards only the red candles are.
Compared to my previous "Ladder ATR" indicator this a different approach to measure the the upwards and downwards volatility of the market by utilizing the standard deviation instead of the ATR. When both measure the volatility they have different "dynamics". Standard deviation increases the weight of larger values over smaller values. The ATR indicator is based on the average of absolute changes. So, if we apply the indicators on a daily chart , ATR considers intraday and between-day data, while the standard deviation calculation includes only daily returns (source price).
標準差(StdDev)
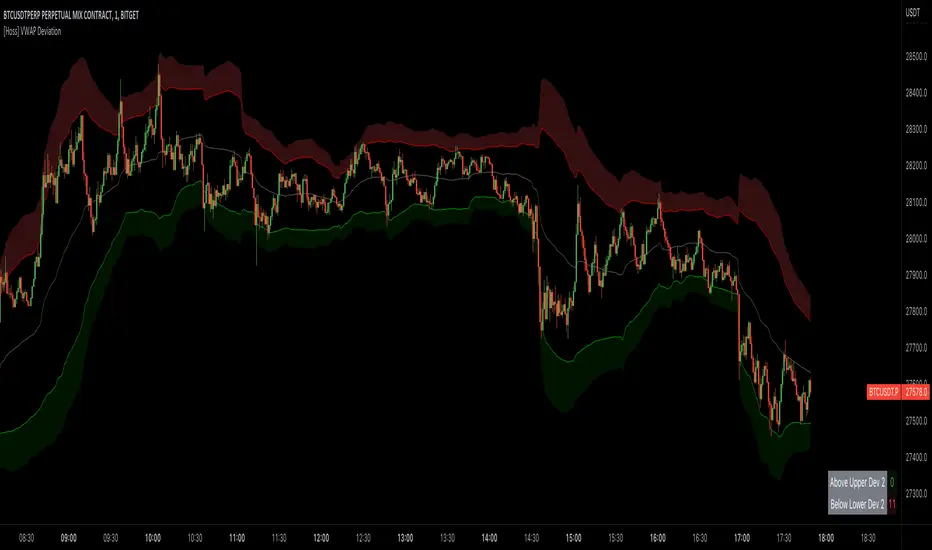
[Hoss] VWAP ADThe VWAP ( Volume Weighted Average Price ) Deviation script is a powerful tool designed for traders to analyze the relationship between price and volume . By calculating deviations around the VWAP , the script allows users to identify key support and resistance levels that can help in making better-informed trading decisions.
The script calculates VWAP based on the chosen data source (default is closing price) and then computes deviations above and below the VWAP using either the Average Deviation or the Standard Deviation method. The user can select the desired method through the script's input options. These deviations are then plotted as bands on the chart, providing a visual representation of the areas where the price may potentially revert or experience a breakout.
A unique and valuable feature of this script is the addition of a monitor that counts the number of times the price crosses above the Upper Deviation level 2 and below the Lower Deviation level 2 within a user-defined lookback period. This monitor is displayed as a table in the bottom right corner of the chart and can be enabled or disabled through an input option.
The cross count monitor serves as a valuable aid to traders by providing insights into the historical frequency of price crossing the deviation levels. This information can be used to identify potential trading opportunities based on historical price behavior around these levels.
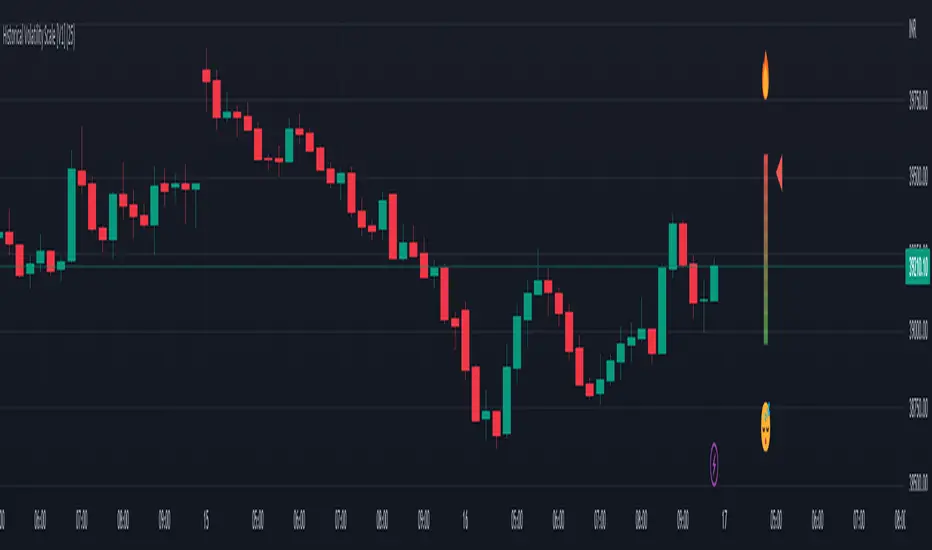
Historical Volatility Scale [ChartPrime]This indicator outputs a visual scale representing the level of volatility in the market relative to the timeframe selected on the users chart. The method of volatility used is "historical volatility" which is calculated by taking the standard deviation of a series of "x" length which contains the current closing price divided by the previous closing price for all nodes. The output of the volatility is standardized by also running an additional percentrank calculation over the raw volatility values to allow the volatility scale to oscillate properly between its minimum of 0 and maximum of 100.
📗 SETTINGS
Length: The length determines how many bars/nodes should be considered when calculating the standard deviation. In simple terms, the higher the length, the less sensitive and less reactive the scale will be to current price action, and larger moves would be required to trigger the scale.
🧰 UTILITY
The arrow or "The Pin" will move upwards towards the "fire" emoji when the volatility is higher than the majority of values for the amount of bars back that you set the "length" setting to. Vise Versa for when the pin is lowering towards the "snooze" emoji, the volatility is less than the majority of nodes/values for the past "length" amount of values.
When the volatility is low, a trader could consider utilizing more leading indicators to make their trading decisions as opposed to lagging indicator such as trend indicators. When the volatility is low, the price action is consolidation which would be bad for a trend following strategy. Vise Versa for trend strategies, having a higher volatility may be better for such strategies.
Its important to remember that this indicator itself is a lagging indicator, in that it relies on historical data to showcase the current state of the markets volatility. This means that although the recommendation in the previous paragraph may make logical sense, it is not a guarantee that if the volatility is showcasing a trending market, that your trend strategies will necessarily be profitable.
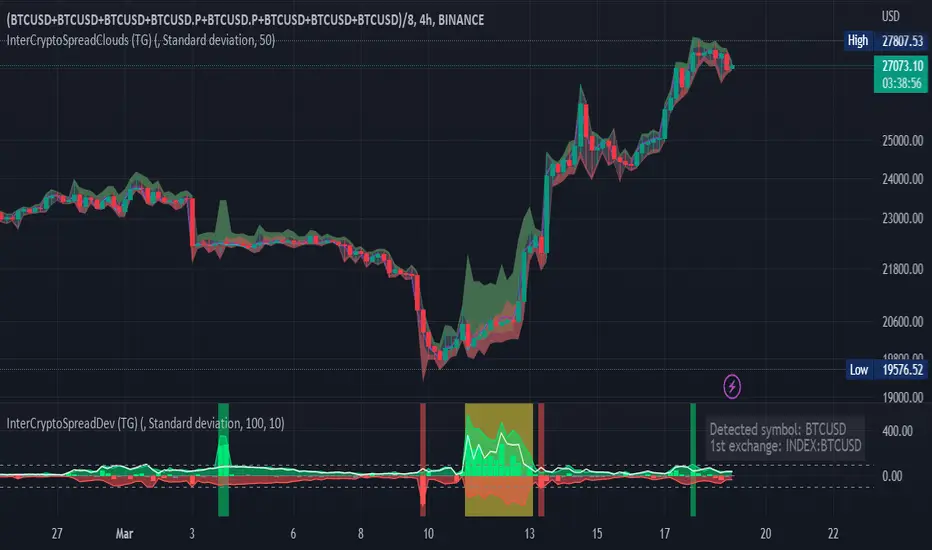
Inter-Exchanges Crypto Price Spread Deviation (Tartigradia)Measures the deviation of price metrics between various exchanges. It's a kind of realized volatility indicator, as the idea is that in times of high volatility (high emotions, fear, uncertainty), it's more likely that market inefficiencies will appear for the same asset between different market makers, ie, the price can temporarily differ a lot. This indicator will catch these instants of high differences between exchanges, even if they lasted only an instant (because we use high and low values).
Both standard deviation and median absolute deviation (more robust to outliers, ie, exchanges with a very different price from others won't influence the median absolute deviation, but the standard deviation yes).
Compared to other inter-exchanges spread indicators, this one offers two major features:
* The symbol automatically adapts to the symbol currently selected in user's chart. Hence, switching between tickers does not require the user to modify any option, everything is dynamically updated behind the scenes.
* It's easy to add more exchanges (requires some code editing because PineScript v5 does not allow dynamical request.security() calls).
Limitations/things to know:
* History is limited to what the ticker itself display. Ie, even if the exchanges specified in this indicator have more data than the ticker currently displayed in the user's chart, the indicator will show only a timeperiod as long as the chart.
* The indicator can manage multiple exchanges of different historical length (ie, some exchanges having more data going way earlier in the past than others), in which case they will simply be ignored from calculations when far back in the past. Hence, you should be aware that the further you go in the past, the less exchanges will have such data, and hence the less accurate the measures will be (because the deviation will be calculated from less sources than more recent bars). This is thanks to how the array.* math functions behave in case of na values, they simply skip them from calculations, contrary to math.* functions.
Weighted Deviation Bands [Loxx]What are Weighted Deviation Bands?
Variation of the Bollinger bands but it uses linear weighted average and weighted deviation via Mladen Rakic.
What is Weighted Deviation?
This weighted deviation is a sort of all linear weighted deviation. It uses linear weighting in all the steps calculated (which makes it different from the built in deviation in a case when linear weighted ma is used in the ma method). It is more responsive than the standard deviation
Included
Bar coloring

Fibonacci Volatility BandsFibonacci Volatility Bands are just an alternative that allows for more margin than regular Bollinger Bands. They are created based on an average of moving averages that use the Fibonacci sequence as lookback periods.
The use of the Fibonacci Volatility Bands is exactly the same as the Bollinger Bands.

Z Pack BollingerOur new "Z Pack" indicator is a modified version of the traditional Bollinger Bands indicator, with a bunch of additional features what makes it a powerful tool that allows traders to make informed decisions based on the market's volatility and short-term trend.
The z-score of the Bollinger Bands indicator is a measure of how many standard deviations the current price is away from the moving average. This provides a more normalized view of the price action, which can be especially useful in identifying potential trend changes. In this form of indicator it is much easier to notice the most extreme deviations from the mean.
One of the main advantages of using this indicator is that it can help traders identify market conditions that are unusually far away from the mean, which can be indicative of a potential trend reversal or that, with sustained momentum a new trend may be about to begin.
Another advantage of the Z-Score Bollinger Bands indicator is that it can help traders identify when a market is trending. This is because when the Z-score is consistently high or low, it can indicate that a trend is in progress or that a trend may be reversing, respectively.
As for the additional features with which we have charged this indicator, there are many of them and they will be explained now.
Capital line
"Capital line" is based on a kernel regression of z score value over time.
The kernel regression is a non-parametric method that allows to estimate the underlying probability density function of a random variable and this way provides a smooth representation of the data. By using this method, the "Сapital line" is able to react to market changes much faster than traditional methods and gives traders a more accurate representation of the short-term trend.
Also we have developed a filter that reduces the number of false signals (you can toggle it in the settings). It is also possible to enable the display of only the capital line to focus only on it.
Divergence search
One of the unique features of the indicator is its ability to search for divergence between the z score and the price. A divergence occurs when the indicator and the price are moving in opposite directions, indicating a potential trend reversal. This allows traders to identify potential market turning points and make informed decisions.
It is possible to search for divergence on a Z-score, although it is not a common practice. In technical analysis, divergence is a method of comparing the movement of an asset's price with an indicator, such as an oscillator, in order to identify potential trend reversals. The same concept of divergence can be applied to a Z-score by comparing the movement of a value's Z-score to the underlying data, for example, by comparing the change in Z-score to the change in the underlying price of a stock. However, this is not a widely used approach and requires thoughtful analysis, but according to our observations, it provides quite important information about the potential exhaustion of the current trend.
By combining the z-score with the price, traders can look for divergences that might not be as obvious when looking at the indicator or the price alone. For example, if the z-score is trending higher while the price is trending lower, this could indicate a potential bullish reversal. Similarly, if the z-score is trending lower while the price is trending higher, this could indicate a potential bearish reversal.
Price Labels
The labels indicating the price of an asset that corresponds to a specific level of the standard deviation are a useful feature for traders because it allows them to quickly identify key levels of support and resistance. By placing limit orders at these levels, traders can potentially enter or exit trades at more favorable prices. This can help to improve the risk-reward ratio of their trades, as well as potentially increase the chances of a profitable outcome. Additionally, having these labels readily available can save traders time in identifying key levels of support and resistance, allowing them to focus on other aspects of their trading strategy.
Additionally, there is an option to analyze the previous volatility of the instrument for a specified time period. If the instrument has crossed the maximum standard deviation level at least once during the specified time period, a separate dashed line will be drawn on the z score chart, demonstrating how volatile the instrument is in the context of the specified time period. This is known as Extreme Mode.
The feature of analyzing the previous volatility of an instrument using the z score indicator can be beneficial for traders in a number of ways. One major advantage is that it allows traders to quickly assess the historical volatility of an instrument and compare it to current volatility levels. This can be useful for determining if an instrument is currently experiencing unusually high or low volatility, which can in turn inform trading decisions.
Another advantage of this feature is that it allows traders to quickly identify key levels of volatility that have been historically significant for the instrument. For example, if an instrument has frequently crossed the maximum deviation level during a specified time period, a trader may choose to place limit orders at that level in anticipation of the instrument reaching it again in the future.
The ability to see the price at a particular moment in time when the price breaks through the 4th(selectable) level of the z score can be an advantage for traders as it allows them to quickly identify key price levels and potentially place limit orders at those levels. This feature can be useful for traders who want to take advantage of market volatility or for those who want to set stop-loss or take-profit levels.
Additionally, the feature can be useful for identifying key levels of support and resistance, as well as for identifying potential entry and exit points for trades. By having the ability to quickly identify these key levels, traders can make more informed decisions about their trades and potentially increase their chances of success in the market.
Alerts
The "Z pack" indicator also includes an advanced, customisable alerting system, with alerts for z level touches, zero crossings, changes in the direction of the capital line, and confirmed or potential divergence. It allows them to stay informed of key developments in the market in real-time and take action accordingly.
For example, if the indicator generates an alert for a z level touch, a trader can place a market order at that level knowing that the price has reached a significant level of volatility. Similarly, an alert for a zero crossing (up/down) can indicate a change in trend, and a trader can use this information to adjust their strategy accordingly.
The alerts of confirmed or potential divergence can be especially useful for identifying potential turning points in the market and make decisions based on that.
NB! Remember, it is important to have a solid trading plan in place and to properly manage risk when trading. Our custom indicator can be a useful tool, but it should not be the only factor considered when making trade decisions.

DEVIATION OF THE STOCHASTIC INDICATORThis new technical indicator uses the stochastic oscillator as its base and calculates the deviation of its moving average, generating an alternative view of market volatility.

Fair value bands / quantifytools— Overview
Fair value bands, like other band tools, depict dynamic points in price where price behaviour is normal or abnormal, i.e. trading at/around mean (price at fair value) or deviating from mean (price outside fair value). Unlike constantly readjusting standard deviation based bands, fair value bands are designed to be smooth and constant, based on typical historical deviations. The script calculates pivots that take place above/below fair value basis and forms median deviation bands based on this information. These points are then multiplied up to 3, representing more extreme deviations.
By default, the script uses OHLC4 and SMA 20 as basis for the bands. Users can form their preferred fair value basis using following options:
Price source
- Standard OHLC values
- HL2 (High + low / 2)
- OHLC4 (Open + high + low + close / 4)
- HLC3 (High + low + close / 3)
- HLCC4 (High + low + close + close / 4)
Smoothing
- SMA
- EMA
- HMA
- RMA
- WMA
- VWMA
- Median
Once fair value basis is established, some additional customization options can be employed:
Trend mode
Direction based
Cross based
Trend modes affect fair value basis color that indicates trend direction. Direction based trend considers only the direction of the defined fair value basis, i.e. pointing up is considered an uptrend, vice versa for downtrend. Cross based trends activate when selected source (same options as price source) crosses fair value basis. These sources can be set individually for uptrend/downtrend cross conditions. By default, the script uses cross based trend mode with low and high as sources.
Cross based (downtrend not triggered) vs. direction based (downtrend triggered):
Threshold band
Threshold band is calculated using typical deviations when price is trading at fair value basis. In other words, a little bit of "wiggle room" is added around the mean based on expected deviation. This feature is useful for cross based trends, as it allows filtering insignificant crosses that are more likely just noise. By default, threshold band is calculated based on 1x median deviation from mean. Users can increase/decrease threshold band width via input menu for more/less noise filtering, e.g. 2x threshold band width would require price to cross wiggle room that is 2x wider than typical, 0x erases threshold band altogether.
Deviation bands
Width of deviation bands by default is based on 1x median deviations and can be increased/decreased in a similar manner to threshold bands.
Each combination of customization options produces varying behaviour in the bands. To measure the behaviour and finding fairest representation of fair and unfair value, some data is gathered.
— Fair value metrics
Space between each band is considered a lot, named +3, +2, +1, -1, -2, -3. For each lot, time spent and volume relative to volume moving average (SMA 20) is recorded each time price is trading in a given lot:
Depending on the asset, timeframe and chosen fair value basis, shape of the distributions vary. However, practically always time is distributed in a normal bell curve shape, being highest at lots +1 to -1, gradually decreasing the further price is from the mean. This is hardly surprising, but it allows accurately determining dynamic areas of normal and abnormal price behaviour (i.e. low risk area between +1 and -1, high risk area between +-2 to +-3). Volume on the other hand is typically distributed the other way around, being lowest at lots +1 to -1 and highest at +-2 to +-3. When time and volume are distributed like so, we can conclude that 1) price being outside fair value is a rare event and 2) the more price is outside fair value, the more anomaly behaviour in volume we tend to find.
Viewing metric calculations
Metric calculation highlights can be enabled from the input menu, resulting in a lot based coloring and visibility of each lot counter (time, cumulative relative volume and average relative volume) in data window:
— Alerts
Available alerts are the following:
Individual
- High crossing deviation band (bands +1 to +3 )
- Low crossing deviation band (bands -1 to -3 )
- Low at threshold band in an uptrend
- High at threshold band in a downtrend
- New uptrend
- New downtrend
Grouped
- New uptrend or downtrend
- Deviation band cross (+1 or -1)
- Deviation band cross (+2 or -2)
- Deviation band cross (+3 or -3)
— Practical guide
Example #1 : Risk on/risk off trend following
Ideal trend stays inside fair value and provides sufficient cool offs between the moves. When this is the case, fair value bands can be used for sensible entry/exit levels within the trend.
Example #2 : Mean reversions
When price shows exuberance into an extreme deviation, followed by a stall and signs of exhaustion (wicks), an opportunity for mean reversion emerges. The higher the deviation, the more volatility in the move, the more signalling of exhaustion, the better.
Example #3 : Tweaking bands for desired behaviour
The faster the length of fair value basis, the more momentum price needs to hit extreme deviation levels, as bands too are moving faster alongside price. Decreasing fair value basis length typically leads to more quick and aggressive deviations and less steady trends outside fair value.

GAVAD - Selling after a Strong MovimentThis strategy search for a moment whe the market make two candles are consistently strong, and open a Sell, searching the imediactly correction, on the new candle. It`s easy to see the bars on the histogram graph. Purple Bars represent the candle variation. when on candle cross ove the Signal line the graph plot an Yellow ci, if the second bar crossover the signal a green circle is ploted and the operation start on start of the next candle.
This strategy can be used in a lot of Stocks and other graphs. many times we need a small time of graph, maybe 1 or 5 minutes because the gain shoud be planned to a midle of the second candle. You need look the stocks you will use.
Stocks > 100 dolars isnt great, markets extremly volatly not too. but, Stocks that have a consistently development are very interisting. Look to markets searching maybe 0.5% or 1%.
For this moment, I make the development of a Brasilian Real x American Dollar. In 15 Minutes.
if you use in small timeframe the results can be better.
On this time we make more than 500 trades with a small lot of contracts, without a big percent profitable, but a small profit in each operation, maybe you search more than. To present a real trading system I insert a spreed to present a correct view of the results.
Each stock, Index, or crypto there is a specific configuration?
my suggestion for new stocks
You need choice a stock and using the setup search set over than 70% gain (percent profitable), using a 1% of gain and loss between 1-2%
as the exemple (WDO)
default I prepare a Brazilian Index
6-signal (6% is variation of a candle of the last candle)
10000- multiplicator (its important to configure diferences betwen a stock and an Indice)
gain 3 (this proportion will be set looking you target, how I say, 1% can be good)
loss 8 (this proportion will be set with you bankroll management, how I say, maybe 2%, you need evaluate)
for maximize operations I use in the 1 or 5 minute graph. Timeframes more large make slowlly results,
(but not unable that you use in a 1 hour or a 1 day.)
I make this script by zero. Maybe the code doesnt so organized, but is very easy to understand. If you have any doubts . leave a comment.
I hope help you.

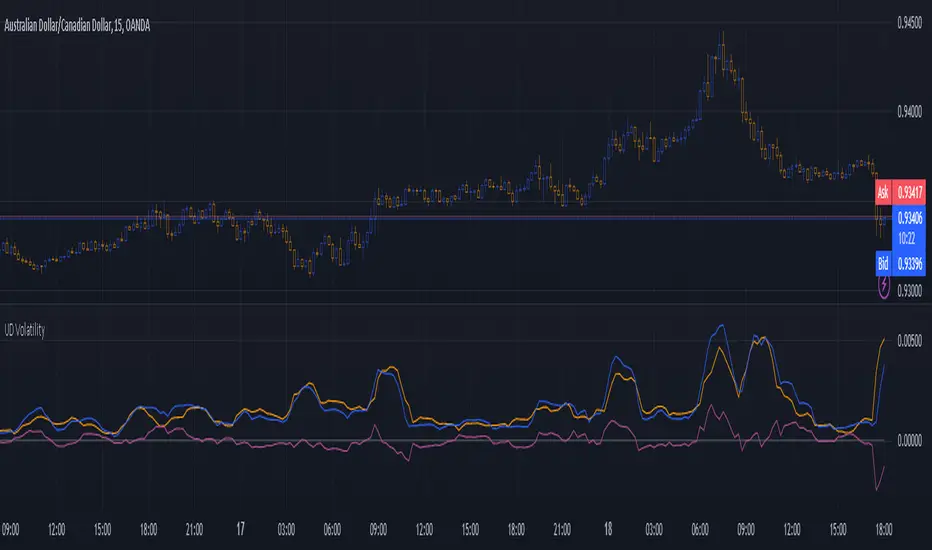
Up Down VolatilityThis is just experimental. I wanted the flexibility in looking at volatility and this indicator gives you several ways to do so.
I haven't figured out the best way to use this yet but I suspect that as a form of entry confirmation indicator would be best.
If you find a way this works well for you please drop me a note. It would nice know someone found a way to use it successfully!
The options available are:
* Your source can be price or the ATR.
* It allows you to separate the volatility of the bearish and bullish candles and even allows you to produce differential.
* You can choose to run the result through any one of many smoothers.
With the above options you can look at:
* The normal volatility. That is not split into bearish and bullish components.
* The bearish and bullish volatility and the difference between them.
* The relative bearish and bullish volatility and the difference between them.
The "The relative bearish and bullish" is each one divided into the source before it was split into Up and Down or low/high divided by close which should make the max value roughly around 1.
The code is structured to easily drop into a bigger system so use it as a lone indicator or add the code to some bigger project you are creating. If you do integrate it into something else then send me a note as it would be nice to know it's being well used.
Enjoy and good luck!
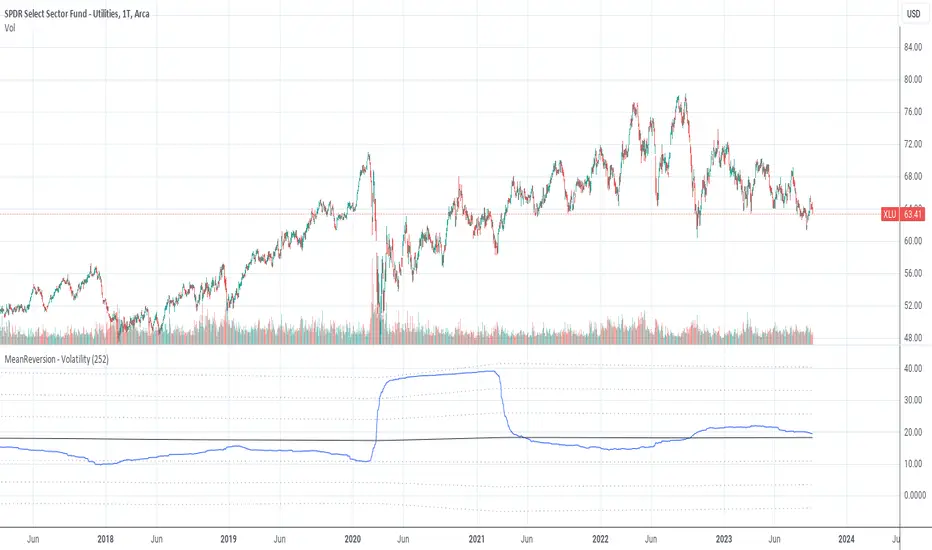
MeanReversion by VolatilityMean reversion is a financial term for the assumption that an asset will return to its mean value.
This indicator calculate the volatility of an asset over a period of time and show the values of logRerturn, mean and standart deviations.
The default time period for volatility calculation is 252 bars at a "Daily" chart. At a "Daily" chart 252 bar means one trading-year.
See also:
MeanReversion by Logarithmic Returns
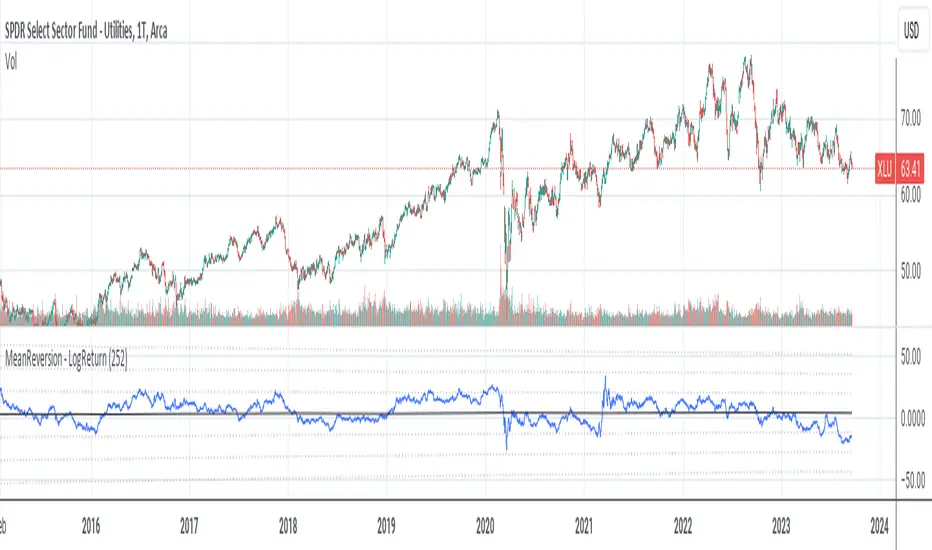
MeanReversion by Logarithmic ReturnsMean reversion is a financial term for the assumption that an asset will return to its mean value.
This indicator calculate the logarithmic returns (logReturn) of an asset over a period of time and show the values of logRerturn, mean and standart deviations.
The default time period for logReturn calculation is 252 bars at a "Daily" chart. At a "Daily" chart 252 bar means one trading-year.
See also:
MeanReversion by Volatility
VWAP Previous VWAP WMQY StdDev Extensions Nadro StyleDisplays Multi-TF VWAP with Std Dev Bands.
Developing VWAP and Std Dev Bands
Previous VWAP and Std Dev Bands
Previous VWAP Extensions
Some Examples
VolatilityCone by ImpliedVolatilityThis volatility cone draws the implied volatility as standard deviations from a measurement date.
For best results set measurement date to high volume bars.
How to use:
1) Select VolatilityCone from Indicators
2) Click to the chart to set the measurement date
3) Determine the impliedvolatility for the measurement date of your symbol
e.g.
For S&P500 use VIX value at measurement date for implied volatility

ZenBot Signals - Trend StrengthI developed this indicator as a "regime detection" for my algo trading bot. It uses the ADX +/- values with a few twists.
- If ADX DI+ is over 30 and DI- is below 20 and falling (inverse for shorts)
- Price action rising/falling thru various VWAP standard deviations indicates a strong trend break
- Some other custom juju (open source so have fun).
I use this primarily to monitor the SPY index as a backdrop for my long and short trades. If the colored line below price bars is red or green, a strong trend is present and there is a decent trade environment.

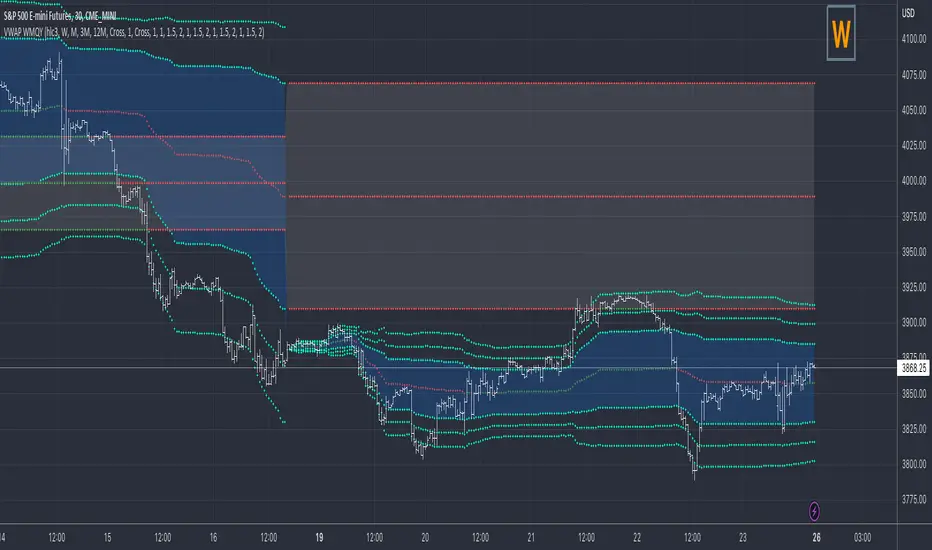
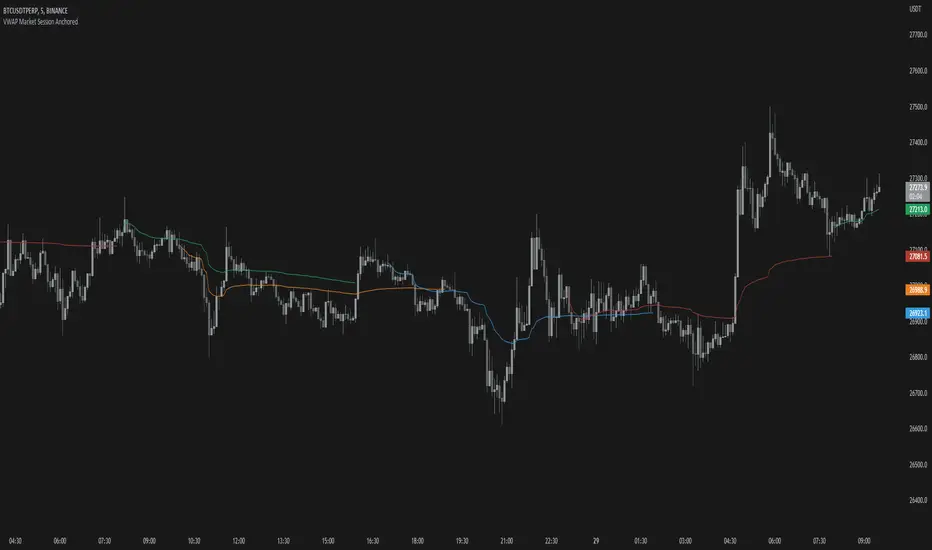
VWAP Market Session AnchoredVWAP Market Session Anchored differs from the traditional VWAP or VWAP Auto Anchored indicator in that the Volume Weighted Average Price calculation is automatically anchored to four major market session starts: Sydney, London, Tokyo, New York.
Settings
Source: the source for the VWAP calculation.
Offset: changing this number will move the VWAP either Forwards or Backwards, relative to the current market. Zero is the default.
Band: enabling this will show Standard Deviation bands.
Band Multiplier: the value the Standard Deviation bands will be multiplied by before being plotted on the chart.
Sessions : enabling the sessions will plot the respective anchored VWAP on chart.
Custom: enabling this will show a custom user-defined session.
Custom UTC : the custom session is defined by a starting UTC hour followed by the ending UTC hour.
Usage
Similar to the traditional VWAP, VWAP Market Session Anchored is a technical analysis tool used to measure the average price weighted by volume. VWAP Market Session Anchored can be used to identify the trend during a specific market session.
Limitations
When setting a custom session, be mindful that calculations are based off of the Coordinated Universal Time (UTC) time, you must convert your local time zone to UTC in order to have an accurate representation of your custom session.
It is not recommended to use this indicator on timeframes above 1 hour as market sessions only last a few hours.
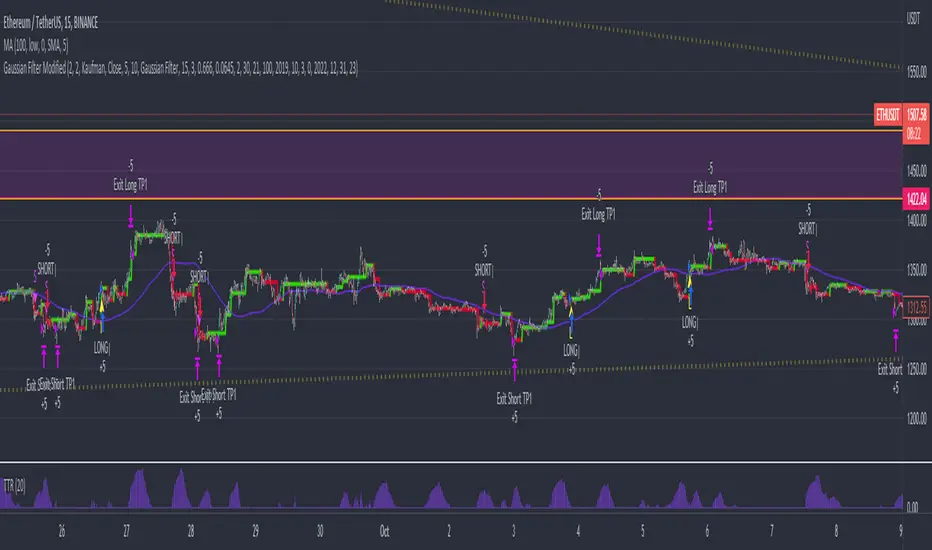
Gaussian Filter ModifiedAn effort to enhance auto-trading based on Gaussian Filter with Standard Deviation Filtering, Trading True Range and Smoothed SMA was added to remove noise contributing to ranging markets and unwanted entries against established trend.
Gaussian parameters need to be adjusted for different asset pair to find its own "signature", then filter out bad entry with TTR and SMA.
*Credits to Loxx for his work on Gaussian Filter
Asymmetric Dispersion High Lowdear fellows,
this indicator is an effort to determine the range where the prices are likely to fall within in the current candle.
how it is calculated
1. obtain
a. gain from the open to the high
b. loss from the open to the low
in the last 20 (by default) candles and
in the last 200 (10*20 by default) candles
2. perform
a. the geometric average (sma of the log returns) over these gains and losses
b. their respective standard deviation
3. plot from the open of each candle
a. the average + 2 standard deviations (2 by default) of the short window size
b. same for the long window size (which is overlapped)
what it shows
1. where the current candle is likely to move with 95% likelyhood
how it can be interpreted
1. a gauge for volatility in the short and long term
2. a visual inbalance between likelyhood to go up or down according to dispersion in relation to current prices or candle open.
3. a confirmation of crossings of, for instance, support and resistances once the cloud is completely above or below.
in regard to bollinger bands (which are and excellent well proven indicator)
1. it segregates upward moves from the downward ones.
2. it is hardly crossed by prices
3. it is centered on the current candle open, instead of the moving average.
we welcome feedback and critic.
best regards and success wishes.

Quantitative mean reversion v4The code uses the concept of mean reversion. Mean reversion suggests that price over a period of time reverts back to its statistical mean. In simple terms, it means if a price has drifted apart from the statistical mean, after a certain amount of time, it will revert back to its statistical mean. This drift is measured via z-score. When the z-score value is high, the price is expected to revert. Besides, the higher the time frame you use, the lesser the drift is, so reduce the z-score in the tabs if you use higher time frames, else, vice-versa.
Based on the parameters, the code will provide a trade signal - both long and short, and entry and exit. You can use notifications for alerts. Please use the parameters in the options to find the best combinations for your stocks.
In the properties, you can use your own brokers commission, capital, to see if the strategy is profitable for your ticker in the long run or not. This code has been tested for profits for various assets in both crypto - Bitcoin futures , Ethereum futures -, and stocks - AMD , Apple , MSFT , etc.
This is not get rich quick scheme, and you have to be patient with it for the long run.
If you have any query, please feel free to ask in the comments sections.
If you want some new changes, please feel free to suggest
Currently, I am optimising the maximum time for holding a trade. Till that's completed, use this and please feel free to leave a feedback to make it better

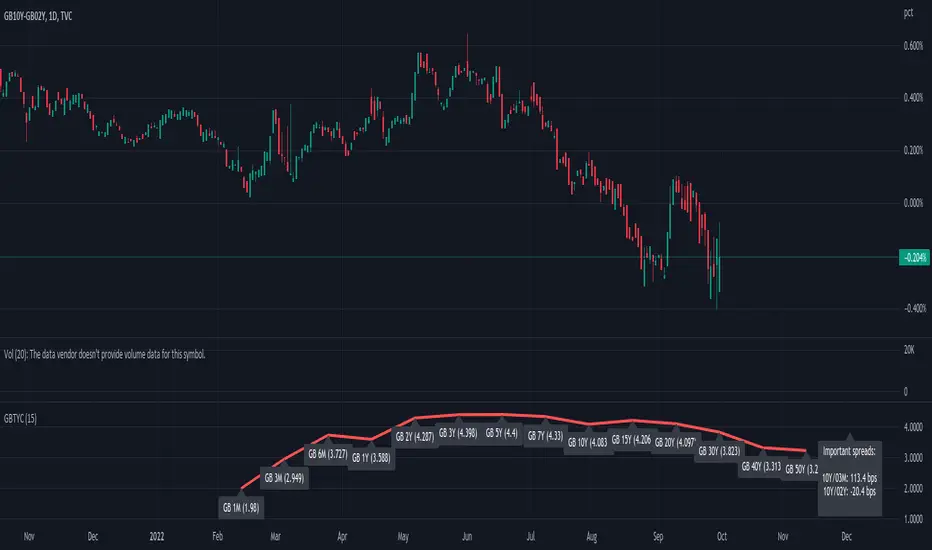
GB Gilt Yield CurveWith thanks to @longfiat whose US Treasury Yield Curve served as the basis for this indicator
This is created very quickly to provide a sense of the GB Gilt Yield curve in light of government induced market dysfunction as a result of an ill-conceived mini-budget.
Note that I omitted GB04Y, GB06Y, GB08Y, GB09Y and GB12Y to avoid overcrowding the chart with excess information and thereby render the indicator more readily usable.
Probability Cloud BASIC [@AndorraInvestor]🔮☁️
This is the BASIC version of the PROBABILITY CLOUD indicator.
It is an evolution beyond traditional standard deviation probabilistic indicators only using bands or channels.
The new PROBABILITY CLOUD graphic representation with customizable transparent layers is based on -2 / +2 standard deviation calculated using 20 fixed predetermined time periods, and is available in several calculation MODES:
SMA , EMA , WMA , VWMA , VWMA & VAWMA
The indicator is designed to let the trader visually understand the probabilistic depth of past, present and future price action, and its evolution over time.
Looking forward to your comments and feedback to guide me on future updates!
🙏 Big THANKS @Electrified for letting me use his work on Deviation Bands/ as a starting point for my first script.

Strength of Divergence Across Multiple IndicatorsOverview:
One-stop shop for all your divergence needs, including:
(1) A single metric for divergence strength across multiple indicators.
(2) Labels that make it easy to spot where the truly strong divergence is by showing the overall divergence strength value along with the number of divergent indicators. Hovering over the label shows a breakdown of each divergent indicator and its individual divergence strength value.
(3) Fully customizable, including inputs for pivot lengths, divergence types, and weights for every component of the divergence strength calculation. This allows you to quickly and easily optimize the output for any chart. Don't worry, the default settings will have you covered if you're not interested in what's going on under the hood.
The Divergence Strength Calculation:
The total divergence strength value is the sum of the divergence strengths of all indicators for which divergence was detected at a given bar. Each indicator's individual divergence strength is comprised of two basic components: (1) |ΔPrice| - the magnitude of the change in price over the divergence period (pivot-to-pivot), and (2) |ΔIndicator| - the magnitude of the change in indicator value over the divergence period.
Because different indicators' scales and volatility can vary greatly, the Δ values are expressed in terms of standard deviation to ensure that the values are meaningful and equitable across all indicators and assets/instruments/currency pairs, etc:
|ΔIndicator| = |indicator_value_1 - indicator_value_2| / 2 * StDev(indicator_series,100)
Calculation Weights:
All components of the calculation are weighted and can be modified on the Inputs page in settings (weights are simply multipliers). For example, if you think hidden divergence should carry less weight than regular divergence, you can assign it a lesser weight. Or if you think RSI divergence is worth more than OBV divergence, you can adjust their weights accordingly. List of weights:
Regular divergence weight - default = 1
Hidden divergence weight - default = 1
ΔPrice weight - default = 0.5 (multiplied by the ΔPrice component)
ΔIndicator weight - default = 1.5 (multiplied by the ΔIndicator component)
RSI weight - default = 1.1
OBV weight - default = 0.8
MACD weight - default = 0.9
STOCH weight - default = 0.9
Development for additional indicators is ongoing, as is research into the optimal weight configuration(s).
Other Inputs:
Pivot lengths - specify the number of bars before and after each pivot high/low to consider it a valid candidate for divergence.
Lookback bars and Lookback pivots - specify the number of bars or the number of pivots to look back across.
Price sources - specify separate price sources for bullish and bearish divergence
Display settings - specify how lines and labels should display, including which divergence strength values should show the largest labels. Include/exclude specific divergence types and indicators.
Please report any bugs, or let me know if you have any enhancement suggestions or requests for additional indicators.
@reees
