EPS DashboardThis script creates a little table in an indicator below your chart that allows you to view the earnings per share over the last year as well as calculates the year over year earnings per share growth. According to IBD, strong EPS growth is a great indicator of a potential super-performer stock so hopefully this will make it easier to keep an eye on this metric. Note it does not work on things without financial data like crypto, indexes, and ETFs.
股票

S&P 500 Earnings Yield SpreadThis indicator compares the attractiveness of equities relative to the risk-free rate of return, by comparing the earnings yields of S&P 500 companies to the 10Y treasury yields. "Earnings yield" refers to the net income attributable to shareholders divided by the stock's price - effectively the inverse of the PE ratio. The tangible meaning of this metric is "the annual income received by (attributable to) shareholders as a percent of the price paid to receive said income." Therefore, earnings yield is comparable to bond yields, which are "the annual income received by bond holders as a percent of the price paid to receive said income."
This indicator subtracts the earnings yield of S&P 500 companies from the current 10-year treasury bond yield, creating a "spread" between the yields that determines whether equities are currently an attractive investment relative to bonds. That is, if the S&P 500 earnings yield exceeds the 10Y treasury yield, then equity investors are receiving more attributable income per dollar paid than bondholders, which could be an indication that equities are an attractive purchase relative to the risk-free rate. The same applies vice-versa; if the 10Y treasury yield exceeds that of the S&P 500 earnings yield, then equities may not be an attractive investment relative to the risk-free rate.
Since data on S&P 500 companies' earnings yields are pulled on a monthly basis, this indicator should be used on a monthly timeframe or longer. Historical data has shown that the critical zones for the indicator are at -4% and +3%, i.e. when equities are trading with a 4% greater yield than 10Y T-bonds and when equities are trading with a 3% lower yield than 10Y T-bonds, respectively. In the "Oversold" case (-4%), equities are trading at a steep discount to the risk-free rate and has often represented a strong buying opportunity. In the "Overbought" case (+3%), equities are trading at a premium to the risk-free rate, which may be an indication that caution should be exercised within the stock market. When the indicator first crosses into "Oversold" territory, this has historically been near a the bottom of a crash on the S&P 500. When the indicator first crosses into the "Overbought" territory, this has often precipitated a correction of 15% on the S&P 500.
Some notable "misses," crashes that this indicator missed, include the 1973 stock market crash and the 2008 global recession. However, both of these cases were largely precipitated by unprecedented economic events, as opposed to stocks simply being "Overbought" relative to treasury yields. Nonetheless, this indicator should form only a small portion of your fundamental analysis, as there are many macroeconomic factors that could lead to major corrections besides the impact of treasury yields. Furthermore, it should also be noted that since markets are "forward looking," future earnings growth or interest rate hikes may become "priced into" both the stock and bond markets, affecting the outputs of this indicator. However, since both the stock and bond markets should account for these factors simultaneously, the impact has historically been minimized.
I hope you find this indicator to be beneficial to your strategies. Stay safe, and happy trading.

AnyChartI changed few lines of code from TradingView's original Open Interest indicator to make this one. I wanted to compare other charts to while entering my trade like looking at BTC when trading in alts. It has option to view any chart. Add other things to improve your analysis.

JPM VIX Signal - Non OverlayJPMorgan Chase & Co . strategists have identified what they say is a near bulletproof indicator to strengthen their argument that stock markets are poised to rally.
The buy signal is triggered when the Cboe Volatility Index ( VIX ) rises by more than 50% of its 1-month (30 day) moving average, which it last did on January 25th 2022, according to the strategists led by Mislav Matejka. The indicator has proven 100% accurate outside of recessions over the last three decades.
Instructions:
Symbol - SPY
Timeframe - Daily
Signal - Indicator exceeds horizontal line of 1.5

JPMorgan VIX Buy SignalJPMorgan Chase & Co. strategists have identified what they say is a near bulletproof indicator to strengthen their argument that stock markets are poised to rally.
The buy signal is triggered when the Cboe Volatility Index (VIX) rises by more than 50% of its 1-month (30 day) moving average, which it last did on January 25th 2022, according to the strategists led by Mislav Matejka. The indicator has proven 100% accurate outside of recessions over the last three decades.
Instructions:
Symbol - VIX
Timeframe - Daily
Red Triangle - Close / 30 Day SMA >= 1.5

HighLow Box Highlight between EarningsHighLow Box Highlight between Earnings
This is an indicator to highlight area between two earning periods and their highest and lowest points.
It also alternates the highlight color in each subsequent block.
Tested to work in 1D charts and 1M charts
Just drop a message, if you want this further developed with more features.
Note: This was requested by user Meatpye on a forum.

Session Levels - Ultimate Range IndicatorSession Levels - Ultimate Range Indicator
Primarily developed for trading the E-MINI Futures Markets like NQ or ES from the CME Group,
but also more than suitable for Crypto or other instruments.
This indicator highlights the chosen session, which can be Globex, Asian, London and New York.
It plots the important levels and also renders the Opening Range as it forms (a.k.a. Initial Balance).
After the 1st hour Opening Range is finished, it can plot the Standard Deviations / Projections.
See below for a complete feature list.
All Opening Ranges on chart and for the New York session the Range Projections are turned on:
s3.tradingview.com
How to use (example):
If you are trading the Nasdaq Futures (NQ!)
Enable the Globex Overnight session. Basically in the Futures Market, the Globex session is everything outside of US trading hours of Stocks. This draws the important overnight levels, like the Low, 25%, 50%, 75% and the High.
Enable the New York Session with Levels and Opening Range. Generally, 70% of the time the 1st hour will put a Low or High of the day.
If the price is trading above the Globex Low, most likely the Low of the Day is formed and the price target for the day will be 1.5x Standard Deviation and 2x Standard Deviation.
[*} Deviation of the Initial Balance depends on the volume ad overall market structure.
** This is not financial advice or any guarantee **
Features:
Show each Session Highlighted on Intraday chart in it's own color (each session can be turned off and has customizable times and color)
Show Line Levels of each session: Low, 25%, 50%, 75% and the High (customizable color)
Show the Opening Range (Initial Balance) of the Asian, London and New York session. Note: NY has more options.
Opening Range is displayed as a box with level lines (customizable color)
Levels are drawn to the end of the NY Cash session (customizable time)
Show IB Standard Deviations 0.5 - 3.0. Calculated from the Opening Range (Initial Balance)
Option to display Higher Timeframe levels: Previous Day Open/Close and Previous Week Open/Close
All level lines and OR boxes size dynamically as the session progresses
Built in Alerts for when price hits key levels. e.g. Alert when price crosses the NY Opening Range High. Or an Alert when the first STDEV is hit.
Option to toggle display of drawings for Today's trading session only, or Show all recent session levels. This keeps the chart clean or not.
Extras:
The NY Opening Range also has a 50% level line
The NY Opening Bar can be highlighted separately
The Level Lines can have small labels turned on/off. Values are only shown on mouse over to keep a clean chart
Keep in mind:
1) This indicator works on all instruments, but on instruments with limited market hours, your chart setting
has to be set to "Extended Hours" otherwise. For example TSLA on NASDAQ.
2) The Exchange Time Zone for the CME Group is Chicago UTC-6. So the session times you configure in the settings menu are based on that timezone too.
3) Globex opens at 5pm CST and closes when the US session starts 8:30CST.
4) When enabling the Alerts in the Indicator settings, be sure to also create an alarm for this indicator using the Alarm function of Tradingview.

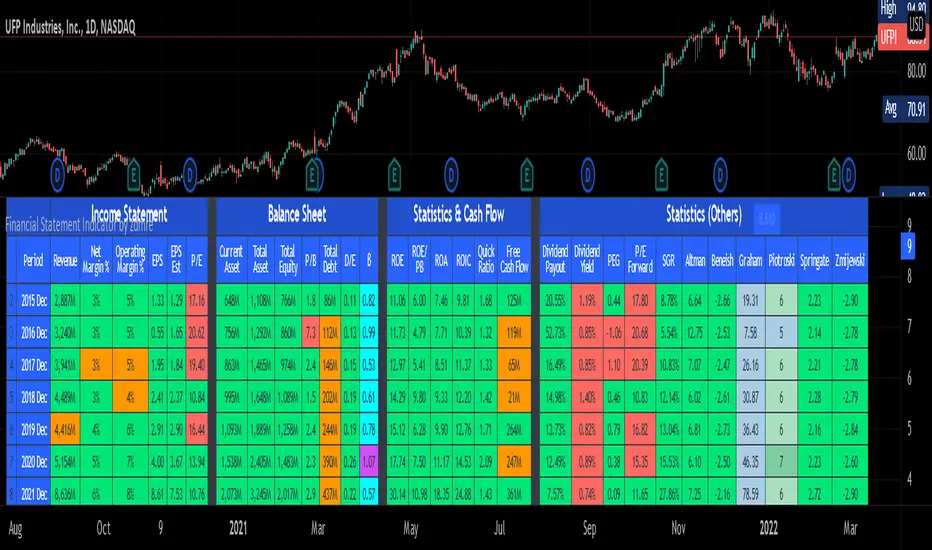
Financial Statement Indicator by zdmreKnowing how to work with the datas in a company's financial statements is an essential skill for stock investors. The meaningful interpretation and analysis of balance sheets, income statements, and cash flow statements to discern a company's investment qualities is the basis for smart investment choices.
You can access to the financials tables of the companies as a summary with this indicator.
3 Tables;
Income Statement Table:
Revenue
Net Profit
EPS
EPS-D
P/E
Balance Sheet Table:
Current Asset
Total Asset
Total Equity
Book Value per Share
Total Debt
Debt/Equity
Statistics & Cash Flow Table:
Return On Equity
Return On Asset
Return On Invested Capital
Quick Ratio
Free Cash Flow
Gap Absorption StrategyLike the nature, markets don't like the void, and this is something we can take advantage of by trading gaps on some markets.
This technique is well known, so I wanted to write a tiny script based on this strategy to get a bit more comfortable with it.
IMPORTANT: Default parameters wont give you good trades on every markets, you need to modify these parameters to see which proportions correspond to the stock you're trading.
This script triggers signals on predefined variation of a stock price after a gap, and allows its user to configure TP and SL prices corresponding to a specific percentage of this gap movement.
Note: We can observe that opening gaps are often the most interesting.
Options
Trigger: the price variation you want to trigger on (in % of the price)
Stop Loss : in % of the gap
Take profit : in % of the gap
A small table is displayed in the top right corner of the chart to give you TP/SL/Signal prices for each opportunity
SL (red line) and TP (green line) are also displayed on the chart when a signal is triggered
Information concerning the current opportunity is given at the bottom of the chart
Note: This script is based on the Gap-Size-Indicator that I published a few weeks ago.

Trend intensity 65 TI65––––History & Credit
This indicator has been inspired by public videos of StockBee and his community. Stockbee is a famous successful trader, who has approach to detail and backtesting. The TI65 is a great confirmation tool for the trend strenght.
–––––What it does
TI65 is an indicator that measures trend and momentum over 65 days.
When there is a green cloud we have a confirmed uptrend with certain velocity.
The calculation is simple as it measures the ratio between the 7d SMA over the 65D sma.
–––––How to use it
Look for entry points when during green trade intensity.

Diluted Earnings Per Share Signal [AstrideUnicorn]Earnings Per Share (EPS) is a financial metric closely monitored by investors. The so-called "positive earnings surprise" - a situation when EPS reading for a stock beats the value forecasted by analysts gives a bullish signal for this stock. The EPS reading lower than the analysts' estimate gives a bearish signal.
The Diluted Earnings Per Share (Diluted EPS) metric calculates a company's potential earnings per share value in the case if all convertible securities get converted to common shares. Convertible securities include preferred shares, stock options, warrants, convertible debt, etc. Diluted EPS is a more scientific way to estimate earnings per share, and it is usually lower than the ordinary EPS.
The Diluted EPS Signal indicator (DEPSS) is a fundamental indicator that calculates trading signals by comparing the Diluted EPS to the EPS Estimate. In many cases, Diluted EPS gives better insight into how a reported EPS reading may impact the stock price.
HOW TO USE
For each earnings date, the indicator calculates the Diluted Earnings Surprise percentage value :
Diluted Earnings Surprise = (Diluted EPS - EPS Estimate)/ EPS Estimate.
Diluted Earnings Surprise higher than the specified threshold value is a bullish signal. In this case, the indicator displays a green triangle pointing up.
Diluted Earnings Surprise lower than the specified threshold value is a bearish signal displayed as a red triangle pointing down.
As one can see on the chart, there are a lot of situations where EPS readings with green labels (the ones that beat analysts' estimates) lead to down moves. The DEPSS indicator can spot weak earnings and give opposite signals.
SETTINGS
Earnings Surprise Threshold (%) : the threshold value (in percentage units) for the Diluted Earnings Surprise. The calculated Diluted Earnings Surprise must be higher than Earnings Surprise Threshold to be considered a BUY signal or lower than minus Earnings Surprise Threshold to be considered a SELL signal. The default value for Earnings Surprise Threshold is 20%.

Contrarian Scalping Counter Trend Bb Envelope Adx and StochasticContrarian Scalping is an trading strategy designed to take advanted of a counter-trend.
The advantage of these strrategies types is that they have a good profitability but with do not great gain (in relation at the time frame).
Indicators used:
Bollinger
Envelope
ADX
Stochastic
Rules for entry
For short: close of the price is above upper band from bb and envelope, adx is below 30 and stochastic is above 50
For long: close of the price is below lower band from bb and envelope, adx is below 30 and stochastic is below 50
Rules for exit
For short: either close of the candle is below lower band of bb or enveloper or stochastic is below 50
For long: either close o the candle is above upper band of bb or envelope or stochastic is above 50
If there are any questions let me know !

RSI Average Swing BotThis is a modified RSI version using as a source a big length(50 candles) and an average of all types of sources for candle calculations such as ohlc4, close, high, open, hlc3 and hl2.
In this case we are going to use a 0-1 scale for an easier calculation, where 0.5 is going to be our middle point.
Above 0.5 we consider a bullish possibility.
Below 0.5 we consider a bearish possibility.
I made a small example bot using that initial logic, together with 2 exit points for long or short positions.
If there are any questions, let me know !

Trendalix EntriesThis script is made to simplify the analysis of trends. It changes the mas based on whether you're looking at stocks or crypto. As these 2 markets currently move differently, they need a slightly different approach.
Crypto trends:
Can move much faster than stocks. Ideally the price should be bouncing above the williams alligators (about the 20-30 MAs).
Stocks:
These swing more than crypto so you need to get deep into these swing to be buying at the bottom of a move. The MAs are much larger, between the 50ma and 400ma. It's much more important here that the slower MAs are strong, i.e 200ma is above the 400ma, than it is that the faster MAs are okay.
For stocks an entry and stop line is drawn. These are only visible when the market is sufficiently in a pullback.

Relative Strength Index Leaderwhat will happen for the RSI if the price will increases or decreases by X percent ? This indicator takes your hands.
For instance:
You set Leader1 = 1 and Leader2 = -1 (by default), So this indicator shows you that if the price will increase 1% (Leader1) or decrease 1% (Leader2) How much the RSI will be?
So you have 3 horns, One of them main RSI that shows the amount of RSI right now, and 2 others show what will happen for RSI if the price increase or decrease by X percent.
if you need to contact me or new suggestions for improving send me an email:
sydalifazel@gmail.com

Swing Multi Moving Averages Crypto and Stocks StrategySimple and efficient multi moving average strategy combined with risk management and time condition.
Indicators/ Tools used
Multi selection moving average type like SMA , EMA , SMMA , VWMA , VIDYA , FRAMA , T3 and much more
Limit 1 entry max per week, entry on monday exit on sunday or risk management tp/sl.
Rules for entry:
LONG:Close of the candle cross above the moving average while the previous close was below. All of this is happening during monday session.
SHORT:Close of the candle cross below the moving average while the previous close was above. All of this is happening during monday session.
Rules for exit:
We exit either on sunday or if we reach tp/sl levels.
Observations:
I recommend use the strategy 2 types, one for long and another for short, using different parameters since long and short movements behave differently.
For example for long we can use a shorter moving average longth and a higher tp/sl while for short we can use a bigger moving average length and a smaller tp/sl
If you have any questions let me know !

Swing VWAP Crypto and Stocks StrategyThis is a strategy designed for swing trading on markets such as crypto and stocks.
Its components are:
VWAP
Time Management
Risk management
Rules for entry:
We entry only on Monday, if our close of the candle crossed above VWAP
Rules for exit
We exit always on Sunday or if we either hit the TP/SL levels.
If you have any questions let me know

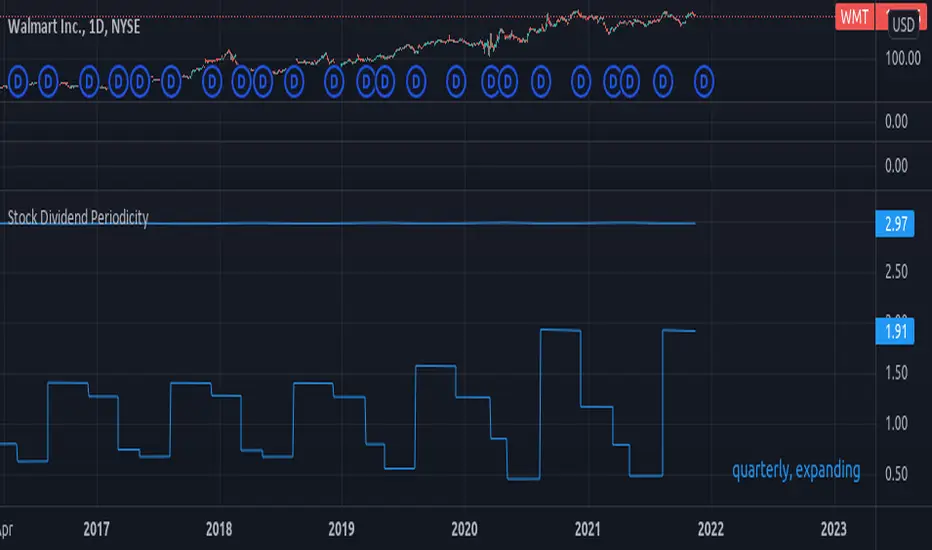
Stock Dividend Periodicityexperimental:
a basic method to evaluate stock dividend periodicity.
known issues:
* it does not adapt well to changes in periodicity, if there is a big enough change on the dividend period plan.
RSI Rising Crypto Trending AlertAlert version of the strategy with the same name
This is crypto and stock market trending strategy designed for long timeframes such as 4h+
From my tests it looks like it works better to trade crypto against crypto than trading against fiat.
Indicators used:
RSI for rising/falling of the trend
BB sidemarket
ROC sidemarket
Rules for entry
For long: RSI values are rising, and bb and roc tells us we are not in a sidemarket
For long: RSI values are falling, and bb and roc tells us we are not in a sidemarket
Rules for exit
We exit when we receive an opposite direction.
Cuation: Because this strategy uses no risk management, I recommend you takje care with it.
If you have any questions, let me know !

Scalping Trading System ALERT Crypto and StocksThis is the alert version of the strategy with the same name.
Indicators
SImple Moving Average
Exponential Moving Average
Keltner Channels
MACD Histogram
Stochastics
Rules for entry
long= Close of the candle bigger than both moving averages and close of the candle is between the top and bot levels from Keltner . At the same time the macd histogram is negative and stochastic is below 50.
short= Close of the candle smaller than both moving averages and close of the candle is between the top and bot levels from Keltner . At the same time the macd histogram is positive and stochastic is above 50.
Rules for exit
We exit when we meet an opposite reverse order.
This strategy has no risk management inside, so use it with caution !

Scalping Trading System bot Crypto and StocksThis is a trend trading strategy scalping bot that can work with any type of market. However I concluded my tests so far with Crypto, Stocks and Forex, and with optimizations always could be found some profitable settings.
Indicators
SImple Moving Average
Exponential Moving Average
Keltner Channels
MACD Histogram
Stochastics
Rules for entry
long= Close of the candle bigger than both moving averages and close of the candle is between the top and bot levels from Keltner. At the same time the macd histogram is negative and stochastic is below 50.
short= Close of the candle smaller than both moving averages and close of the candle is between the top and bot levels from Keltner. At the same time the macd histogram is positive and stochastic is above 50.
Rules for exit
We exit when we meet an opposite reverse order.
This strategy has no risk management inside, so use it with caution !

Daily HIGH/LOW strategyThis is a DAILY High/LOW strategy combined with a moving average and volume for more accuracy.
The rules are simple :
For long if we had a cross of the high with the previous high and close of the candle is above moving average and chaikin money flow volume is positive we have a long entry.
We exit when we cross down the moving average with the close of the candle.
For short if we had a crossdown of the low with the previous low and close of the candle is below moving average and chaikin money flow volume is negative we have a short entry.
We exit when we cross above the moving average with the close of the candle.
This strategy has no risk management inside so use it with caution.
If you have any questions, let me know

Average Highest High and Lowest Low Swinger StrategyThis is a full price action strategy designed for trending markets such as crypto and stocks.
Its purely made on calculations for the highest high and lowest low using 2 different length , a faster and a slower one.
With those we make multiple averages.
Rules for entry:
For long: our close of the candle is above both the average using fast and slow line
For short: our close of the candle is below both the average using fast and slow line
Rules for exit
We always exit when we have an opposite order
Caution
This strategy use no risk management system, so be careful with it
If you have any questions, let me know
