Stoploss

lamBOTghini-ALERTador & SL/TP V3I publish the code again in case someone is interested in learning. I am not an expert, I learned from others who published their scripts and for this reason I do the same.
If someone tries to sell you a script it is because they do not make money with it in trading and they need to sell it to earn something.
It is a simple combination algorithm of 3 EMA with stop loss and Take profit and with alerts.
Enjoy!
¡Mucho ánimo a los Venezolanos!
¡Saludos desde España!

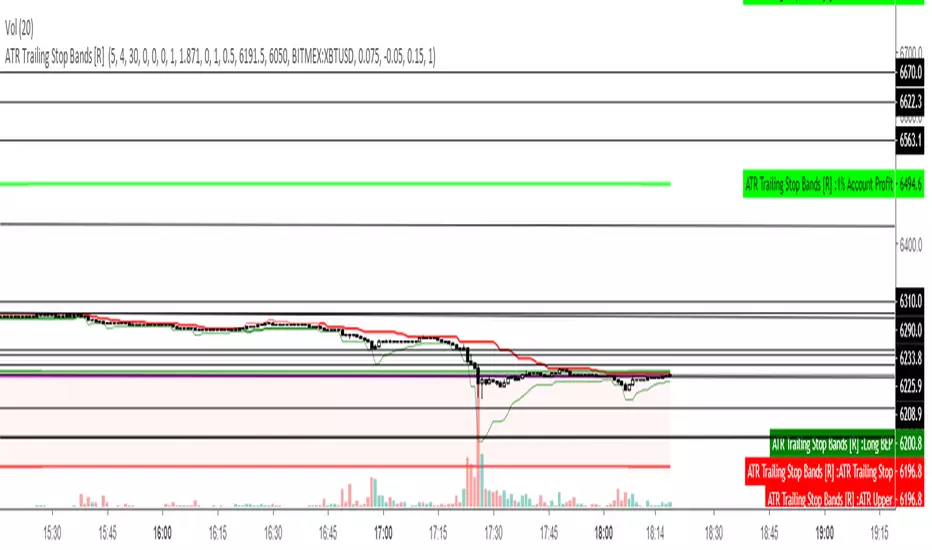
ATR Trailing Stop Bands [R] This is based on the Average True Range Trailing Stops Strategy by Sylvain Vervoort, coded on TV HPotter. I have added Bands to see potential short and long stop loss zones before the indicator signals to switch itself, also changed color on the main Trailing Stop based on whether it is short or long, added increased stop loss hunt protection by combining with my Wickiness indicator to add Wick Protection, based on either Average or Maximum Wicks, to prevent your stop getting wicked out. Experiment with different timeframes according to your trading style and how long you like to hold a trade. This indicator does not intend to tell you when to take profit, just how to place your stop to give you the best chance of not getting stopped out too early and to minimise risk by trailing it safely.
May you all never be stop hunted again.
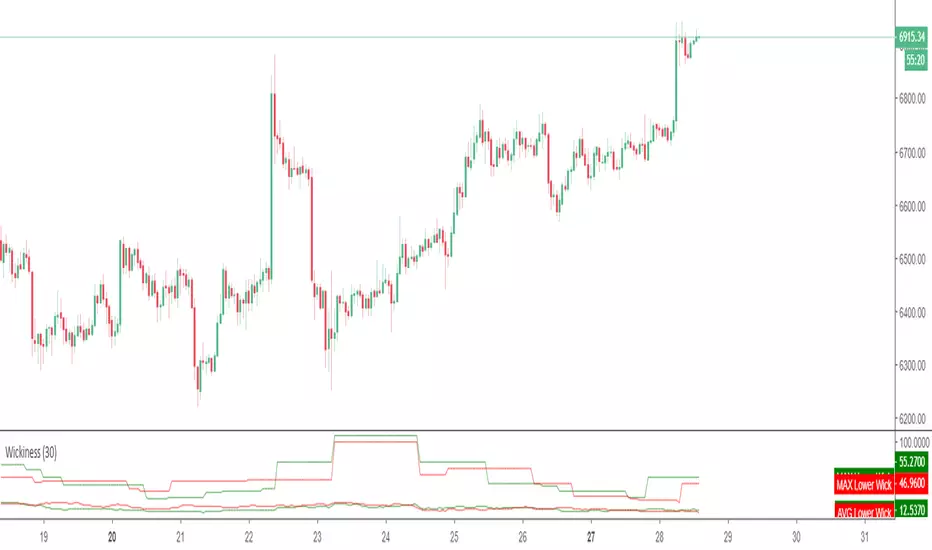
WickinessThis script measures the maximum and average length of upper and lower wicks. While this can be used as a volatility gauge and to see if there is more support or resistance, it's primary use is to not get wicked out on stops, by adding one of these numbers to the the Moving Average or S/R level that one is using for a Stop, plus maybe a few points of buffer.
Donchian Channel with Range AdditionA Donchian Channel with additional zones at places where its range is smaller than a set amount of atr. Thus it kind of combines with Keltner Channel qualities. Purpose is to set a stop loss wide enough to avoid shaking out of a position. The example chart shows a Philips day chart, where I opened position on 16 juli at 37,50 and set the stop loss at low border level 35,60, on 23 juli was an earnings rapport, the wick of the candle shows that quotes went very low, obviously smart traders had to fill a huge order and hunted for stops, triggering my stop closing the position. next days quotes went a lot better, so I missed the fun. The Donchian Channel was too narrow because quotes had ranged in the previous weeks. If I had placed my stop on the additional low, setting it 5 atr below the high border, my stop would have been safe.

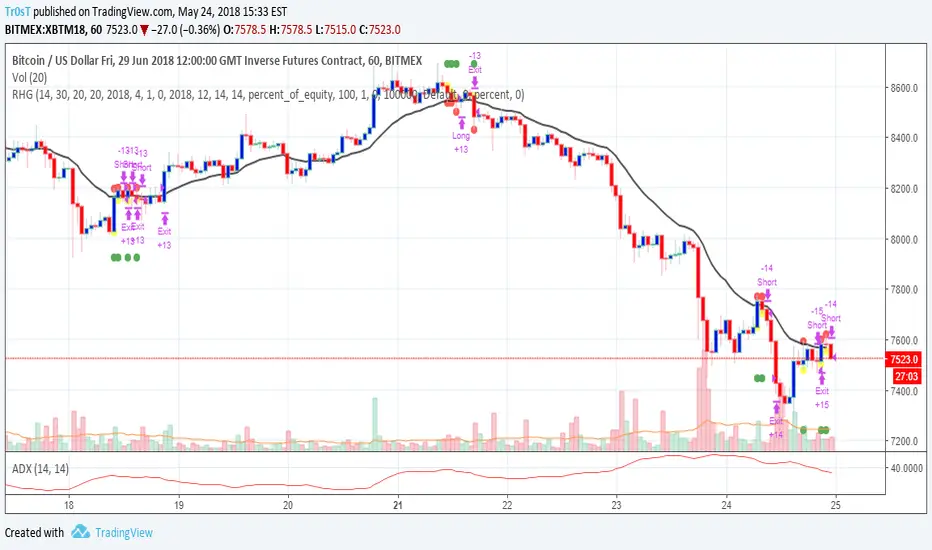
BitMex Trailing Stop StrategyThis script is designed for those who want to use BitMex's trailing stop. It's not meant to be used as entry exits, but rather to get an idea of how wide the trailing stop needs to be. I suggest you backtest with different values. The script can also be integrated into an existing strategy which does give entry/exits to act as its stop loss.

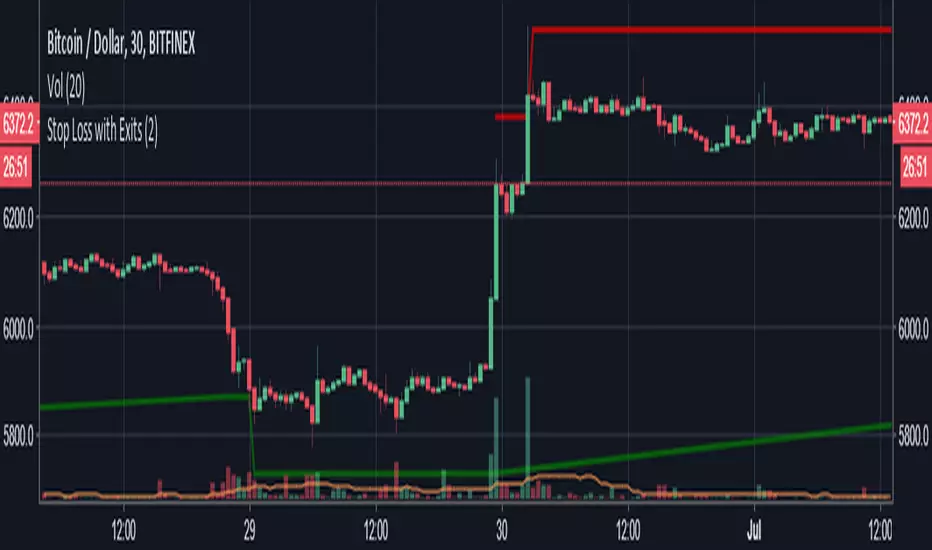
Stop Loss with ExitsStandard Percentage-based Stop Loss for long and short, with configurable extra exit conditions.
Just copy/paste into your script.
Uses "low" and "high" values for crossing the stop loss threshold, but can be changed to "close" if you prefer (change "low" and "high" on lines 31 and 32 to "close")
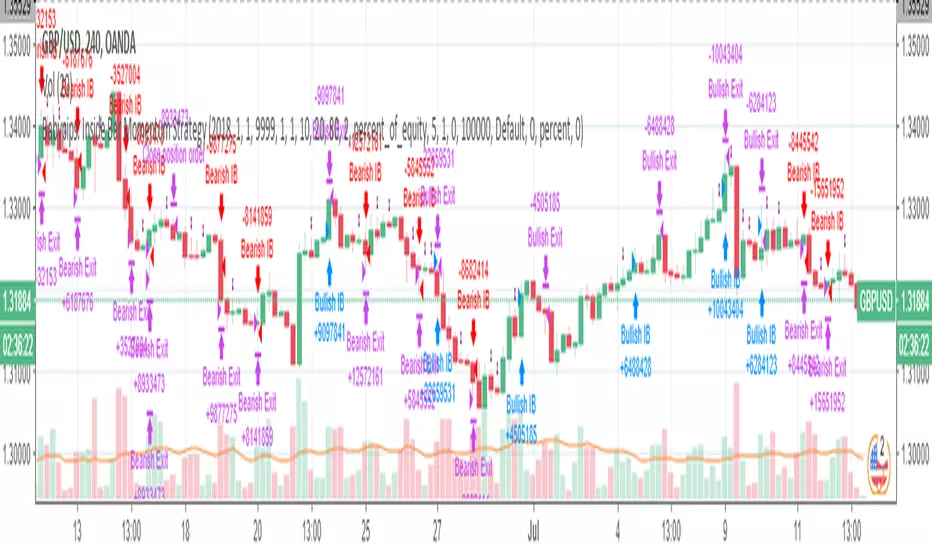
Babypips: Inside Bar Momentum StrategyThe strategy contained in this post comes courtesy of babypips (.com), an excellent resource for all thing forex related. If you are new to trading, the site is definitely worth checking out!
Code commentary and an introduction to Inside Bars are available for this post on the Backtest-Rookies (.com) website.
Note: If you are interested in custom development services, please check out our services page on the Backtest-Rookies site.
Strategy Overview
Inside Bar Momentum Strategy.
Inside Bar Detection
Position sizing based on stoploss distance ( Note: Based on equity and assumes that the account currency is the counter currency.
Stop buys for entries
Takeprofit / Stoplosses for exits
Control Stopbuy, Takeprofit and Stoploss targets with inputs
Control Backtest start/end dates
Double EMA with stop loss indicatorThis is an updated version of my previous stop loss script.
I've added a double EMA line and modified the stop as below;
In an uptrend....
1. a yellow dot will appear once it's time to move your stop. The yellow dot will display at the level of the stop loss. Place your stop 1 pip below the dot.
2. The yellow dot will only appear if a new higher low has formed and has been confirmed. Also the current candle must have broken the high of a previous bullish candle or the dot will not appear.
3. The dot will also appear if there is a likely reversal of the current trend.
Also works in downtrends.....

Toby Crabel's narrow range with historical volatility1. Find bar with the smallest narrow range for a chosen period. Use hvol for filter.
2. Place stop-order for long position at previous high and stop-order for short at previous low to catch breakout in any direction.
3. Take profit on the next bar.

Linda Raschke's Holy GrailAnother script based on Linda Raschke's strategy with the same name from her book about swing trading.
Stupid strategyStrategy with simple stop-loss and take-profit in percentage. If last trade was a successful one then repeat it. If not successful - do a reversal trade.

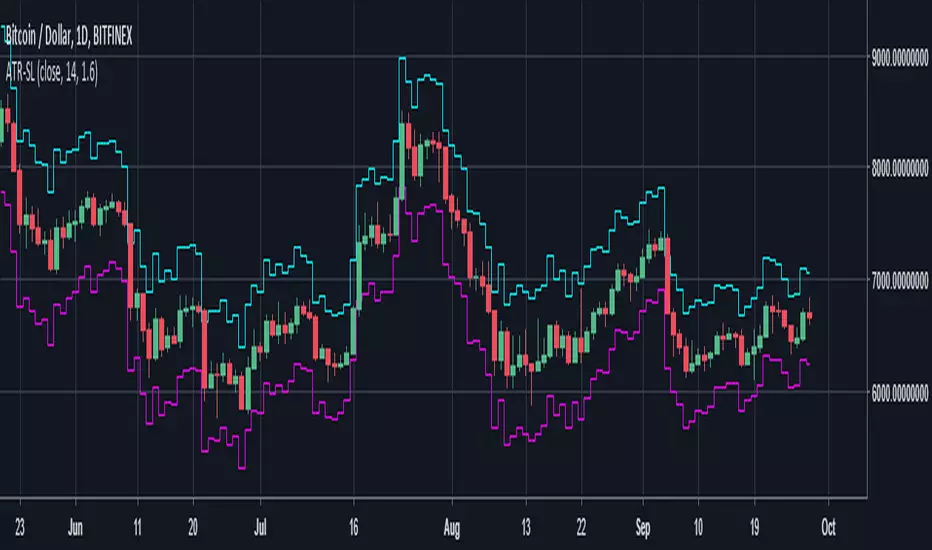
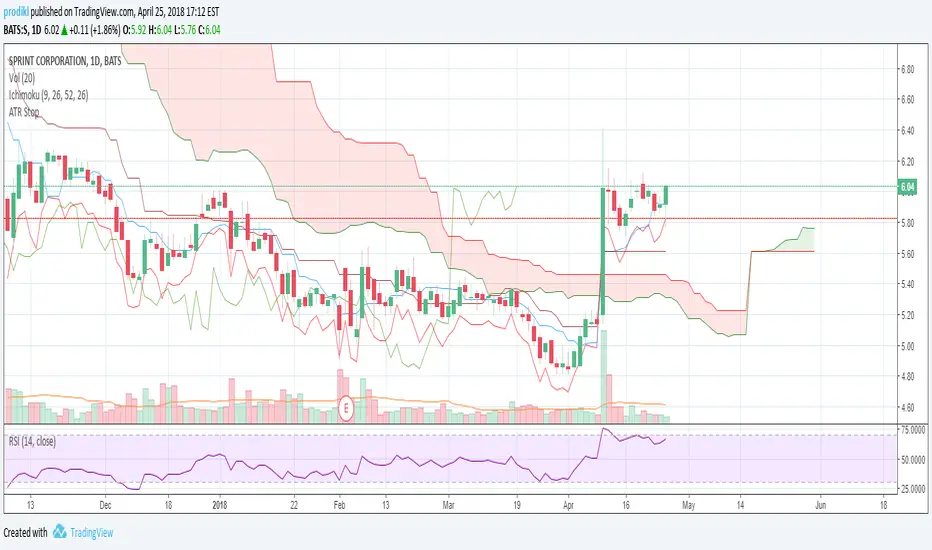
ATR Stop LossAdds an indicator that can be used to set stop losses.
This is the close price minus the ATR + 10%.
The 10% is there to let the market perform and avoid whipsaws.
SL/TP assistantThis is a simple script to quickly see changes in % in each candle.
In blue open/close variation. In red Histogram with range between high and low.
This helps me understand very quickly what's the typical change in % for a specific timeframe/pair, so I can fine tune my Stop Losses and Take Profits.

XPloRR MA-Trailing-Stop StrategyXPloRR MA-Trailing-Stop Strategy
Long term MA-Trailing-Stop strategy with Adjustable Signal Strength to beat Buy&Hold strategy
None of the strategies that I tested can beat the long term Buy&Hold strategy. That's the reason why I wrote this strategy.
Purpose: beat Buy&Hold strategy with around 10 trades. 100% capitalize sold trade into new trade.
My buy strategy is triggered by the fast buy EMA (blue) crossing over the slow buy SMA curve (orange) and the fast buy EMA has a certain up strength.
My sell strategy is triggered by either one of these conditions:
the EMA(6) of the close value is crossing under the trailing stop value (green) or
the fast sell EMA (navy) is crossing under the slow sell SMA curve (red) and the fast sell EMA has a certain down strength.
The trailing stop value (green) is set to a multiple of the ATR(15) value.
ATR(15) is the SMA(15) value of the difference between the high and low values.
The scripts shows a lot of graphical information:
The close value is shown in light-green. When the close value is lower then the buy value, the close value is shown in light-red. This way it is possible to evaluate the virtual losses during the trade.
the trailing stop value is shown in dark-green. When the sell value is lower then the buy value, the last color of the trade will be red (best viewed when zoomed)(in the example, there are 2 trades that end in gain and 2 in loss (red line at end))
the EMA and SMA values for both buy and sell signals are shown as a line
the buy and sell(close) signals are labeled in blue
How to use this strategy?
Every stock has it's own "DNA", so first thing to do is tune the right parameters to get the best strategy values voor EMA , SMA, Strength for both buy and sell and the Trailing Stop (#ATR).
Look in the strategy tester overview to optimize the values Percent Profitable and Net Profit (using the strategy settings icon, you can increase/decrease the parameters)
Then keep using these parameters for future buy/sell signals only for that particular stock.
Do the same for other stocks.
Important : optimizing these parameters is no guarantee for future winning trades!
Here are the parameters:
Fast EMA Buy: buy trigger when Fast EMA Buy crosses over the Slow SMA Buy value (use values between 10-20)
Slow SMA Buy: buy trigger when Fast EMA Buy crosses over the Slow SMA Buy value (use values between 30-100)
Minimum Buy Strength: minimum upward trend value of the Fast SMA Buy value (directional coefficient)(use values between 0-120)
Fast EMA Sell: sell trigger when Fast EMA Sell crosses under the Slow SMA Sell value (use values between 10-20)
Slow SMA Sell: sell trigger when Fast EMA Sell crosses under the Slow SMA Sell value (use values between 30-100)
Minimum Sell Strength: minimum downward trend value of the Fast SMA Sell value (directional coefficient)(use values between 0-120)
Trailing Stop (#ATR): the trailing stop value as a multiple of the ATR(15) value (use values between 2-20)
Example parameters for different stocks (Start capital: 1000, Order=100% of equity, Period 1/1/2005 to now) compared to the Buy&Hold Strategy(=do nothing):
BEKB(Bekaert): EMA-Buy=12, SMA-Buy=44, Strength-Buy=65, EMA-Sell=12, SMA-Sell=55, Strength-Sell=120, Stop#ATR=20
NetProfit: 996%, #Trades: 6, %Profitable: 83%, Buy&HoldProfit: 78%
BAR(Barco): EMA-Buy=16, SMA-Buy=80, Strength-Buy=44, EMA-Sell=12, SMA-Sell=45, Strength-Sell=82, Stop#ATR=9
NetProfit: 385%, #Trades: 7, %Profitable: 71%, Buy&HoldProfit: 55%
AAPL(Apple): EMA-Buy=12, SMA-Buy=45, Strength-Buy=40, EMA-Sell=19, SMA-Sell=45, Strength-Sell=106, Stop#ATR=8
NetProfit: 6900%, #Trades: 7, %Profitable: 71%, Buy&HoldProfit: 2938%
TNET(Telenet): EMA-Buy=12, SMA-Buy=45, Strength-Buy=27, EMA-Sell=19, SMA-Sell=45, Strength-Sell=70, Stop#ATR=14
NetProfit: 129%, #Trade

Highest/Lowest Channel Multi-Time FramePlots the Highest and Lowest source price for N bars back. Similar to Donchian Channels except any price source can be used (best results: close ). Can be set to any interval independent of the chart interval. Repainting will occur if the chart interval is less than the indicator interval.

HiLoHi Everyone,
Do you guys know how can I add an exit strategy to this hilo.
I would like it to exit either with hilo invertion (already does) or with profit/loss (it doesn't work)
Thank you

Parabolic GlitterThis indicator overlays a series of Parabolic Stop And Reverses (SARs) to continuously illustrate trends as they form in addition to a range of good possible levels at which to place stop orders.
The Initial Start argument gives the minimum value for the SAR function's "Start" argument. The Increment/Start Ratio argument gives the ratio of the SAR function's "Increment" and "Start" arguments (i.e. SAR default is Start = 0.02, Increment = 0.02, therefore Increment/Start Ratio = 1). The same logic applies to the Max/Start Ratio Argument (i.e. SAR default is Start = 0.02, Max = 0.2, therefore Max/Start Ratio = 10).
The Adaptive Coloring argument determines whether the plotting points are red in downtrends and green in uptrends, or if all the plotted points are given the same color (defaults to silver).

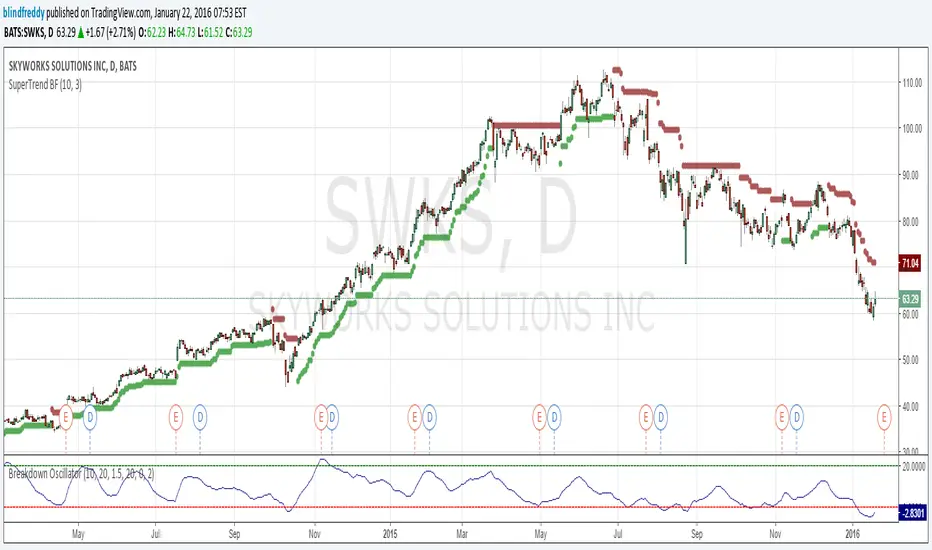
SuperTrend BFI am republishing this indicator as something changed within TradingView's script engine so that the old script ceased to function ( a minor syntax error that used to be acceptable but no longer is).
Anyhow here's the fixed version which as you can see has done a great job of keeping us on the right side of the trend with once-hot stocks like Skyworks !