Buy Monday, Exit Tuesday with Stop Loss and Take ProfitStrategy to go long at end of Monday before market closes and exit before Tuesday close, or at stop loss or take profit percentages
This runs strategy on entering by weekday name and also by session time.
Implemented are also Take Profit and Stop Loss to exit position using custom inputs.
Added stoploss and take profit plot lines
Stoploss

Anna-LysaEspecially useful when using it for stocks in intraday screening for daytrading.
This gives you quick information about the volatility at the moment when you look at the stock.
The current range of the last candles (adjustable) is calculated so that you can stop based on the Vola.
In addition, the daily volume and daily range are calculated in the table and what is left of the average.
So that you can adjust your ideas for the movement in order to take profit. No matter what the timeframe, you can see how the volume compares to that of the previous few candles and thus anticipate the most likely breakout.
Then the most relevant day trading levels ( Premarkets, Lastday high/lows and some Ma´s ) are shown so that you can get a very fast overview of the stock at the moment.
All levels and labels and colors are adjustable or hidden in the settings.

action zone - ATR stop reverse order strategy v0.1 by 9nckACTION ZONE-ATR MOD v0.1 DOCUMENTATION
Overview
This tradingview pine script strategy is mainly created to enrich my coding skill. It is a combination of “CDC-ACTIONZONE” and my personal studies of trading techniques in various sources e.g.book, course or blog. This strategy purposefully built to connect with my automatic trading bot. However, It will be very useful to aid your trading routine by diminishing mental distraction which possibly leads to bad trades.
How does it work?
This strategy will do a basic simple thing that most traders do by creating entry signals on both sides long/short and also set the stop loss. Furthermore, It will also reverse the order (from long to short and vice versa (if long/short conditions are met). Finally, it will recalculate the stop loss/take profit price in every complete bar to increase the chance of winning and limit our loss.
Entry rules(Long/Short)
If you have no open order, an order will be created when a fast EMA crosses(up(long)/down(short) the slow EMA(It’s as simple as that).
If you have an open order, the current order will be (sold if long, covered if short) and the opposite side order will be created.
Exit and Reverse rules(Long/Short)
If fast EMA cross (DOWN(long), UP(short)), the current order will be closed, THE OPPOSITE SIDE ORDER WILL ALSO BE CREATED.
Risk management
FLEX STOP PRICE : initial value will be set at the bar which order created. It is a fast ema (+/-) MIDDLE ATR value.
If MIDDLE ATR value rises, it will be our new stop price.
If MIDDLE ATR value falls, stop price unchanged
If Price OVERBOUGHT(long)/SOLD(short), LOW of that bar will be a new stop price.
Minimum position hold period
In order to eliminate risk of repeatedly open, close orders in sideway trends. Minimum hold period must be passed to start exit our position. However, It always respects stop loss prices. The value refers to the number of bars.
MUST READ!!!
This strategy uses only MARKET ORDER. If you trade with a bot, make sure you choose only enormous market cap tokens.
This strategy is bi-direction strategy. It will work best in the DERIVATIVE market.
It was initially designed to compete in the cryptocurrency market which has very high volume and volatility.
I only use this strategy in 1HR (acceptable change rate, optimum trade frequency)
How (should) we use it?
Choose crypto future pairs (recommend only top 10-15 market volume pairs in Binance, let’s say 1000M+ trade value)
Choose your time frame (1H is strongly recommended)
Setup your portfolio profile (Setting->Properties) such as Initial cap, order size, commission. DO NOT USE CAL ON EVERY TICK IT WILL CAUSE REPAINTING AND YOUR CAPITAL IS BLEEDING !!!
BACKTEST FIRST!! Back test is a combination of art, math and statis(and a bit of luck). You can apply to train and test methods or whatever you are familiar with. In my opinion, your test period should include UPTREND, SIDEWAY, DOWNTREND. Fine tune fast, slow ema first(my best ema length of 1H timeframe around 7-10, 17-22). Try to eliminate fault breakout trade and use other options only necessary. Hopefully we can use automatic optimization on Pine Script soon.
Don’t forget to turn off using a specific backtest date option to start your strategy.A
THIS IS NOT A PERFECT (OR EVEN PROFITABLE) STRATEGY. USE AT YOUR OWN RISK AND TRADE RESPONSIBLY. DYOR DUDE.

SignalsThis script allows you to calculate position size, and future profit, loses.
- You can add 3 target values and 1 stop loss
- Optionally you can display table, position it as you like, and see risk ratio
Plans:
- add profit loss to the labels

Kzx PT mod v1.0 by RX-RAYKzx Position tracker mod v1.0 by RX-RAY
Original script by K-zax
The modification was made for the USDRUB ticker (the number of digits in the values of price, interest, lot volume and profit loss for other tickers may affect the positioning of the inscription, but it is fully operative and it may be used with other tickers )
Typical label view:
74.30 - ENTRY PRICE
+/-0.16% - % of price chang ( range +/-9.99)
20 - position value (range 0-99)
(S) - position type (L) - long (S) - short
+/-0017 - actual profit/loss in cash (range +/- 9999)
(All range value for correct label position,
but script mod can be used out off range)
List of additions and changes:
1. Added display of position value, short / long position type and profit / loss value (including broker commission).
2. Positive interest change now corresponds to profit, negative change in interest to loss in accordance with the type of position ( short/long )
3. The position of the inscription and the digits of the values are fixed and now insignificantly depends on the change in the time interval and the change in the scale of the graph and the change in data values and their signs.
4. Added changing the color of the inscription in the situation positive price change, but profit < commission fee. (critical gain).

Trailing Stop AlertsThis script is designed as an ATR-based trailing stop tool to assist in managing open positions.
Once you're involved in a profitable trade, if you add this script to your chart you'll be prompted to select a bar to begin trailing from.
You can then adjust the candle lookback distance for swing high/lows (7 by default), the ATR multiplier (1.0 by default), and the direction to trail (Long/Short).
You can also adjust the ATR period in the settings menu if you want to (14 period by default).
Once the script is added to your chart, it will begin drawing your trailing stop and you can then set up alerts.
Alert Options:
Any alert() function call : Will trigger an alert for both conditions (trailing stop updated, trailing stop hit)
Alert Conditions : Trailing Stop Update will trigger whenever the stop is updated, Trailing Stop Hit will trigger whenever the stop is hit.
Note: the alerts will only fire once per bar close and the trailing stop will not update on realtime bars.

Trailing StopMost of the trailing stops on TradingView are made of using the lowest lows and the highest highs. Not many are based around what I called the volatile trailing stop.
This is where the trailing stop will move around according to a set percentage difference from the previous closing value. This allows you to say "If the current bar moves x percent, then stop". The script I've made here is a simple version of that with a few options for smoothing and setting the percent change.
Disclaimer: This is not financial advice, please do your own research before making any decisions.

Gain/StopLoss Percentage LinesGain/StopLoss Percentage Lines is a quick way to enter your Entry Price in to a stock and track the percentage of gain or loss at the 5% and 10% markers.
Click on the gear settings icon and type in your entry price. The percentage is defaulted to 5%. You can change this to a different percentage at this screen. Note that whatever number you enter will be doubled for the upper and lower lines. For instance, if you want to set your first red line stop loss and green gain line at 2.5%, your two other upper and lower green and red lines will be at 5%.
However, this will not change the text on the tab marker.
To change the tab text, go in to the Pine Editor and change the green text that says "5% Gain" and "5% Loss" to your new percentages.

%-[Guz] Vortex Indicator Custom// Custom Vortex Strategy (backtester)
// Custom version of the Vortex indicators that adds many features:
// -Triggers trades after a threshold is reached instead of the normal vortex lines cross (once the difference between the 2 lines is important enough)
// -Smooths the Vortex lines with an EMA
// -Adds Take Profit and Stop Loss selection
// -Adds the possibility to go Long only, Short only or both of them
// ! notice that it uses 10% position size and 0.04% trade fee, found on some crypto exchanges futures contracts
// Allows testing leverage with position size modification (values above 100% position size, to be done with caution)
// Not an investment advice

PSAR + EMA/TEMA/RSI/OBVThe Parabolic Stop-and-Reservse (PSAR) is a trend indicator, intended to capture reversal signals and show entry and exit points. The PSAR is bullish when the PSAR is below the candle body (usually indicated by a dot) and bearish when the PSAR is above the candle body. The PSAR generally only moves in the direction of the trend, making it useful for markets with an upward or downward trend, as well as swing markets. It is weaker when the market it sideways, as it can be prone to frequent flips (bull-to-bear or vice versa) in markets where a predominant trend is not present.
In order to combat the tendency for rapid swings in the PSAR, it is commonly paired with a second indicator. Often, this is a moving average (MA) to confirm the PSAR signal. Here is a common example:
PSAR + 2 EMAs: A trade would consider entering long when the PSAR is bullish and the fast EMA is above the short EMA.
PSAR + 3 EMAs: As above, but the trader could also add a very long EMA (200, for example) and use that as an additional filter.
In addition to using EMA, other MAs can be used and may be more appropriate to certain instruments and timeframes. Using TEMA, for example, may result in less lag but introduce more noise. Likewise, the Ehler's MAMA is an option.
Some traders use other indicators as PSAR confirmation signals, such as the relative strength index (RSI) on on-balance volume (OBV). The strategy is similar:
bullish PSAR + RSI oversold = consider long entry
bullish PSAR + OBV oscillator > 0 = consider long entry
The strategy presented here is based on my PSAR + EMA + TEMA study. Any of the above strategies are supported by this script:
1. The PSAR is the primary signal.
2. Confirmation is provided by any of the following: EMA , TEMA , Ehler's MAMA , RSI , or OBV.
3. You may use a third EMA (set to 200 as the default) to filter entries -- if used, the strategy will only show signals if the price is above the third (additional) EMA .
For example, a normal long signal would be a bullish PSAR + fast EMA > slow EMA + price > ema 200.
In addition, you may use a SL, which is set to the PSAR dots shown. You may also limit the backtesting dates. (Please note in the chart above, I do not have a limit on the trading dates. I believe this exaggerates the success of the strategy, but the house rules demand I not limit the timeframe to show you a more accurate picture.)

Strategy TemplateThis is the fastest way to create a Trading View strategy. The template I have created includes stoploss and take profit enabling and plotting, date range, and strategy buy and sell conditions. I believe this will benefit the people in the Trading View community by creating a strategy faster and more efficiently than just repeating pine script code. All that needs to be done by the person using this script is to add their own indicators, and create their own buy and sell signals. Then they can immediately start back testing their new strategy!
vol_signalNote: This description is copied from the script comments. Please refer to the comments and release notes for updated information, as I am unable to edit and update this description.
----------
USAGE
This script gives signals based on a volatility forecast, e.g. for a stop
loss. It is a simplified version of my other script "trend_vol_forecast", which incorporates a trend following system and measures performance. The "X" labels indicate when the price touches (exceeds) a forecast. The signal occurs when price crosses "fcst_up" or "fcst_down".
There are only three parameters:
- volatility window: this is the number of periods (bars) used in the
historical volatility calculation. smaller number = reacts more
quickly to changes, but is a "noisier" signal.
- forecast periods: the number of periods for projecting a volatility
forecast. for example, "21" on a daily chart means the plots will
show the forecast from 21 days ago.
- forecast stdev: the number of standard deviations in the forecast.
for example, "2" means that price is expected to remain within
the forecast plot ~95% of the time. A higher number produces a
wider forecast.
The output table shows:
- realized vol: the volatility over the previous N periods, where N =
"volatility window".
- forecast vol: the realized volatility from N periods ago, where N =
"forecast periods"
- up/down fcst (level): the price level of the forecast for the next
N bars, where N = "forecast periods".
- up/down fcst (%): the difference between the current and forecast
price, expressed as a whole number percentage.
The plots show:
- blue/red plot: the upper/lower forecast from "forecast periods" ago.
- blue/red line: the upper/lower forecast for the next
"forecast periods".
- red/blue labels: an "X" where the price touched the forecast from
"forecast periods" ago.
+ NOTE: pinescript only draws a limited number of labels.
They will not appear very far into the past.

3Commas BotBjorgum 3Commas Bot
A strategy in a box to get you started today
With 3rd party API providers growing in popularity, many are turning to automating their strategies on their favorite assets. With so many options and layers of customization possible, TradingView offers a place no better for young or even experienced coders to build a platform from to meet these needs. 3Commas has offered easy access with straight forward TradingView compatibility. Before long many have their brokers hooked up and are ready to send their alerts (or perhaps they have been trying with mixed success for some time now) only they realize there might just be a little bit more to building a strategy that they are comfortable letting out of their sight to trade their money while they eat, sleep, etc. Many may have ideas for entry criteria they are excited to try, but further questions arise... "What about risk mitigation?" "How can I set stop or limit orders?" "Is there not some basic shell of a strategy that has laid some of this out for me to get me going?"
Well now there is just that. This strategy is meant for those that have begun to delve into the world of algorithmic trading providing a template that offers risk defined positions complete with stops, limit orders, and even trailing stops should one so choose to employ any of these criteria. It provides a framework that is easily manipulated (with some basic working knowledge of pine coding) to encompass ones own ideas and entry criteria, while also providing an already functioning strategy.
The default settings have a basic 1:1 risk to reward ratio, which sets a limit and a stop equal distance from the entry. The entry is a simple MA cross (up for long, down for short). There a variety of MA's to choose from and the user can define the lengths of the averages. The ratio can be adjusted from the menu along with a volatility based adder (ATR) that helps to distance a stop from support or resistance. These values are calculated off the swing low/high of the user defined lookback period. Risk is calculated from position entry to stop, and projected upwards to the limit as a function of the desired risk to reward ratio. Of note: the default settings include 0.05% commissions. Competitive commissions of the leading cryptocurrency exchanges are .1% round trip (one buy and one sell) for market orders. There is also some slippage to allow time for alerts to be sent and orders to fill giving the back test results a more accurate representation of real time conditions. Its recommended to research the going rates for your exchange and set them to default for the strategy you use or build.
To get started a user would:
1) Make a copy of the code and paste in their bot keys in the area provided under the "3Comma Keys" section
- eg. Long bot "start deal" copied from 3commas in to define "Long" etc. (code is commented)
2) Place alert on desired asset with desired settings ensuring to select "Order fills and alert() function calls"
3) Paste webhook into the webhook box and select webhook URL alerts (3rd party provided webhook)
3) Delete contents of alert message box and replace with {{strategy.order.alert_message}} and nothing else
- the codes will be sent to the webhook appropriately as the strategy enters and exits positions. Only 1 alert is needed
settings used for the display image:
1hr chart on BTCUSD
-ATR stop
-Risk adjustment 1.2
-ATR multiplier 1.3
-RnR 0.6
-MAs HEMA/SMA
-MA Length 50/100
-Order size percent of equity
-Trail trigger 60% of target
Experiment with your own settings on your crypto of choice or implement your own code!
Implementing your trailing stop (optional)
Among the options for possible settings is a trailing stop. This stop will ratchet higher once triggered as a function of the Average True Range (ATR). There is a variable level to choose where the user would like to begin trailing the stop during the trade. The level can be assigned with a decimal between 0 and 1 (eg. 0.5 = 50% of the distance between entry and the target which must be exceeded before the trail triggers to begin). This can allow for some dips to occur during the trade possibly keeping you in the trade for longer, while potentially reducing risk of drawdown over time. The default for this setting is 0 meaning unless adjusted, the trail will trigger on entry if the trailing stop exit method is selected. An example can be seen below:
Again, optional as well is the choice to implement a limit order. If one were to select a trailing stop they could choose not to set a limit, which could allow a trail to run further until hit. Drawdowns of this strategy would be foregoing locking gains at highs on target on other trades. This is a trade-off the user can decide on and test. An example of this working in favor can be observed below:
Conclusion
Although a simple strategy is implemented here, the benefits of this script allow a user a starting platform to build their strategies from with built in risk mitigation. This allows the user to sidestep some of the potential difficulties' that can arise while learning Pine and taking on the endeavor of automating their trading strategies. It is meant as an aid, a structure, and an educational piece that can be seen as a "pick-up-and-go" strategy with easy 3Commas compatibility. Additionally, this can help users become more comfortable with strategy alert messages and sending strings in the form of alerts from Pine. As well, FAQs are often littered with questions regarding "strategy.exit" calls, how to implement stops. how to properly set a trailing stop based on ATR, and more. The time this can save an individual to get started is likely of the best "take-aways" here.
Happy trading

trend_vol_stopThe description below is copied from the script's comments. Because TradingView does not allow me to edit this description, please refer to the script's comments section, as well as the release notes, for the most up-to-date information.
----------
Usage:
The inputs define the trend and the volatility stop.
Trend:
The trend is defined by a moving average crossover. When the short
(or fast) moving average is above the long (slow) moving average, the
trend is up. Otherwise, the trend is down. The inputs are:
long: the number of periods in the long/slow moving average.
short: the number of periods in the short/fast moving average.
The slow moving average is shown in various colors (see explanation
below. The fast moving average is a faint blue.
Volatility stop:
The volatility stop has two modes, percentage and rank. The percentage
stop is given in terms of annualized volatility. The rank stop is given
in terms of percentile.
stop_pct and stop_rank are initialized with "-1". You need to set one of
these to the values you want after adding the indicator to your chart.
This is the only setting that requires your input.
mode: choose "rank" for a rank stop, "percentage" for a percentage stop.
vol_window: the number of periods in the historical volatility
calculation. e.g. "30" means the volatility will be a weighted
average of the previous 30 periods. applies to both types of stop.
stop_pct: the volatility limit, annualized. for example, "50" means
that the trend will not be followed when historical volatility rises
above 50%.
stop_rank: the trend will not be followed when the volatility is in the
N-th percentile. for example, "75" means the trend will not be
followed when the current historical volatility is greater than 75%
of previous volatilities.
rank_window: the number of periods in the rank percentile calculation.
for example, if rank_window is "252" and "stop_rank" is "80", the
trend will not be followed when current historical volatility is
greater than 80% of the previous 252 historical volatilities.
Outputs:
The outputs include moving averages, to visually identify the trend,
a volatility table, and a performance table.
Moving averages:
The slow moving average is colored green in an uptrend, red in a
downtrend, and black when the volatility stop is in place.
Volatility table:
The volatility table gives the current historical volatility, annualized
and expressed as a whole number percentage. E.g. "65" means the
instrument's one standard deviation annual move is 65% of its price.
The current rank is expressed, also as a whole number percentage. E.g.
"15" means the current volatility is greater than 15% of previous
volatilities. For convenience, the volatilities corresponding to the
0, 25, 50, 75, and 100th percentiles are also shown.
Performance table:
The performance table shows the current strategy's performance versus
buy-and-hold. If the trend is up, the instrument's return for that
period is added to the strategy's return, because the strategy is long.
If the trend is down, the negative return is added, because the strategy
is short. If the volatility stop is in (the slow moving average is
black), that period's return is excluded from the strategy returns.
Every period's return is added to the buy-and-hold returns.
The table shows the average return, the standard deviation of returns,
and the sharpe ratio (average return / standard deviation of returns).
All figures are expressed as per-period, whole number percentages.
For exmaple, "0.1" in the mean column on a daily chart means a
0.1% daily return.
The number of periods (samples) for each strategy is also shown.

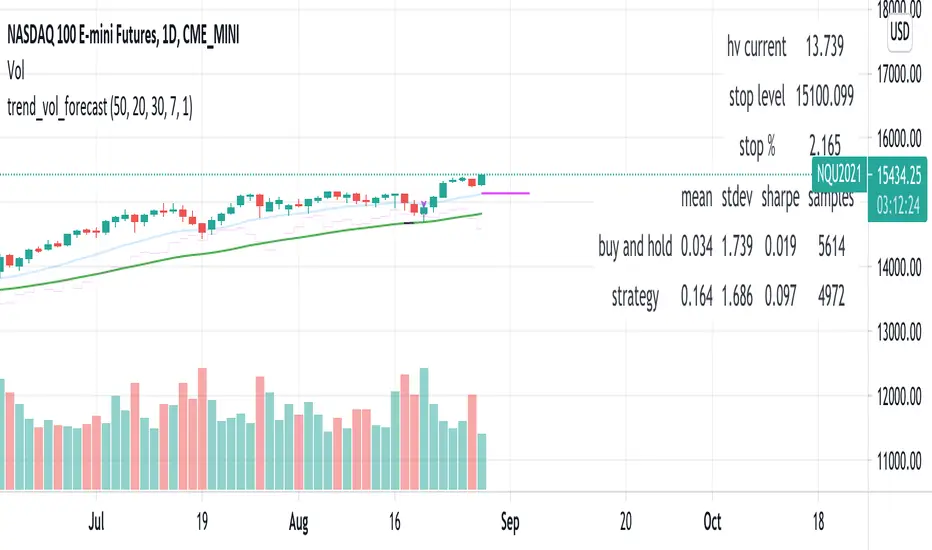
trend_vol_forecastNote: The following description is copied from the script's comments. Since TradingView does not allow me to edit this description, please refer to the comments and release notes for the most up-to-date information.
-----------
USAGE
This script compares trend trading with a volatility stop to "buy and hold".
Trades are taken with the trend, except when price exceeds a volatility
forecast. The trend is defined by a moving average crossover. The forecast
is based on projecting future volatility from historical volatility.
The trend is defined by two parameters:
- long: the length of a long ("slow") moving average.
- short: the length of a short ("fast") moving average.
The trend is up when the short moving average is above the long. Otherwise
it is down.
The volatility stop is defined by three parameters:
- volatility window: determines the number of periods in the historical
volatility calculation. More periods means a slower (smoother)
estimate of historical volatility.
- stop forecast periods: the number of periods in the volatility
forecast. For example, "7" on a daily chart means that the volatility
will be forecasted with a one week lag.
- stop forecast stdev: the number of standard deviations in the stop
forecast. For example, "2" means two standard deviations.
EXAMPLE
The default parameters are:
- long: 50
- short: 20
- volatility window: 30
- stop forecast periods: 7
- stop forecast standard deviations: 1
The trend will be up when the 20 period moving average is above the 50
period moving average. On each bar, the historical volatility will be
calculated from the previous 30 bars. If the historical volatility is 0.65
(65%), then a forecast will be drawn as a fuchsia line, subtracting
0.65 * sqrt(7 / 365) from the closing price. If price at any point falls
below the forecast, the volatility stop is in place, and the trend is
negated.
OUTPUTS
Plots:
- The trend is shown by painting the slow moving average green (up), red
(down), or black (none; volatility stop).
- The fast moving average is shown in faint blue
- The previous volatility forecasts are shown in faint fuchsia
- The current volatility forecast is shown as a fuchsia line, projecting
into the future as far as it is valid.
Tables:
- The current historical volatility is given in the top right corner, as a
whole number percentage.
- The performance table shows the mean, standard deviation, and sharpe
ratio of the volatility stop trend strategy, as well as buy and hold.
If the trend is up, each period's return is added to the sample (the
strategy is long). If the trend is down, the inverse of each period's
return is added to the sample (the strategy is short). If there is no
trend (the volatility stop is active), the period's return is excluded
from the sample. Every period is added to the buy-and-hold strategy's
sample. The total number of periods in each sample is also shown.
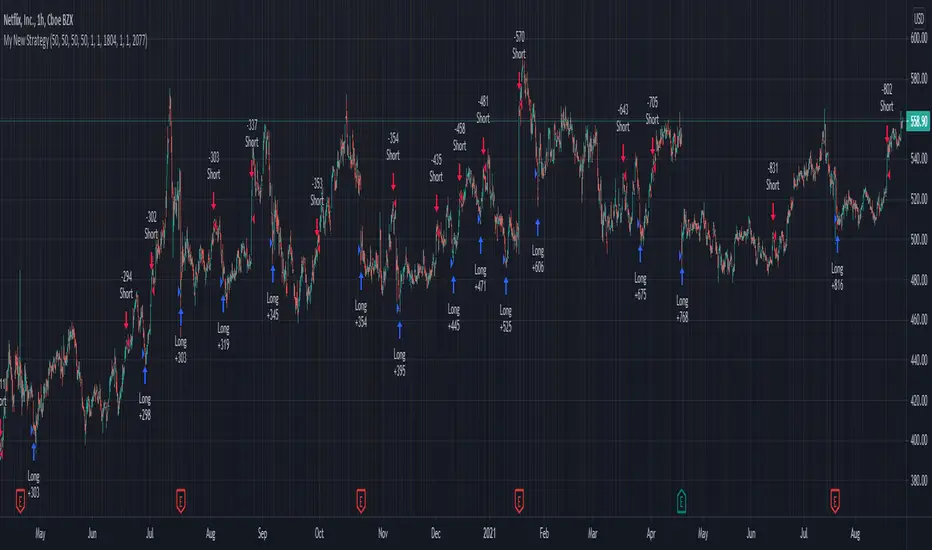
Moving Stop-Loss mechanism + alerts to MT4/MT5"How to code moving stop-loss mechanism", is one of the most often repeating questions in private messages I receive, so just to focus on this mechanism, I made a spin-off from my previous script: TradingView-Alerts-to-MT4-MT5-dynamic-variables-NON-REPAINTING .
The logic here moves the stop-loss each time a trade is running and a new pivot high/low is detected. When such event occurs (UpdateLongStopLoss or UpdateShortStopLoss), stoploss_long or stoploss_short mutable variable is modified. And it needs to be coded inside strategy.exit() line as "stop=stoploss_long" or "stop=stoploss_short". Entries are pretty straightforward - on Stoch crosses.
Last lines of the script show how to wrap information about such updates and send send alerts to MetaTrader via TradingConnector for execution in Forex/indices/commodities/crypto markets via MetaTrader. Please note that "tradeid=" variable must be passed with each alert, to let MetaTrader know which trade to modify. SLMOD, TPMOD are recently added commands, along with BE (as in "move stop-loss to breakeven" - but that's another topic).
Please disregard strategy backtest results, as this script is for coding education purposes only. However, it seems with the stop-loss mechanism enabled, the results are even better, than in original version of the script :)

money managementthis indicator has been designed to make your calculations easier and faster.
you can use this indicator to set tp and sl prices based on your entry price, balance,risk and leverage.
it has been designed only for cryptocurrency market and it is not recommended to use it in other markets!
1- enter your balance in the setting of the indicator.
2- enter risk percentage of your balance.
3- enter your sl percentage.
4- enter your tp percentage.
5- set your leverage if you are trading in futures market.
6- and at last set your entry price.
your position size both in spot market and futures market and the exact price of tp and sl , will be shown top right of the screen.
caution: before using this indicator in real market, please make sure that you understand this indicator's behavior and test it.
--------------------------------------------------------------------
این اندیکاتور برای تسریع محاسبات مدیریت سرمایه و سهولت رعایت آن طراحی شده است.
شما میتوانید با وارد کردن پارامترهاقیمت ورودی، سرمایه کل، ریسک و اهرم، قیمت حد سود و ضرر خود را محاسبه کنید.
همچنین اندازه حجم معاملات شما توسط این اندیکاتور محاسبه خواهد شد.
این اندیکاتور برای بازار کریپتوکارنسی طراحی شده است و استفاده از آن در سایر بازارها پیشنهاد نمیشود.
از بخش تنظیمات اندیکاتورمراحل زیر را انجام دهید:
1- میزان سرمایه خود را در قسمت بالانس وارد کنید
2- میزان ریسک سرمایه در هر معامله را مشخص کنید (به درصد)
3- میزان حد ضرر خود را مشخص کنید (به درصد)
4- میزان حد سود خود را مشخص کنید (به درصد)
5- عدد اهرم خود را وارد کنید
6- قیمت ورود به معامله را وارد کنید
توجه: قبل از استفاده این اندیکاتور در بازار لایو لطفا آن را تست کنید و از کارکرد صحیح آن با مدیریت سرمایه خود اطمینان حاصل فرمایید.

ATR Stop Loss FinderThis Indicator uses Average True Range (ATR) to determine a safe place to put stop losses to avoid being stop hunted or stopped out of a trade due to a tight stop loss. Default multiplier setting is 1.5. For a more conservative stop loss use 2 and for a tighter stop loss use 1. ATR and stop loss prices are displayed in table at bottom of screen. Use high(red) for shorts and low(teal) for longs.

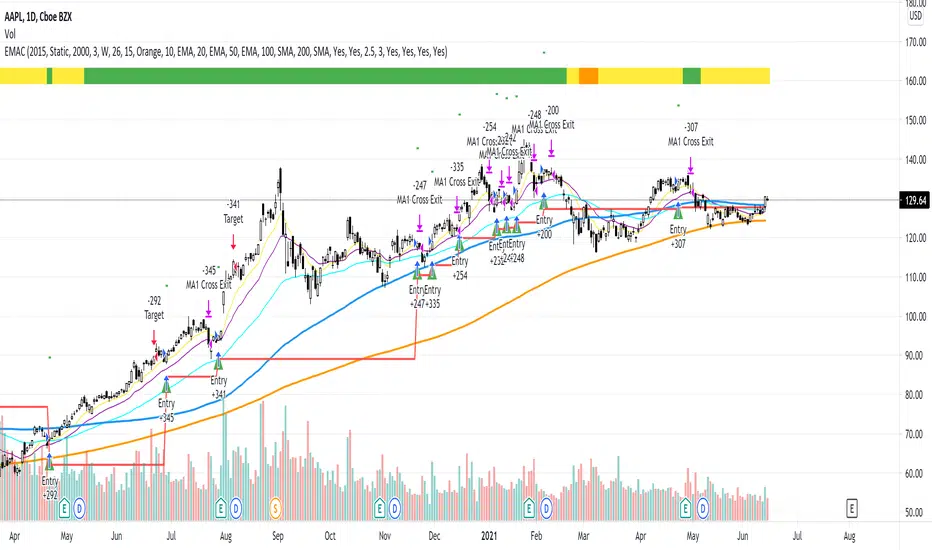
EMAC - Exponential Moving Average CrossEMAC - Exponential Moving Average Cross
This strategy is based in part on original 10ema Basic Swing Trade Strategy by Matt Delong: www.tradingview.com
Link to original 10ema Basic Swing Trade Strategy:
This is the Original EMAC - Exponential Moving Average Cross strategy built as a class for reallifetrading dot com and so has all the default settings and has not been optimized. I would not recommend using this strategy with the default settings and is for educational purposes only. For the fully optimized version please come back around the same time tomorrow 6/16/21 for the EMAC - Exponential Moving Average Cross - Optimized
If you have any questions feel free to reach out to me with a comment and I will try to get back to you quickly with a reply.
Relative VolumeVolume can be a very useful tool if used correctly. Relative volume is designed to filter out the noise and highlight anomalies assisting traders in tracking institutional movements. This tool can be used to identify stop loss hunters and organized dumps. It uses a variety of moving averages to hide usual activity and features an LSMA line to show trend. Trend columns are shown to highlight activity and can be seen at bottom of the volume columns, this is done using ZLSMA and LSMA.
The above chart shows an example of 2 indicators being used on the 15 min chart. The bottom indicator is set to the 1 min chart. Traders can see a large dump on the 1 min chart as institutions wipe out any tight stop losses. Next they buy back in scooping up all those long positions.
This is an example layout using a split screen setup and multiple timeframes ranging from 1 min to 30 mins. This gives a clear indication of trends and make it easy to pickup on institutional behaviour. Tip: Double clicking indicator background will maximize RVOL to the split screen window.

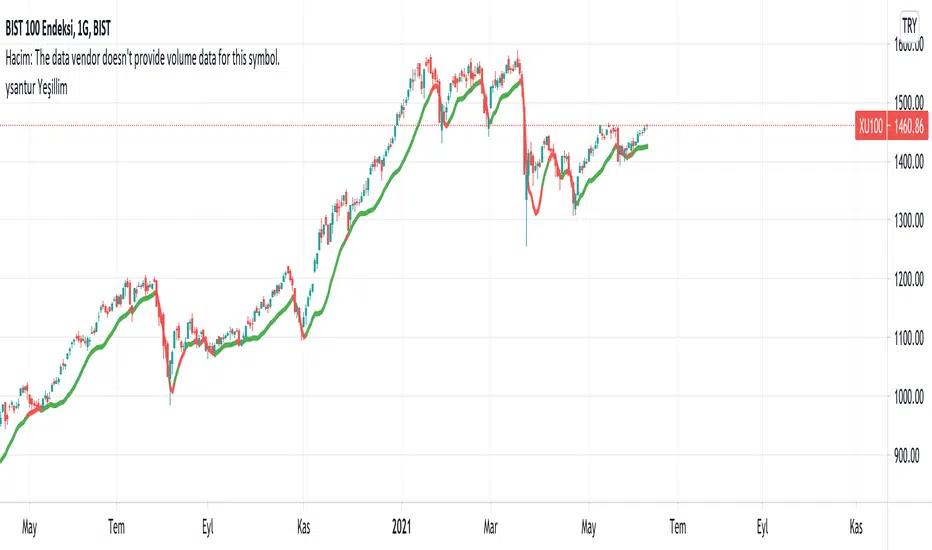
YesillimThe "Yesillim" indicator is a trend follower and trailing stop indicator that reacts quickly and aims to enter early in an uptrend and exit early from a downtrend. Since moving averages are used, it can be used in daytrade and scalping in daily or lower periods. The crossover and crossdown intersections of the price and the indicator line may be meaningful, but it is actually a color changing indicator and color changes should be interpreted. The bullish market gains strength when the color turns green, and the bearish market when it turns red. When prices get too far from the indicator, they are approaching again, in this case, it may be support will work like resistance according to the current trend. Like any indicator, it is possible to produce false signals in the horizontal market, so it should not be used alone, the oscillator and volume should support the current trend. In strong trend changes, angle changes in the indicator can also be interpreted manually. In this case, sharp angled turns indicate a sharp trend change. Technically customized weighted moving average weights are specially weighted with golden ratio coefficients, smoothed with a lower period for noise removal with the same principle and added bias. I wish it to be used in profitable transactions.
Turkish (Türkçe): Yeşillim indikatörü bir trend izleme ve hareketli iz süren indikatördür. Son barları agresif olarak ağırlıklandırdığı için var olan bir yükseliş trendine erken sokup, düşüş trendinden erken çıkarması olasıdır. İndikatör yorumlanırken fiyat ve indikatör kesişimleri anlamlı olsada (yükseliş düşüş trendlerinde destek-direnç görevi görebilecektir) ancak asıl amaç renk değişimi yorumlanmalıdır, yeşil yükseliş trendinin, kırmızı ise düşüş trendinin güç kazandığını göstermektedir. Her indikatör gibi yatay piyasada hatalı sonuçlar üretebilir, bu nedenle rsi, sokastik gibi bir osilatörle desteklenmesi hacimin mevcut trendi desteklemesi gerekmektedir. Kazançlı işlemlerde kullanılmasını temenni ederim.
EMA+RSI Pump & Drop Swing Sniper (SL+TP) - StrategyThis is the strategy version of the 'EMA-RSI-Pump-Drop-Swing-Sniper-With-Alerts':
Some additions with this strategy:
~Added Stop loss & Take profit control. In Settings > Inputs if the Stop Loss is at .051 that means it's 5.1% and the Take Profit at .096 is 9.6%. If you wish to remove the TP and SL just change the value to 1.00 and it would be the same as it being 100% TP and SL which is likely to never be hit.
~Added Backtesting by changing the month/date/year in Settings > Inputs
~Added a 2nd EMA line to assist with the long entry signals. I only use this for long entry & exits, though you could use the long exits as Short entries too. I just personally don't do short trading on Bitcoin.
This is using an EMA and RSI with slightly modified settings to give good entry and exit points while looking at Bitcoin. I use this on a 1-hour and 4-hour chart and with other indicators to find good positions to enter a trade or exit if things are turning red.
It's important to know this strategy was made as a request by another user that was using the indicator version. I don't use this as a trading strategy by itself, I use the visuals it gives as a confirmation with other indicators to find the best possible entry and exit positions.
If you click on the EMA line it will color the bars of the chart based on if they are above or below the EMA - This is just visually helpful for me to see the active trend.
Make sure you hover over or click on the EMA line to see the colors of the candles change - it's not visible by default or without doing this.

Safe Scalpy Stop Loss. Percentage from price visualizer.This is my first script I have published so bear with me.
I have thrown this together so you can easily see on the chart where -0.5%, -1% and -2% would be from the last candle close. I also replicated these to show positive values in case you are shorting.
I have also added a custom value setting so you can set the line at whatever percentage value you like and included an adjustable recent higher high and higher low finder to help create a recent range as it seems to work well in tandem for scalping range based price movement.
You can turn all these things on and off in the settings on the style checkboxes.
I felt the need to make this because I like to scalp trade with leverage like a total degen from time to time. Often the setups happen very quickly. It is difficult to calculate where to set a stop loss in a hurry so I keep a fixed account size/lev and just vary the position percentage size based on the percentage of the stop loss from the current price.
Sometimes when switching from a lower volatility chart to high volatility one it is easy to get caught out by quickly entering a scalp trade only to find you made your position way too big or you shouldn't have entered at all. You thought it was only moving 0.2% per candle instead of 3%. Whoops. Rekt.
This indicator is all about trying to help me avoid that with a visual clue to back up the bad maths I do quickly in my head.
I often hide it and only show it when I'm ready to enter a position to double check my SL and entry are set in a sensible area.
I thought I would publish it in case someone else finds such a simple tool handy.
Apologies if there is already something out there that does this job. I couldn't find it.
See you all on the moon.
