CM_Williams_Vix_Fix - Market Top and Bottom with multi-timeframeThis is a modification of CM_Williams_Vix_Fix indicator to include both market tops and bottoms with multi-timeframe support. The original indicator only finds market bottoms.
All credits go to the original author ChrisMoody.
Original script link
Working:
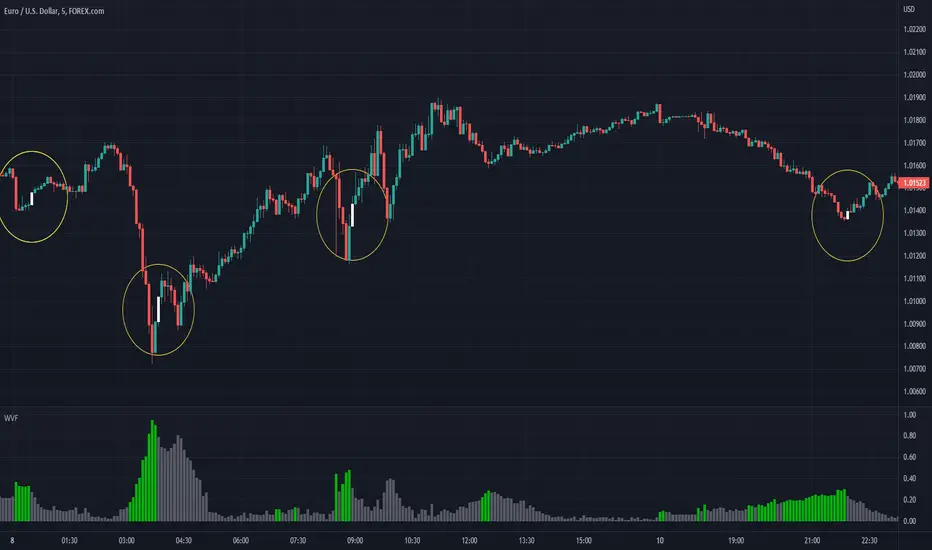
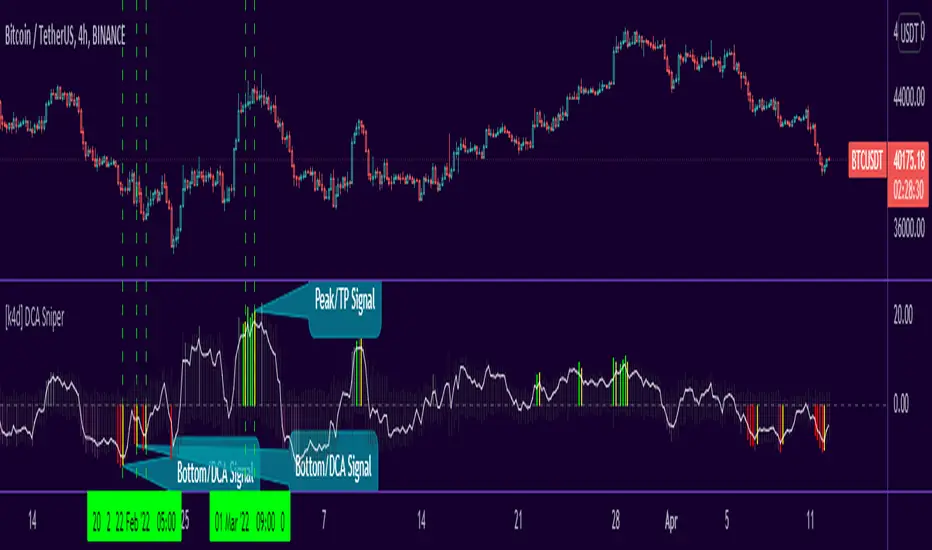
The histogram above 0 signifies the trend of market going UP and the histogram below 0 signifies the trend of market going DOWN.
The histogram bar is calculated using "LookBack Period Standard Deviation High" number of candles. A threshold is calculated using bollinger bands and based on percentile of "Look Back Period Percentile High" number of candles.
If the histogram bar above 0 crosses the up threshold then we have market top which is signified by histogram bar having the color green. If the histogram bar below 0 crosses the down threshold then we have market bottom which is signified by histogram bar having the color red.
The market tops and bottoms can also be calculated across multiple timeframes.
Sample usage:
Suppose the market is in an uptrend and the indicator displays red market bottom bar, this might be an indication that the market has reached the end of a pullback. We can use additional indicators like stochastic or rsi to get additional confluence.
This indicator does not repaint but you need to wait for the candle to close.
TOP
Daily Manual KILLZONESThis indicator is to be used with "KILLSTATS", our indicator allowing to backtest on hundreds of days at which time, and which day the top/low of the day and week is formed.
"Manual Killzone" allows to define our statistical killzones by day of the week manually: you define your own rules according to your interpretation of our Killstats indicator.
It integrates a daily price action filter according to the ICT concept:
It will only display bullish probabilities (green) defined if and only if we are in discount and out of the daily range 25/75%.
Same for bearish probabilities (red)
The blue color is to be applied in case of reversal with high contradictory probability (Example: to be used for Tuesday from 2pm to 3pm, if Tuesday is a day with high probability to form a top, but 2pm/15pm is the time with high probability to form a bottom AND a top. Indecision => blue)
WARNING : Calculated according to Etc/UTC time : put "0" in the Timezone parameter of killstats.
It is necessary to use the replay mode regularly during the backtesting to update the data!
Boom Hunter XBoom Hunter X is built to target breakouts and explosive moves. The strength of this indicator is in slower timeframes like daily, weekly and monthly but it also works great on 4 hour timeframes. It is a modified version of Boom Hunter XL designed to be simple and easy to use. There are minimal settings available, aside from being able to choose the length of the oscillator there are 3 presets available. Preset 1 is the fastest and is great for targeting entries. Preset 3 is the slowest and is perfect for highlighting trends and setting up big moves. Preset 2 is somewhere in the middle and works great for entries and trend. To get a full picture of price action it is recommended to use all three indicators on your chart. The indicator will automatically adjust lengths when using weekly and monthly charts. If using faster timeframes try adjust the length to 6 or 9.
To get best results use Preset 3 to identify the trend of price action. When Preset 3 is in teal look for long entries on Presets 1 and 2. Likewise, when in red look for shorts. The best entries come from the first pullbacks. Below is an example of entering with the trend.
Using slow charts like weekly and monthly makes it easy to see what is happening with the markets. Below is an example of how easy it is to stay ahead of the curve and identify booms.
First pullbacks are signalled with outlined triangles: ▵▿
These signals are only available on preset 2 and 3. First pullbacks are picked up after price action breaks its median or dynamic median also known as OSC3 (OSC3 is hidden and works in the background), The strongest long pullbacks are when the oscillator is above the median and in the teal. Likewise the strongest short entries are when the oscillator is below the median and in the red. First pullback signals often signal the start of a new trend. Below is an example on a daily chart.
Breaks in support and resistance are signalled with white arrows: ˰˅
Preset 3 highlights the biggest breakouts while preset 1 will show the breaks within the breaks. Preset 2 provides a nice blend between the both and works great for targeting breakouts. It is not recommended to enter on the break as price action will come back to test. The first pullback after the break is typically the best and safest entry for breakouts. Below is an example of the break signal using preset 2 on weekly chart.
Breakout entries are signalled with teal and red triangles. Breakout signals filter price action for safe confirmed pullback entries. The slower the timeframe the bigger the breakout. Presets 2 and 3 are best for finding these entries.
Booms are signalled with this explosive icon: 💥
Simply put booms are polarity flips within the ticker signal. They are fast and explosive moves that can be detected using several different methods. Some of these boom signals are picked up using pure chart mechanics while others use filtering and signal processing to pinpoint the exact moment before an explosion. To make big moves the charts have to set it up first. Below is an example on a daily chart.
Boom Hunter X comes with the following alerts:
Overbought - Reversal attempt
Oversold - Reversal attempt
Long First Pullback - Only available on Preset 2 and 3
Short First Pullback - Only available on Preset 2 and 3
Pivot Up - Oscillator crosses over trigger
Pivot Down - Oscillator crosses under trigger
Long Breakout - Entry point for breakout
Short Breakout - Entry point for breakout
Break Support - Price action breaks its support
Break Resistance - Price action breaks its resistance
Boom! - Alerts for all the booms
Crossing Over Median - Price action enters top half of channel
Crossing Under Median - Price action enters bottom half of channel
TradingWolf Premium PatternsThe TradingWolf Premium is a one of a kind indicator which can identify charting patterns unlike any others. Standard Chart patterns take 10+ candles to recognise where as ares are almost instant without repainting!
Within this one indicator you will have access to Break Out Levels , Dynamic Support and resistance, Bull Flag, Bear Flag, Rising Wedge, Falling Wedge, Inverse Head & Shoulders, Head & Shoulders, Double Top, Double Bottom, Trend Lines, Ascending Triangle, Descending Triangle, Parallel Channel & Linear Regression Channels.
Below each indicator is explained along with its enhancements to help you understand it better.
This script comes with the 'TradingWolf Premium' to get access, read the Author’s Instructions below.
There are extensive explanations on how to use this indicator in our documentation on the website but we will give a simple overview here.
Break Out Levels
Break out levels are great for breakout traders, this indicator is scanning for strong points of support & resistance, it does this by finding pivot points where price has had a noticeable pull back. From there it will monitor that level and display a signal soon as price breaks it.
Another use case for this indicator is helping identify the market structure direction. If we are breaking up and getting Green triangles, this suggests we are in a bullish up-trending structure and vice versa for red bearish signals.
Support & Resistance
There are lots of ways of deciding how to mark up support and resistance, we like to use ATR values related to daily price action. Marking levels up on lower timeframes tend not to give such good levels to play whereas calculating values from the Higher time frames gives us levels we know are more like to be respected.
Although they are calculated from the daily timeframe you will notice these levels will adjust to the daily price action to make sure they are keeping up to date on levels you need to keep an eye on.
Flags
Flags show signs of continuation, they are confirmed when price breaks the upper resistance for bull flags and lower support for bear flags. They are commonly used in trading but with this indicator, it will help you spot ones you may normally miss. Everyone judges flags differently so we have given you the ability to decide how strict you would like the flags to be with the correlation setting, if you set it to 100% the top and bottom lines of the flag must be going at the exact same angle to count as a valid flag.
Wedges
A wedge pattern is typically a reversal pattern, you would normally use these in correlation with volume. For a confirmed wedge you want declining volume as the price reaches the wedge end. You can either try entering at the top/bottom of the wedge pattern or wait until price breaks into the opposite trending direction.
Head & Shoulders
These are reversal patterns, for a confirmed Head and shoulder pattern you want to pair it with declining volume or momentum
You will notice you have a HF option, when enabled this will scan multiple different lengths of pivots to try spot more patterns which the regular settings may miss. If you think you are getting enough you may want to disable this.
Triangles
Triangles help us identify areas where price starts consolidating in a narrow range, once we reach roughly ¾ of the way through the triangle, we will see a break out in either direction, normally confirmation just requires 1 close out of the triangle along with increased volume. If you miss the initial move you may be able to catch a retest if you are lucky!
Double Tops & Bottoms
These patterns are considered reversal patterns. They are confirmed on the break of the neck line with increased volume.
Trend Lines
These are as simple as the name suggests, the lines are calculated slightly differently to other support and resistance points but they will work the same spotting potential areas where price will bounce or reject.
Channels
Similar to Trend lines but these are looking for trend lines at the same angle forming channels where price tends to range between. You have several options to edit these in the settings including the correlation % of the channel lines, how many candles are allowed outside of the channel (fake outs), sensitivity/ frequency the channels appear and whether you use the Wicks or candle Closes to determine where to calculate the channels from.
Linear Regression Channels
Linear regression is the analysis of two separate variables to define a single relationship and is a useful measure from a technical and quantitative point of view.
As seen in the image above, these can be used to help determine key levels in the chart where price is likely to react. In the settings you will be able to adjust its sensitivity to the levels you like to trade.
TTP CerberusCerberus is an indicator that uses stochastic RSI applied to the ratio of the total market cap vs the cap of stable coins.
It offers 4 different signals that intent to find market bottoms or tops based on the flow of funds moving from alts into stable coin.
The signals are triggered when the calculation reaches the top and bottom user defined thresholds.
Signals:
1) Warning sell: the most accurate signal that can be used as a serious caution that the market might dump soon. In the total backtesting history it's got a 90% accuracy. It's displayed as a yellow vertical line on the top of the chart.
2) Sell or "confirmation" sell. This is plotted as red vertical line on the top area of the chart. It confirms that the dump has started.
3) Warning buy. This signal is also plotted in yellow but in the bottom of the chart and indicates that the price might potentially have bottomed locally. It is not recommended to be used during bear markets. On bull runs it offers high accuracy.
4) Buy signal, this signal confirms that the waning buy is potentially on its way to higher highs. Just like the warning buy it tends to perform very good on bull markets and shouldn't be considered during bear markets.
By default the indicator uses TOTAL as the total market cap in crypto. Alternatively you can select TOTAL2 or TOTAL3 and compare results.
The total market cap for stable coins is calculated as the sum of USDT, USDC and DAI.
I personally use this indicator ONLY in the weekly timeframe as that's where I see the most reliable results.
It offers separated alerts for each individual signal.
How I plan to use it? I'm personally planning to use the warning sell signal on the weekly as a potential high risk caution flag for the crypto market.
Price Action Top/BottomThis script is a variation from Auto Fibo retration.
It makrs top and bottom prices. You can use to study the price action.
The user can choose the line color, to show or not, the marks green and red
The user can choose the minimal candles between top and bottom, by default is 17
The deep is the percentage of the diference about the last bottom/top from the previous one.
chart visible bar timeWith the latest added features chart.left_visible_bar_time and chart.right_visible_bar_time it is now possible to
place label.new() positions at the equivalent of 'location.top' and 'location.bottom'
The following are examples of functions which enables to find the visible chart highest/lowest bars:
highest_visible_chart() =>
var float highs = na
highs := time == chart.left_visible_bar_time ? high :
time > chart.left_visible_bar_time and high > highs ? high : highs
lowest_visible_chart() =>
var float lows = na
lows := time == chart.left_visible_bar_time ? low :
time > chart.left_visible_bar_time and low < lows ? low : lows
In this example labels are plotted when a sma crosses another sma
Also combined with 3 boxes, scrolling gives insights how the features work
To all who make Tradingview the way it is, lots and lots of thanks!
Cheers!
Williams Vix Fix Bottoms and TopsThis indicator uses the very popular Williams Vix Fix for Bottoms by Chris Moody but not only does it search for bottoms, it can also be switch to work for tops for those who look to short the market. I've also added in a few options like flipping the indicator, color adjustments on the settings page, as well as cut a few of the options I feel did not need to be in which cluttered the screen when the settings were opened. In his later revisions of the Williams Vix Fix, CM took out the functions which draw the high/low ranges as well as the standard deviation which is what this indicator uses to show entry points. I have added options back on to draw these, I think it's useful. To be honest, I have not messed around with the number settings much so I am not sure how adjusting the look back range or going for smaller / bigger percentage changes would change how well the indicator works. It seems to work very well at its default settings.
With the Bollinger Band deviation, you have to remember that it looks back at the set amount of candles (20 by default) and uses those for the standard deviation: 1 dev = 68%, 2 dev = 95%, 3 dev = 99.7%
These percentages mean that at 2 dev, 95% of the last 20 candles will remain within the boundaries of the Bollinger Bands. Three tends to be too high, one is usually too low. Two is pretty good.
The lowest percentile option probably won't change much other than bring up the bottom line which doesn't effect the alerts or signals, just something to observe.
The highest percentile option makes a difference similar to the stand deviation and Bollinger Band. The higher you put it, the less likely it will get triggered but the more reliant it of a signal it should be.
As always, I have left notes throughout the code and I did leave in the code that was original but commented it out as I don't believe it's worth having.
I like to have the high/lows drawn, as well as the standard deviation. Then I find that the filtered entries are most accurate signals to follow. Simple entry is hit or miss, Aggressive entry is always early but sometimes that's not a great thing.
Rets High/Low (2.0 Special Uncensored Edition)This script can be used as a visual aid in seeing the last highs and lows of price in a specific time period. It automatically updates the plots if new highs or lows are made within the given lookback period.
This is a fairly basic version currently, with new added features coming in future updates such as range between high/low and half and whole number detection.
dize Top & BottomsHi Trader,
the "Tops & Bottoms" indicator is one part of our holistic approach to identifying trading setups. It is one of many indcators of our dize indicator package and should always be used in conjunction with the other dize indicators.
💡 What is the Tops & Bottoms indicator?
The "Tops and Bottoms" indicator is a momentum indicator that gives us clues as to when a market might turn around or how intact the current trend is. When calculating, we use statistical methods that provide us with indications of abnormal market behavior.
The indicator comes with Multi-Timeframe support, which makes it easy to get an overview on what is happening on other timeframes.
💡 How to use it?
The indicator has one calculation parameter. The "Sensitivity" parameter specifies how many candles are considered in the calculation. The resolution parameter instead tells the indicator on which timeframe it should be calculated. Please be aware, that the selected timeframe should always be higher than the displayed chart timeframe.
The upper and lower visual bands of the indicator act as a threshold to detect abnormal market behavior.
Furthermore, the appearance of the indicator can be changed using the selected colors.
Let's have a look:
Using the indicator on the same timeframe:
Using the indicator on a higher timeframe:
🔓 To gain access to this indicator, please read the signature field.
VWAP/EMA50/EMA200We script this one for combining VWAP , EMA50 and EMA200. The tool is fantastic if traders know how VWAP , EMA work? Just adding this script in your favorite and work like charm:
VWAP: How to trade with that
- One of the simplest uses of the VWAP is gauging support and/or resistance.
- A trader who is long a stock can use the VWAP as a target exit if its trading below.
- A stock trading over intraday VWAP may be bullish , while a stock trading under may be bearish .
EMA 50/EMA200: How to trade with that timeframe 50-day or 200-day period
- Identify the trend of market in longterm
- Golden-cross (short term EMA cross above longterm EMA ) is call golden-cross signals. It is opportunity for buying.
- Deal-cross ( short term EMA cross below longterm EMA ) is call dead-cross signals. It is opportunity for selling.
- Identify support levels
- Identify resistance levels
Let me know if you see anything else that should be added/changed.
Top & Bottom Strategy by The Accumulation ZoneHey Guy's welcome back to another Strategy based on a popular Indicator!
Indicators used in this Strategy:
-> Top and Bottom by ceyhun (Basic Settings)
-> Volatility Oscillator by verifid (Basic Settings)
Long Entry Criteria:
1. New Buy Signal from the Top & Bottom Indicator
2. Bullish Spike to the upside on the Volatility Oscillator ( above the BB Bands)
3. Enter Long (SL based on ATR, RR 1.5)
Short Entry Criteria:
1. New Sell Signal from the Top & Bottom Indicator
2. Bearish Spike to the downside on the Volatility Oscillator ( below the BB Bands)
3. Enter Short (SL based on ATR, RR 1.5)
Optional Filters:
- Session Filter
- Date Filter
- EMA Filter
IMPORTANT use this only for testing purpose. Don't Risk any Money. For educational Purpose Only!
ATR and IV Volatility TableThis is a volatility tool designed to get the daily bottom and top values calculated using a daily ATR and IV values.
ATR values can be calculated directly, however for IV I recommend to take the values from external sources for the asset that you want to trade.
Regarding of the usage, I always recommend to go at the end of the previous close day of the candle(with replay function) or beginning of the daily open candle and get the expected values for movements.
For example for 26April for SPX, we have an ATR of 77 points and the close of the candle was 4296.
So based on ATR for 27 April our TOP is going to be 4296 + 77 , while our BOT is going to be 4296-77
At the same time lets assume the IV for today is going to be around 25% -> this is translated to 25 / (sqrt (252)) = 1.57 aprox
So based on IV our TOP is going to be 4296 + 4296 * 0.0157 , while our BOT is going to be 4296 - 4296 * 0.0157
I found out from my calculations that 80-85% of the times these bot and top points act as an amazing support and resistence points for day trading, so I fully recommend you to start including them into your analysis.
If you have any questions let me know !
Max distance from weekly averageAfter extended advances, stocks occasionally have a last surge higher and form what is known as a climax top. One way to gauge this is to study what distance the stock is, in percentage terms, vs a moving average. However, most indicators use the close of the bar rather than the high of the bar for this calculation. Stocks that have big reversals may not show to be overextended when looking at a weak closing price. therefore, this tool looks at the high of the week vs the 10-week moving average so that the closing price does not affect comparisons between different weeks.
[k4d] DCA SniperFrench text below / Texte en Français plus bas
TL;DR
DCA Sniper is an indicator that tells you the perfect time to do DCA, the bottoms areas are indicated by red bars, the buy signal is given when a yellow bar appears.
"DCA Sniper" aims to help you make DCA (Dollar Cost Average) smarter.
Instead of buying your cryptos at a regular rate, this script will send you an alert at an opportune moment when the prices are touching, or are close to, a bottom.
The script works on several time intervals, the smaller the interval the more signals you will get...
so you can try with several time slots and choose the one that gives you the best signals for your strategy.
How to use this indicator
The indicator scans the price evolution in real time and displays grey bars
When it detects a potential bottom, the bars become darker
When the bottom is near, the bars turn red
Finally, when a potential bottom is detected, a yellow bar is displayed => it's time to buy
Warning:
Since the indicator works in real time, a bar can change color as long as the current candle is not closed. A yellow bar may very well turn red and thus cancel the signal. So wait for the close before making a decision.
Settings
This version of the indicator has only two settings:
Use Candlesticks filter: If this box is checked, the script will try to eliminate false signals based on candlestick patterns.
Use LinReg filter: If this box is checked, the script uses the "LinReg length" value to apply a linear regression and filters out all bottoms that fall within a standard deviation of the linear regression.
Before using DCA Sniper
This indicator was not developed for trading, although it can give good potential entries.
If you use it for trading, please manage your risk well and share your feedback :)
====================================================================
Résumé
DCA Sniper est un indicateur qui vous indique le moment parfait pour faire du DCA, les zones de bottoms sont indiquée par des barres rouges, le signal d'achat est donné lorsqu'une barre jaune apparait.
"DCA Sniper" a pour objectif de vous aider à faire du DCA (Dollar Cost Average) plus intelligement
Au lieu d'acheter vos crypto à un rythme régulier, ce script va vous envoyer une alerte à un moment opportun ou les prix touchent, ou sont proches, d'un bottom.
Le script fonctionne sur plusieurs intervals horaires, plus l'interval est petit plus vous aurez des signaux ...
vous pouvez donc essayer avec plusieurs tranches horaires et choisir celle qui vous donnent les meilleurs signaux pour votre stratégie.
Comment utiliser cet indicateur
L'indicateur scan l'évolution des prix en temps réel et affiche des barres grises
Lorsqu'il détecte une zone de bottom potentiel, les barres deviennent plus foncées
Lorsque le bottom est proche les barres deviennent rouges
Enfin, lorsqu'un bottom potentiel est détecté, une barre jaune s'affiche => c'est le moment d'acheter
Attention
Puisque l'indicateur fonctionne en temps réel, une barre peut changer de couleur tant que la bougie actuelle n'est pas cloturée. Une barre jaune peut très bien devenir rouge et annule donc le signal. Il faut donc attendre la cloture avant de prendre une décision.
Réglages
Cette version de l'indicateur propose seulement deux réglages :
Use Candlesticks filter : Si cette case est cochée, le script va essayer d'éliminer des faux signaux en se basant sur des patterns de bougies.
Use LinReg filter : Si cette case est cochée, le script utilise la valeur "LinReg length" pour appliquer une regression linéaire et filtre tous les bottoms qui se retrouvent au sein d'une déviation standard de la régression linéaire.
Avant d'utiliser DCA Sniper
Cet indicateur n'a pas été développé pour faire du trading, bien qu'il puisse donner de bonnes entrées potentielles.
Si vous l'utilisez pour du trading, gérer bien votre risque et partagez vos retours :)
Eflatun CCI Divergence and Top/BottomThe Commodity Channel Index (CCI) with Divergence and finding Top / Bottom points
Select MA with Sma, Ema, Wma, SWma, VWma, Hma or Rma
Follow bar color on top or bottom
[UPRIGHT Trading] Top & Bottom Finder [Premium]Hello Traders,
Today I'm releasing an updated version of my previous Top & Bottom Finder (M.Right_Top & Bottom Finder 1.0).
The timing of this release couldn't be more perfect with everyone trying to 'find the bottom'. And the increased volatility that we've been seeing as of late.
Essentially, my indicator uses volatility and standard deviations among other things to assist you in finding the top or bottom of trends. You may also notice that it uses a lot of different strength indicators to provide an additional layer of complexity and confirmation.
Not just an RSI, but an RSI ema, smoothed OBV RSI's, and other volume RSI's. This is a truly unique and powerful tool for any Trader - whether you've just started or you've been trading for 20 years, I'm confident you will find value in the UPRIGHT Trading Top & Bottom Finder.
How to use it:
When it detects the trend Bottoming or Topping the histogram will change color. Bottom - Green/blue, Top - Red, (different shades of colors for different types of detection).
I've spent several hours tweaking the calculations and filters to enhance the accuracy, so this will be a noticeable upgrade from my original Top & Bottom Finder.
The length of the histogram bar can be an indication in itself, especially when it lines up close to one of the plotted lines and has noticeable direction change following this.
I've added a lot of text and pictures to help display it's capabilities, features, and customizability.
As always, it's fully customizable with alerts. Can toggle any thing on or off, and change the colors to suit your style.
3 Unique RSI's, different colors on the histogram will show different levels of detection. Some are more accurate in some timeframes than others. Bright Green and Bright Red are the most different from the rest.
I've jam-packed this indicator with Buy/Sell and Confirmation Signals and even background highlights (with colors that can mesh together). Feel free to find what works best for you.
RSI color indications and background highlights aid in confirmation. Also, as mentioned previously, sometimes a gray bar will land on a Fib and it will be a bottom signal.
The above chart should look like this
Good luck Traders,
Cheers,
Mike
(UPRIGHT Trading)
Trend Volatility Tops and Bottoms
Big Picture:
Overall what this script try's to capture is bounces off of moving trend lines.
What you will see when using this script
one Green line, one red line, two gray lines and circles in colors blue, green, red, and purple.
RED AND GREEN LINES:
There are two trend lines, an upper and a lower line that are 1 to 2 standard deviations from the linear regression line formed by the closing price for a look back period. The green is the distance from the close price and the lower line. The red is the list from the close and the upper line. (you don't see the lower and upper lines, but yo do see the green and red lines)
The goal is too easily see when price is approaching those support and resistance levels.
GRAY LINES:
GRAY lines are a form of volatility metric. GRAYS represent the distance from the RED and GREEN lines talked about above. low volatility mean the two GRAY lines will be close and times of high volatility will be father apart.
COLORED CIRCLES:
the color circles represent possible bounce zones, when price is high or low for for a given time period.
PURPLE is caution that there could be a possible price drop
RED is a critical zone for rejection and price drop
BLUE is caution that there could be a possible price increase
GREEN is a critical zone for bounce and price increase
how its used
feel free to play around and Try new things but, how its intended to be used is on 4hr time Frame looking for longer term trends on assets that tend to be less volatile on average.
settings
some settings:
buy deviation, this will say how many standard deviations do you want the lower bounce line to be from the linear regression line
sell deviation, this will say how many standard deviations do you want the upper bounce line to be from the linear regression line
dist to zero buy: how close dose the price has to be to put out a possible bounce.
Recap
-red and purple = possible upcoming price drop... red is more critical than purple
-green and blue = possible upcoming price increase... green is more critical than blue
-use on less volatile assents and on 4hr timeframe
good luck!
BTC Puell Multiple with alert functionThe Puell Multiple examines the fundamentals of mining profitability and the way they shape market cycles. It is calculated by taking a ratio of daily coin issuance (in USD) and the 365 moving average of daily coin issuance (in USD).
Interpretation of the Puell Multiple can generally be considered in the following framework:
high values indicate that current miner profitability if high compared to the yearly average. As such, the incentive for miners to liquidate their treasuries is high and greater sell pressure may be expected.
Low values indicate that current miner profitability is low compared to the yearly average. As such, income stress may become a factor, and some miners may need to start reducing hash-power by switching off rigs. This increases the hash-share of remaining miners who can then sell fewer coins to cover their operations, reducing their impact on liquid supply.
Halving events will drop the current coin issuance by 50% relative to the preceding year creating an immediate halving of the Puell Multiple also. The effect on miner profitability will thus be as per the point on low values above.
Volume TrendsThis script provides clear volume trends on any time frame. You set a long term volume trend moving average (ex 100 periods). A shorter term MA of your choice (10 in this example) will oscillate above and below based on the standard deviations of its current value relative to the long term #.
Similarly, large volume bars are plotted in terms of st dev above the long term MA.
Very useful in spotting capitulation bottoms and/or blow-off tops.
TradingGroundhog - Strategy & Wavetrend V2#-- Public Strategy - No Repaint - Fractals - Wavetrend --
Here I come with another script, a nice and simple strategy based on fractals and Wavetrends.
#-- Synopsis --
A simple idea, on a small time frame (15 min) we buy when the opening price goes below a Bottom fractals and sell when it goes over a Top fractals, but in order to avoid bad and evil downtrends, we use Wavetrends based on a Daily time frame. From it, Tops and Bottoms are extracted. If the opening price goes above Wavetrend Tops, no trades will be conducted during the day. If the price goes below Wavetrend bottoms, no trades will be executed from 1 to N days, until a new Wavetrend bottom is generated.
I developed the strategy using BTC /EUR 15 MIN BINANCE but it can be applied to many other cryptos, I don't know for forex or others. You can use it for long term and automated trading, I implemented the Wavetrend indicator to do so, or for short term if you have spot a long coming uptrend. Test it, look at its profit and long or short period on your crypto of choice.
#-- Graph reading --
And now, how to read it ?
Wavetrends:
Red Backgrounds are associated to No Trade periods. These periods occur when the price goes below a Wavetrend bottom or above a Wavetrend Top. They are here to limit the loss.
Blue Gradient lines represent the past Tops. For each bar, only the increasing values of the Wavetrend tops are acquired. Going from light to dark blue based on the age of the Tops. Thus, if on line goes from dark to light, this means the price is approaching a previous Wavetrend top. In the opposite, if it darken, thus the price say 'buy buy' and go dropping.
Yellow Gradient lines represent the past Bottoms. They are based on the same principe that the blue lines.
Fractals:
Yellow Flags occur when the opening price goes below a Bottom fractal , it means Buy.
White Flags appear when the opening price goes over a Top fractal , it means Sell.
#-- Parameters --
*** Parameters have been intensively optimized using 10 cryptocurrency markets in order to have potent efficiency for each of them. I would recommend to only change the Can Be touch parameter. For the others, I don't recommend any modifications. The idea behind the script is to be able to switch between markets without having to optimize parameters, less work, easy to target active crypto and therefor limit the risks. ***
Can be touch :
'Combined Smoothness' : The number of open individuals used by the Wavetrend. (6 or 9, often 9 is better but with less volatile crypto it will be 6)
'Filter fractals' : Activate or Disable the filtering fractal operation. If Enable, buy during less risky periods. (Disable is often better)
Can be touch but not necessary :
'VolumeMA' : The Volume corrector used by the fractals
'Extreme window' : The number of price individuals to look for if we want to remove extreme fractals.
Not to touch :
'Limit_candle to look on' : Number of candles to use to compute the Wavetrend Tops and Bottoms.
'Length top bottom drawn' : Size of the lines
'Long Sop Loss (%)' : The minimal difference of price between a Fractal bottom and the opening price to buy.
#-- Time frame --
Should be used with the following time frames depending on the necessity:
1 MIN
3 MIN (Interesting for short term profit, may need some parameter ajustements)
5 MIN
15 MIN (Preferred for long term profit, the script was developed on it)
#-- Last words --
The script can be set up to send Tradingview signals to 3comma just by adding comment = " " in strategy.close_all() and strategy.entry().
Good trades !
Disclaimer (As it should always be one to any script)
***
This script is intended for and only to be used for personal purposes only. No such information provided by it constitutes advice or a recommendation for any investment or trading strategy for any specific person. There is no guarantee presented or implied as to the accuracy of specific forecasts, projections, or predictive statements offered by the script. Users of the script agree that its original developer does not take responsibility for any of your investment decisions. Please seek professional advice before trading.
***
# Here are the results from the 1rst of July 2021 with 100% of equity on the BTC /EUR 15 Min and with a capital of 1 000 EUR.
# As I saw, it goes from +20% to more than +100% depending on the selected crypto. Sometimes it's negative but it's quite rare on crypto using the EUR.
M.Right_Top & Bottom Finder 1.0Thank you @Lazybear for the calculations for squeeze and BB, and all of the other great pine-coders who inspired me to create my own indicator to share!
This is the result of hours of work learning to code pine and tweaking until everything fits exactly what I was looking for.
After using it for a while and seeing the benefits personally, I figured now might be a good time to share with everyone while we are in such great market volatility, maybe I can save you some losses.
Basically, my indicator is meant to use volatility and standard deviations to show you the top and bottom of trends.
It does indeed work on lower timeframes, I typically use it on 5m, 30m, 4hr, and 1d.
What to look for:
When it detects the trend bottoming it will send a green histogram bar down, I also created a different shade green for even more likely bottoms.
When it detects the top of the trend it will send a red bar up, I have a brighter red for more certain tops.
The length of the histogram bar is also an indication as well. Sometimes there will be a reversal while still just showing the gray bar.
I just added alerts, so hopefully those work. If not, I will update.
Let me know if you have any questions, and enjoy.
Cheers!
Oscillator EdgesAnother simple script to be added on top of other indicators. Simply provides a symbol of varying color depending on the value of the oscillator. Allows up to 4 different colors in each direction. Includes alerts conditions. Demonstration is the indicator being applied to the RSI (purple) included in Market Cipher B.
To use, simply add it to your indicator, and choose and oscillator of your choice in the Input Settings. Alternatively, you can just keep it on 'close' and use the built in RSI. Or, you can use the RSI formula on top of something else (if that's your thing).
The names are silly, so I hope this is okay with all of you.
Let me know what you think, and if there are any problems, questions, or concerns!