Medico Action Zone self adjust TF version 2to create buy sell signal with adjusted EMA and timeframePine Script®策略由Medico410提供11
SuperTrend Strategy with Trend-Based Exits🟩 SuperTrend Strategy with Trend-Based Exits This is a fully automated trend-following strategy based on the popular SuperTrend indicator, enhanced with a position sizing algorithm tied to stop-loss distance and dynamic entry/exit rules. The strategy is designed for futures trading with an emphasis on sustainable risk, realistic backtesting, and transparent logic. 🧠 Concept and Methodology The strategy uses the SuperTrend indicator, which is derived from ATR (Average True Range) and is widely used to capture medium- to long-term market trends. Key features: ✅ Entries are triggered only when the SuperTrend direction changes (trend reversal). ✅ Exits are performed using a dynamic stop-loss placed at the SuperTrend line. ✅ Position size is automatically calculated based on the trader’s fixed dollar risk per trade and the current distance to the stop-loss. ✅ Rounding logic is included to ensure quantity is valid for the exchange’s lot size. This strategy does not use any take-profit or classic trailing stop — the position is only closed when the trend reverses or the stop is hit by touching the SuperTrend line. ⚙️ Default Parameters ATR Length: 300 Factor: 7.5 Risk per trade: $90 (3% of the default $3,000 capital) Lot step: 10 Commission: 0.05% These default parameters are not universal. They were optimized specifically for STXUSDT swap at 15M timeframe at Bybit and may not produce viable results on other pairs and timeframes. Users are encouraged to customize the settings according to specific asset’s volatility, timeframe and other characteristics. ❗ These default settings yield meaningful backtesting results on STXUSDT with a reasonable number of trades (105+) over 7-month period. If applied to other assets, results may vary significantly. 📈 Position Sizing Logic The strategy uses a dynamic position sizing formula: Pine Script® position_size = floor((risk_per_trade / stop_loss_distance) / lot_step) * lot_step This ensures the trader always risks a fixed dollar amount per trade and never exceeds a sustainable equity exposure (recommended 2% or less). ✅ Realism in Backtesting To ensure realistic and non-misleading backtest results, this strategy includes: — Slippage and commission settings matching average exchange conditions (commission = 0.05%, slippage 5 ticks). — Position sizing based on stop-loss distance (not fixed contract quantity).* — A fixed risk-per-trade model that adheres to responsible capital management principles. — This is in compliance with TradingView's Script publishing rules and House Rules. 📌 How to Use Apply the strategy to a clean chart (preferably 15M for STXUSDT by default). If using another asset, adjust: - ATR Length - Factor - Risk per trade - Qty step (lot precision for the symbol) Avoid using with other indicators unless you understand their purpose. Use the Strategy Tester to evaluate performance and optimize parameters. ⚠️ Disclaimer This is not financial advice. Always perform forward testing and assess risk before deploying any strategy on live capital. The strategy is designed for educational and experimental use.Pine Script®策略由nefyodov.artyom提供95
XRP AI 15‑m Adaptive v3.1Tracks XRP based on historical data curated by AI @DanielSpeiss Pine Script®策略由DanielSpeiss提供19
Trend Following - MM3 High/LowPosition Trade Strategy (weekly chart). Trend Following systemPine Script®策略由ViniciusSD提供9
TPC Strategy XAUUSD - M5 with Fixed SL/TPThis script implements a trend-following strategy for XAUUSD on the 5-minute chart, using 200 EMA and 21 EMA to filter direction. Entries are triggered based on RSI, MACD crossovers, and price action alignment. It includes fixed Stop Loss (15 pips) and Take Profit (22.5 pips) with visual SL/TP lines, BUY/SELL labels, and alert conditions for automated notifications. Designed for intraday scalping and low-risk entries during trending conditions.Pine Script®策略由sagarnale97提供68
Long and Short Strategy with Multi Indicators [B1P5]Long and Short Strategy with RSI, ROC, MA Selection, Exit Visualization, and Strength IndicatorPine Script®策略由NerdInvestor47提供139
Supertrend Long-Only Strategy for QQQThis strategy is meant to use Micro Momentum to give good Buy and Sell signals in trending marketsPine Script®策略由freefighter07提供22360
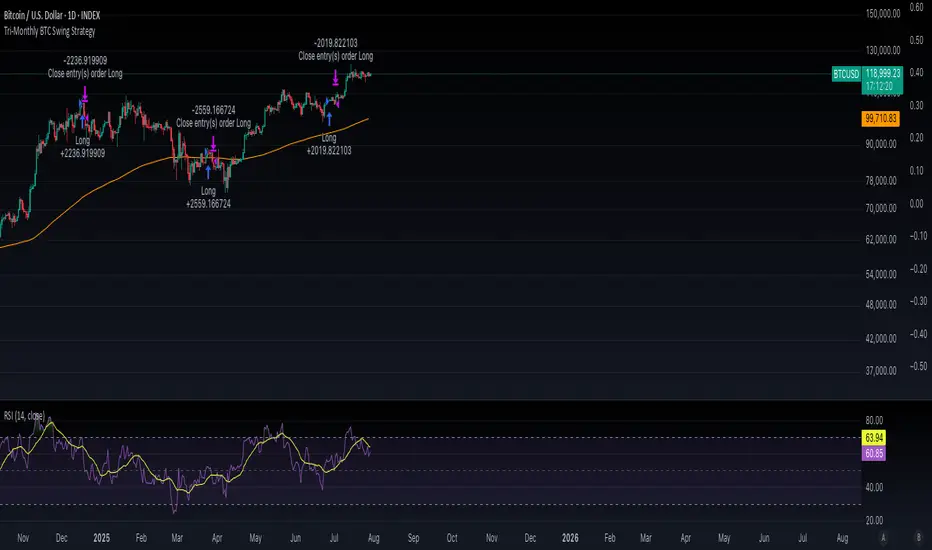
Tri-Monthly BTC Swing StrategyWhat This Does: Component Function EMA200 Filters long-term bullish conditions MACD crossover Confirms swing entry RSI > 50 Confirms momentum is strong 90-day cooldown Ensures you're not overtrading Exit on MACD/RSI weakness Protects from reversalsPine Script®策略由KonkeyC提供8
Refined MA + Engulfing (M5 + Confirmed Structure Break)I would like to start by saying that this strategy was put together using ChatGPT, some past trades from myself and some backtested trades, and from my time as a student in Wallstreet Academy under Cue Banks. I am not profitable yet. I am too jumpy and blow accounts. I'm hoping this strategy (and it's indicator twin) can help me spend less time on the charts, so that I'm not tempted to press buttons as much. It does fire quite a bit. But, the Strategy Tester tab shows a 30% win rate with our wins being significant to our losses. So, in theory, if you followed the rules of this strategy STRICTLY, you COULD BE profitable. With that being said, there are times that this strategy has shown to trigger and I ask, "Why?". I just want to help myself and others, and maybe make some decent\cool stuff along the way. Enjoy KRPine Script®策略由IamKRfx提供23
HSI1! First 30m Candle Strategy (15m Chart)## HSI1! First 30-Minute Candle Breakout Strategy (15m Chart) — Description ### Overview This strategy is designed for trading **Hang Seng Index (HSI) Futures** on a 15-minute chart. It uses the price range established during the first 30 minutes of the Hong Kong main session (09:15–09:44:59) to define key breakout levels for a systematic trade entry each day. ### How the Strategy Works #### 1. Reference Candle Period - **Aggregation Window:** The strategy monitors the first two 15-minute bars of the session (09:15:00–09:44:59 HKT). - **Range Capture:** It records the highest and lowest prices (the "reference high/low") during this window. #### 2. Trade Setup - After the 09:45 bar completes, the reference range is locked in. - Throughout the rest of the trading day (within session hours), the strategy looks for breakouts beyond the reference range. #### 3. Entry Rules - **Long Entry (Buy):** - Triggered if price rises to or above the reference high. - Only entered if the user's settings permit "Buy Only" or "Both". - **Short Entry (Sell):** - Triggered if price falls to or below the reference low. - Only entered if the user's settings permit "Sell Only" or "Both". - **Single trade per day:** - Once any trade executes, no additional trades are opened until the next session. #### 4. Exit Rules - **Take Profit (TP):** - Target profit is set to a distance equal to the initial range added above the long entry (or subtracted below the short entry). - Example: For a 100-point range, a long trade targets entry + 100 points. - **Stop Loss (SL):** - Longs are stopped out if price falls back to the session's reference low; shorts are stopped out if price rallies to the reference high. #### 5. Session Control - Active only within the regular day session (09:15–12:00 and 13:00–16:00 HKT). - Trade tracking resets each new trading day. #### 6. Trade Direction Manual Setting - A user input allows restriction to "Buy Only", "Sell Only" or "Both" directions, providing discretion over daily bias. ### Example Workflow | Step | Action | |---------------------------|-------------------------------------------------------------------------| | 09:15–09:44 | Aggregate first two 15m candles; record daily high/low | | After 09:45 | Wait for a breakout (price crossing either the high or the low) | | Long trade triggered | Enter at the reference high, target is "high + range", SL is at the low | | Short trade triggered | Enter at the reference low, target is "low - range", SL at the high | | Trade management | No more trades for the day, regardless of further breakouts | | End of session (if open) | Trades may be closed per further logic or left to strategy to handle | ### Key Features and Benefits - **Discipline:** Only one trade per day, minimizing overtrading. - **Clarity:** Transparent entry/exit rules; no discretionary execution. - **Flexibility:** User can bias system to buy-only, sell-only, or allow both, depending on trend or personal view. - **Simple Risk Control:** Pre-defined stop loss and profit target for every trade. - **Works best in:** Trending, breakout-prone markets with a history of impulsive moves early in the session. This strategy is ideal for systematic traders looking to capture the Hang Seng's early session momentum, with robust rule-based management and minimal intervention.Pine Script®策略由james0445提供21
HSI First 30m Candle Strategy (5m Chart)## HSI First Candle Breakout Strategy USE on 10m TF for max profit rate. **The HSI First Candle Breakout Strategy** is a systematic trading approach tailored for Hang Seng Index Futures during the main Hong Kong day session. The strategy is designed to capture early market momentum by reacting to the first significant move of the day. ### How It Works - **Reference Candle:** At the start of each day session (09:00), the high and low of the first 15-minute candle are recorded. - **Breakout Trigger:** - A **buy (long) trade** is initiated if price breaks above the first candle’s high. - A **sell (short) trade** is initiated if price breaks below the first candle’s low. - **Stop Loss & Take Profit:** - Stop-loss is placed on the opposite side of the reference candle. - Take-profit target is set at a distance equal to the size of the reference candle (1R). - **Filters:** - Skip the day if the first candle’s range exceeds 200 index points. - Only the first triggered direction is traded per session. - All trades are closed before the market closes if neither target nor stop is hit. - **Execution:** The strategy works best on intraday charts (5m or 15m) and is ideal for traders seeking disciplined, systematic intraday setups. ### Key Features - Captures the day’s initial momentum burst. - Strict risk management with predefined stops and targets. - One trade per day, reducing overtrading and noise. - Clear-cut, rule-based, and objective system—no discretion required. **This strategy offers a transparent and robust framework for traders to systematically capture high-probability breakouts in the Hang Seng Index Futures market.**Pine Script®策略由james0445提供32
LANZ Strategy 6.0 [Backtest]🔷 LANZ Strategy 6.0 — Precision Backtesting Based on 09:00 NY Candle, Dynamic SL/TP, and Lot Size per Trade LANZ Strategy 6.0 is the simulation version of the original LANZ 6.0 indicator. It executes a single LIMIT BUY order per day based on the 09:00 a.m. New York candle, using dynamic Stop Loss and Take Profit levels derived from the candle range. Position sizing is calculated automatically using capital, risk percentage, and pip value — allowing accurate trade simulation and performance tracking. 📌 This is a strategy script — It simulates real trades using strategy.entry() and strategy.exit() with full money management for risk-based backtesting. 🧠 Core Logic & Trade Conditions 🔹 BUY Signal Trigger: At 09:00 a.m. NY (New York time), if: The current candle is bullish (close > open) → A BUY order is placed at the candle’s close price (EP) Only one signal is evaluated per day. ⚙️ Stop Loss / Take Profit Logic SL can be: Wick low (0%) Or dynamically calculated using a % of the full candle range TP is calculated using the user-defined Risk/Reward ratio (e.g., 1:4) The TP and SL levels are passed to strategy.exit() for each trade simulation. 💰 Risk Management & Lot Size Calculation Before placing the trade: The system calculates pip distance from EP to SL Computes the lot size based on: Account capital Risk % per trade Pip value (auto or manual) This ensures every trade uses consistent, scalable risk regardless of instrument. 🕒 Manual Close at 3:00 p.m. NY If the trade is still open by 15:00 NY time, it will be closed using strategy.close(). The final result is the actual % gain/loss based on how far price moved relative to SL. 📊 Backtest Accuracy One trade per day LIMIT order at the candle close SL and TP pre-defined at execution No repainting Session-restricted (only runs on 1H timeframe) ✅ Ideal For: Traders who want to backtest a clean and simple daily entry system Strategy developers seeking reproducible, high-conviction trades Users who prefer non-repainting, session-based simulations 👨💻 Credits: 💡 Developed by: LANZ 🧠 Logic & Money Management Engine: LANZ 📈 Designed for: 1H charts 🧪 Purpose: Accurate simulation of LANZ 6.0's NY Candle Entry systemPine Script®策略由rau_u_lanz提供已更新 133
Strategy Chameleon [theUltimator5]Have you ever looked at an indicator and wondered to yourself "Is this indicator actually profitable?" Well now you can test it out for yourself with the Strategy Chameleon! Strategy Chameleon is a versatile, signal-agnostic trading strategy designed to adapt to any external indicator or trading system. Like a chameleon changes colors to match its environment, this strategy adapts to match any buy/sell signals you provide, making it the ultimate backtesting and automation tool for traders who want to test multiple strategies without rewriting code. 🎯 Key Features 1) Connects ANY external indicator's buy/sell signals Works with RSI, MACD, moving averages, custom indicators, or any Pine Script output Simply connect your indicator's signal output to the strategy inputs 2) Multiple Stop Loss Types: Percentage-based stops ATR (Average True Range) dynamic stops Fixed point stops 3) Advanced Trailing Stop System: Percentage trailing ATR-based trailing Fixed point trailing 4) Flexible Take Profit Options: Risk:Reward ratio targeting Percentage-based profits ATR-based profits Fixed point profits 5) Trading Direction Control Long Only - Bull market strategies Short Only - Bear market strategies Both - Full market strategies 6) Time-Based Filtering Optional trading session restrictions Customize active trading hours Perfect for day trading strategies 📈 How It Works Signal Detection: The strategy monitors your connected buy/sell signals Entry Logic: Executes trades when signals trigger during valid time periods Risk Management: Automatically applies your chosen stop loss and take profit levels Trailing System: Dynamically adjusts stops to lock in profits Performance Tracking: Real-time statistics table showing win rate and performance ⚙️ Setup Instructions 0) Add indicator you want to test, then add the Strategy to your chart Connect Your Signals: imgur.com Go to strategy settings → Signal Sources 1) Set "Buy Signal Source" to your indicator's buy output 2) Set "Sell Signal Source" to your indicator's sell output 3) Choose table position - This simply changes the table location on the screen 4) Set trading direction preference - Buy only? Sell only? Both directions? imgur.com 5) Set your preferred stop loss type and level You can set the stop loss to be either percentage based or ATR and fully configurable. 6) Enable trailing stops if desired imgur.com 7) Configure take profit settings 8) Toggle time filter to only consider specific time windows or trading sessions. 🚀 Use Cases Test various indicators to determine feasibility and/or profitability. Compare different signal sources quickly Validate trading ideas with consistent risk management Portfolio Management Apply uniform risk management across different strategies Standardize stop loss and take profit rules Monitor performance consistently Automation Ready Built-in alert conditions for automated trading Compatible with trading bots and webhooks Easy integration with external systems ⚠️ Important Notes This strategy requires external signals to function Default settings use 10% of equity per trade Pyramiding is disabled (one position at a time) Strategy calculates on bar close, not every tick 🔗 Integration Examples Works perfectly with: RSI strategies (connect RSI > 70 for sells, RSI < 30 for buys) Moving average crossovers MACD signal line crosses Bollinger Band strategies Custom oscillators and indicators Multi-timeframe strategies 📋 Default Settings Position Size: 10% of equity Stop Loss: 2% percentage-based Trailing Stop: 1.5% percentage-based (enabled) Take Profit: Disabled (optional) Trade Direction: Both long and short Time Filter: DisabledPine Script®策略由TheUltimator5提供33463
MACD Liquidity Tracker Strategy [Quant Trading]MACD Liquidity Tracker Strategy Overview The MACD Liquidity Tracker Strategy is an enhanced trading system that transforms the traditional MACD indicator into a comprehensive momentum-based strategy with advanced visual signals and risk management. This strategy builds upon the original MACD Liquidity Tracker System indicator by TheNeWSystemLqtyTrckr , converting it into a fully automated trading strategy with improved parameters and additional features. What Makes This Strategy Original This strategy significantly enhances the basic MACD approach by introducing: Four distinct system types for different market conditions and trading styles Advanced color-coded histogram visualization with four dynamic colors showing momentum strength and direction Integrated trend filtering using 9 different moving average types Comprehensive risk management with customizable stop-loss and take-profit levels Multiple alert systems for entry signals, exits, and trend conditions Flexible signal display options with customizable entry markers How It Works Core MACD Calculation The strategy uses a fully customizable MACD configuration with traditional default parameters: Fast MA : 12 periods (customizable, minimum 1, no maximum limit) Slow MA : 26 periods (customizable, minimum 1, no maximum limit) Signal Line : 9 periods (customizable, now properly implemented and used) Cryptocurrency Optimization : The strategy's flexible parameter system allows for significant optimization across different crypto assets. Traditional MACD settings (12/26/9) often generate excessive noise and false signals in volatile crypto markets. By using slower, more smoothed parameters, traders can capture meaningful momentum shifts while filtering out market noise. Example - DOGE Optimization (45/80/290 settings) : • Performance : Optimized parameters yielding exceptional backtesting results with 29,800% PnL • Why it works : DOGE's high volatility and social sentiment-driven price action benefits from heavily smoothed indicators • Timeframes : Particularly effective on 30-minute and 4-hour charts for swing trading • Logic : The very slow parameters filter out noise and capture only the most significant trend changes Other Optimizable Cryptocurrencies : This parameter flexibility makes the strategy highly effective for major altcoins including SUI, SEI, LINK, Solana (SOL) , and many others. Each crypto asset can benefit from custom parameter tuning based on its unique volatility profile and trading characteristics. Four Trading System Types 1. Normal System (Default) Long signals : When MACD line is above the signal line Short signals : When MACD line is below the signal line Best for : Swing trading and capturing longer-term trends in stable markets Logic : Traditional MACD crossover approach using the signal line 2. Fast System Long signals : Bright Blue OR Dark Magenta (transparent) histogram colors Short signals : Dark Blue (transparent) OR Bright Magenta histogram colors Best for : Scalping and high-volatility markets (crypto, forex) Logic : Leverages early momentum shifts based on histogram color changes 3. Safe System Long signals : Only Bright Blue histogram color (strongest bullish momentum) Short signals : All other colors (Dark Blue, Bright Magenta, Dark Magenta) Best for : Risk-averse traders and choppy markets Logic : Prioritizes only the strongest bullish signals while treating everything else as bearish 4. Crossover System Long signals : MACD line crosses above signal line Short signals : MACD line crosses below signal line Best for : Precise timing entries with traditional MACD methodology Logic : Pure crossover signals for more precise entry timing Color-Coded Histogram Logic The strategy uses four distinct colors to visualize momentum: 🔹 Bright Blue : MACD > 0 and rising (strong bullish momentum) 🔹 Dark Blue (Transparent) : MACD > 0 but falling (weakening bullish momentum) 🔹 Bright Magenta : MACD < 0 and falling (strong bearish momentum) 🔹 Dark Magenta (Transparent) : MACD < 0 but rising (weakening bearish momentum) Trend Filter Integration The strategy includes an advanced trend filter using 9 different moving average types: SMA (Simple Moving Average) EMA (Exponential Moving Average) - Default WMA (Weighted Moving Average) HMA (Hull Moving Average) RMA (Running Moving Average) LSMA (Least Squares Moving Average) DEMA (Double Exponential Moving Average) TEMA (Triple Exponential Moving Average) VIDYA (Variable Index Dynamic Average) Default Settings : 50-period EMA for trend identification Visual Signal System Entry Markers : Blue triangles (▲) below candles for long entries, Magenta triangles (▼) above candles for short entries Candle Coloring : Price candles change color based on active signals (Blue = Long, Magenta = Short) Signal Text : Optional "Long" or "Short" text inside entry triangles (toggleable) Trend MA : Gray line plotted on main chart for trend reference Parameter Optimization Examples DOGE Trading Success (Optimized Parameters) : Using 45/80/290 MACD settings with 50-period EMA trend filter has shown exceptional results on DOGE: Performance : Backtesting results showing 29,800% PnL demonstrate the power of proper parameter optimization Reasoning : DOGE's meme-driven volatility and social sentiment spikes create significant noise with traditional MACD settings Solution : Very slow parameters (45/80/290) filter out social media-driven price spikes while capturing only major momentum shifts Optimal Timeframes : 30-minute and 4-hour charts for swing trading opportunities Result : Exceptionally clean signals with minimal false entries during DOGE's characteristic pump-and-dump cycles Multi-Crypto Adaptability : The same optimization principles apply to other major cryptocurrencies: SUI : Benefits from smoothed parameters due to newer coin volatility patterns SEI : Requires adjustment for its unique DeFi-related price movements LINK : Oracle news events create price spikes that benefit from noise filtering Solana (SOL) : Network congestion events and ecosystem developments need smoothed detection General Rule : Higher volatility coins typically benefit from very slow MACD parameters (40-50 / 70-90 / 250-300 ranges) Key Input Parameters System Type : Choose between Fast, Normal, Safe, or Crossover (Default: Normal) MACD Fast MA : 12 periods default (no maximum limit, consider 40-50 for crypto optimization) MACD Slow MA : 26 periods default (no maximum limit, consider 70-90 for crypto optimization) MACD Signal MA : 9 periods default (now properly utilized, consider 250-300 for crypto optimization) Trend MA Type : EMA default (9 options available) Trend MA Length : 50 periods default (no maximum limit) Signal Display : Both, Long Only, Short Only, or None Show Signal Text : True/False toggle for entry marker text Trading Applications Recommended Use Cases Momentum Trading : Capitalize on strong directional moves using the color-coded system Trend Following : Combine MACD signals with trend MA filter for higher probability trades Scalping : Use "Fast" system type for quick entries in volatile markets Swing Trading : Use "Normal" or "Safe" system types for longer-term positions Cryptocurrency Trading : Optimize parameters for individual crypto assets (e.g., 45/80/290 for DOGE, custom settings for SUI, SEI, LINK, SOL) Market Suitability Volatile Markets : Forex, crypto, indices (recommend "Fast" system or smoothed parameters) Stable Markets : Stocks, ETFs (recommend "Normal" or "Safe" system) All Timeframes : Effective from 1-minute charts to daily charts Crypto Optimization : Each major cryptocurrency (DOGE, SUI, SEI, LINK, SOL, etc.) can benefit from custom parameter tuning. Consider slower MACD parameters for noise reduction in volatile crypto markets Alert System The strategy provides comprehensive alerts for: Entry Signals : Long and short entry triangle appearances Exit Signals : Position exit notifications Color Changes : Individual histogram color alerts Trend Conditions : Price above/below trend MA alerts Strategy Parameters Default Settings Initial Capital : $1,000 Position Size : 100% of equity Commission : 0.1% Slippage : 3 points Date Range : January 1, 2018 to December 31, 2069 Risk Management (Optional) Stop Loss : Disabled by default (customizable percentage-based) Take Profit : Disabled by default (customizable percentage-based) Short Trades : Disabled by default (can be enabled) Important Notes and Limitations Backtesting Considerations Uses realistic commission (0.1%) and slippage (3 points) Default position sizing uses 100% equity - adjust based on risk tolerance Stop-loss and take-profit are disabled by default to show raw strategy performance Strategy does not use lookahead bias or future data Risk Warnings Past performance does not guarantee future results MACD-based strategies may produce false signals in ranging markets Consider combining with additional confluences like support/resistance levels Test thoroughly on demo accounts before live trading Adjust position sizing based on your risk management requirements Technical Limitations Strategy does not work on non-standard chart types (Heikin Ashi, Renko, etc.) Signals are based on close prices and may not reflect intraday price action Multiple rapid signals in volatile conditions may result in overtrading Credits and Attribution This strategy is based on the original "MACD Liquidity Tracker System" indicator created by TheNeWSystemLqtyTrckr . This strategy version includes significant enhancements: Complete strategy implementation with entry/exit logic Addition of the "Crossover" system type Proper implementation and utilization of the MACD signal line Enhanced risk management features Improved parameter flexibility with no artificial maximum limits Additional alert systems for comprehensive trade management The original indicator's core color logic and visual system have been preserved while expanding functionality for automated trading applications.Pine Script®策略由Quant_Trading_Pro提供11693
EMA and Dow Theory Strategies🌐 Strategy Description 📘 Overview This is a hybrid strategy that combines EMA crossovers, Dow Theory swing logic, and multi-timeframe trend overlays. It is suitable for intraday to short-term trading on any asset class: crypto, forex, stocks, and indices. The strategy provides precise entry/exit signals, dynamic stop-loss and scale-out, and highly visual trade guidance. 🧠 Key Features ・Dual EMA crossover system (applied to both symbol and external index) ・Dow Theory-based swing high/low detection for trend confirmation ・Visual overlay of higher timeframe swing trend (htfTrend) ・RSI filter to avoid overbought/oversold entries ・Dynamic partial take-profit when trend weakens ・Custom stop-loss (%) control ・Visualized trade PnL labels directly on chart ・Alerts for entry, stop-loss, partial exit ・Gradient background zones for swing zones and trend visualization ・Auto-tracked metrics: APR, drawdown, win rate, equity curve ⚙️ Input Parameters | Parameter | Description | | ------------------------- | -------------------------------------------------------- | | Fast EMA / Slow EMA | Periods for detecting local trend via EMAs | | Index Fast EMA / Slow EMA | EMAs applied to external reference index | | StopLoss | Maximum loss threshold in % | | ScaleOut Threshold | Scale-out percentage when trend changes color | | RSI Period / Levels | RSI period and overbought/oversold levels | | Swing Detection Length | Number of bars used to detect swing highs/lows | | Stats Display Options | Toggle PnL labels and position of statistics table | 🧭 About htfTrend (Higher Timeframe Trend) The script includes a higher timeframe trend (htfTrend) calculated using Dow Theory (pivot highs/lows). This trend is only used for visual guidance, not for actual entry conditions. Why? Strictly filtering trades by higher timeframe often leads to missed opportunities and low frequency. By keeping htfTrend visual-only, traders can still refer to macro structure but retain trade flexibility. Use it as a contextual tool, not a constraint. ストラテジー説明 📘 概要 本ストラテジーは、EMAクロスオーバー、ダウ理論によるスイング判定、**上位足トレンドの視覚表示(htfTrend)**を組み合わせた複合型の短期トレーディング戦略です。 仮想通貨・FX・株式・指数など幅広いアセットに対応し、デイトレード〜スキャルピング用途に適しています。 動的な利確/損切り、視覚的にわかりやすいエントリー/イグジット、統計表示を搭載しています。 🧠 主な機能 ・対象銘柄+外部インデックスのEMAクロスによるトレンド判定 ・ダウ理論に基づいたスイング高値・安値検出とトレンド判断 ・上位足スイングトレンド(htfTrend)の視覚表示 ・RSIフィルターによる過熱・売られすぎの回避 ・トレンドの弱まりに応じた部分利確(スケールアウト) ・**損切り閾値(%)**をカスタマイズ可能 ・チャート上に損益ラベル表示 ・アラート完備(エントリー・決済・部分利確) ・トレンドゾーンを可視化する背景グラデーション ・勝率・ドローダウン・APR・資産増加率などの自動表示 | 設定項目名 | 説明内容 | | --------------------- | -------------------------- | | Fast EMA / Slow EMA | 銘柄に対して使用するEMAの期間設定 | | Index Fast / Slow EMA | 外部インデックスのEMA設定 | | 損切り(StopLoss) | 損切りラインのしきい値(%で指定) | | 部分利確しきい値 | トレンド弱化時にスケールアウトする割合(%) | | RSI期間・水準 | RSI計算期間と、過熱・売られすぎレベル設定 | | スイング検出期間 | スイング高値・安値の検出に使用するバー数 | | 統計表示の切り替え | 損益ラベルや統計テーブルの表示/非表示選択 | 🧭 上位足トレンド(htfTrend)について 本スクリプトには、上位足でのスイング高値・安値の更新に基づく**htfTrend(トレンド判定)が含まれています。 これは視覚的な参考情報であり、エントリーやイグジットには直接使用されていません。** その理由は、上位足を厳密にロジックに組み込むと、トレード機会の損失が増えるためです。 このスクリプトでは、**判断の補助材料として「表示のみに留める」**設計を採用しています。 → 裁量で「利確を早める」「逆張りを避ける」判断に活用可能です。 Pine Script®策略由mm_mitsuya提供76
Eliora Gold 1min (Heikin Ashi)Eliora -focused trading strategy designed for anything on the 1-minute timeframe using Heikin Ashi candles. This mode combines advanced market logic with structured risk management to deliver smooth, disciplined trade execution. Key Features: ✅ Trend Confirmation – Aligns with dominant market direction for higher accuracy. ✅ ATR-Based Volatility Filter – Avoids high-risk conditions and chaotic price action. ✅ Candle Strength Logic – Filters weak setups, focusing on strong momentum. ✅ Balanced Risk/Reward – Calculates stop-loss and take-profit dynamically for consistent results. ✅ Cooldown & Overtrade Protection – Limits frequency to maintain trade quality. This version of Eliora is built for scalpers and intraday traders seeking high-probability entries with graceful exits.Pine Script®策略由Ashleysantiago98提供1168
Auto Intelligence Selective Moving Average(AI/MA)# 🤖 Auto Intelligence Moving Average Strategy (AI/MA) **AI/MA** is a state-adaptive moving average crossover strategy designed to **maximize returns from golden cross / death cross logic** by intelligently switching between different MA types and parameters based on market conditions. --- ## 🎯 Objective To build a moving average crossover strategy that: - **Adapts dynamically** to market regimes (trend vs range, rising vs falling) - **Switches intelligently** between SMA, EMA, RMA, and HMA - **Maximizes cumulative return** under realistic backtesting --- ## 🧪 materials amd methods - **MA Types Considered**: SMA, EMA, RMA, HMA - **Parameter Ranges**: Periods from 5 to 40 - **Market Conditions Classification**: - Based on the slope of a central SMA(20) line - And the relative position of price to the central line - Resulting in 4 regimes: A (Bull), B (Pullback), C (Rebound), D (Bear) - **Optimization Dataset**: - **Bybit BTCUSDT.P** - **1-hour candles** - **2024 full-year** - **Search Process**: - **Random search**: 200 parameter combinations - Evaluated by: - `Cumulative PnL` - `Sharpe Ratio` - `Max Drawdown` - `R² of linear regression on cumulative PnL` - **Implementation**: - Optimization performed in **Python (Pandas + Matplotlib + Optuna-like logic)** - Final parameters ported to **Pine Script (v5)** for TradingView backtesting --- ## 📈 Performance Highlights (on optimization set) | Timeframe | Return (%) | Notes | |-----------|------------|----------------------------| | 6H | +1731% | Strongest performance | | 1D | +1691% | Excellent trend capture | | 12H | +1438% | Balance of trend/range | | 5min | +27.3% | Even survives scalping | | 1min | +9.34% | Robust against noise | - Leverage: 100x - Position size: 100% - Fees: 0.055% - Margin calls: **none** 🎯 --- ## 🛠 Technology Stack - `Python` for data handling and optimization - `Pine Script v5` for implementation and visualization - Fully state-aware strategy, modular and extendable --- ## ✨ Final Words This strategy is **not curve-fitted**, **not over-parameterized**, and has been validated across multiple timeframes. If you're a fan of dynamic, intelligent technical systems, feel free to use and expand it. 💡 The future of simple-yet-smart trading begins here.Pine Script®策略由chikaharu提供已更新 66 1.1 K
Pullback Pro Dow Strategy v7 (ADX Filter) ### **Strategy Description (For TradingView)** #### **Title:** Pullback Pro: Dow Theory & ADX Strategy --- #### **1. Summary** This strategy is designed to identify and trade pullbacks within an established trend, based on the core principles of Dow Theory. It uses market structure (pivot highs and lows) to determine the trend direction and an Exponential Moving Average (EMA) to pinpoint pullback entry opportunities. To enhance trade quality and avoid ranging markets, an ADX (Average Directional Index) filter is integrated to ensure that entries are only taken when the trend has sufficient momentum. --- #### **2. Core Logic: How It Works** The strategy's logic is broken down into three main steps: **Step 1: Trend Determination (Dow Theory)** * The primary trend is identified by analyzing recent pivot points. * An **Uptrend** is confirmed when the script detects a pattern of higher highs and higher lows (HH/HL). * A **Downtrend** is confirmed by a pattern of lower highs and lower lows (LH/LL). * If neither pattern is present, the strategy considers the market to be in a range and will not seek trades. **Step 2: Entry Signal (Pullback to EMA)** * Once a clear trend is established, the strategy waits for a price correction. * **Long Entry:** In a confirmed uptrend, a long position is initiated when the price pulls back and crosses *under* the specified EMA. * **Short Entry:** In a confirmed downtrend, a short position is initiated when the price rallies and crosses *over* the EMA. **Step 3: Confirmation & Risk Management** * **ADX Filter:** To ensure the trend is strong enough to trade, an entry signal is only validated if the ADX value is above a user-defined threshold (e.g., 25). This helps filter out weak signals during choppy or consolidating markets. * **Stop Loss:** The initial Stop Loss is automatically and logically placed at the last market structure point: * For long trades, it's placed at the `lastPivotLow`. * For short trades, it's placed at the `lastPivotHigh`. * **Take Profit:** Two Take Profit levels are calculated based on user-defined Risk-to-Reward (R:R) ratios. The strategy allows for partial profit-taking at the first target (TP1), moving the remainder of the position to the second target (TP2). --- #### **3. Input Settings Explained** **① Dow Theory Settings** * **Pivot Lookback Period:** Determines the sensitivity for detecting pivot highs and lows. A smaller number makes it more sensitive to recent price swings; a larger number focuses on more significant, longer-term pivots. **② Entry Logic (Pullback)** * **Pullback EMA Length:** Sets the period for the Exponential Moving Average used to identify pullback entries. **③ Risk & Exit Management** * **Take Profit 1 R:R:** Sets the Risk-to-Reward ratio for the first take-profit target. * **Take Profit 1 (%):** The percentage of the position to be closed when TP1 is hit. * **Take Profit 2 R:R:** Sets the Risk-to-Reward ratio for the final take-profit target. **④ Filters** * **Use ADX Trend Filter:** A master switch to enable or disable the ADX filter. * **ADX Length:** The lookback period for the ADX calculation. * **ADX Threshold:** The minimum ADX value required to confirm a trade signal. Trades will only be placed if the ADX is above this level. --- #### **4. Best Practices & Recommendations** * This is a trend-following system. It is designed to perform best in markets that exhibit clear, sustained trending behavior. * It may underperform in choppy, sideways, or strongly ranging markets. The ADX filter is designed to help mitigate this, but no filter is perfect. * **Crucially, you must backtest this strategy thoroughly** on your preferred financial instrument and timeframe before considering any live application. * Experiment with the `Pivot Lookback Period`, `Pullback EMA Length`, and `ADX Threshold` to optimize performance for a specific market's characteristics. --- #### **DISCLAIMER** This script is provided for educational and informational purposes only. It does not constitute financial advice. All trading involves a high level of risk, and past performance is not indicative of future results. You are solely responsible for your own trading decisions. The author assumes no liability for any financial losses you may incur from using this strategy. Always conduct your own research and due diligence.Pine Script®策略由Salaryman_G提供41
VoVix DEVMA🌌 VoVix DEVMA: A Deep Dive into Second-Order Volatility Dynamics Welcome to VoVix+, a sophisticated trading framework that transcends traditional price analysis. This is not merely another indicator; it is a complete system designed to dissect and interpret the very fabric of market volatility. VoVix+ operates on the principle that the most powerful signals are not found in price alone, but in the behavior of volatility itself. It analyzes the rate of change, the momentum, and the structure of market volatility to identify periods of expansion and contraction, providing a unique edge in anticipating major market moves. This document will serve as your comprehensive guide, breaking down every mathematical component, every user input, and every visual element to empower you with a profound understanding of how to harness its capabilities. 🔬 THEORETICAL FOUNDATION: THE MATHEMATICS OF MARKET DYNAMICS VoVix+ is built upon a multi-layered mathematical engine designed to measure what we call "second-order volatility." While standard indicators analyze price, and first-order volatility indicators (like ATR) analyze the range of price, VoVix+ analyzes the dynamics of the volatility itself. This provides insight into the market's underlying state of stability or chaos. 1. The VoVix Score: Measuring Volatility Thrust The core of the system begins with the VoVix Score. This is a normalized measure of volatility acceleration or deceleration. Mathematical Formula: VoVix Score = (ATR(fast) - ATR(slow)) / (StDev(ATR(fast)) + ε) Where: ATR(fast) is the Average True Range over a short period, representing current, immediate volatility. ATR(slow) is the Average True Range over a longer period, representing the baseline or established volatility. StDev(ATR(fast)) is the Standard Deviation of the fast ATR, which measures the "noisiness" or consistency of recent volatility. ε (epsilon) is a very small number to prevent division by zero. Market Implementation: Positive Score (Expansion): When the fast ATR is significantly higher than the slow ATR, it indicates a rapid increase in volatility. The market is "stretching" or expanding. Negative Score (Contraction): When the fast ATR falls below the slow ATR, it indicates a decrease in volatility. The market is "coiling" or contracting. Normalization: By dividing by the standard deviation, we normalize the score. This turns it into a standardized measure, allowing us to compare volatility thrust across different market conditions and timeframes. A score of 2.0 in a quiet market means the same, relatively, as a score of 2.0 in a volatile market. 2. Deviation Analysis (DEV): Gauging Volatility's Own Volatility The script then takes the analysis a step further. It calculates the standard deviation of the VoVix Score itself. Mathematical Formula: DEV = StDev(VoVix Score, lookback_period) Market Implementation: This DEV value represents the magnitude of chaos or stability in the market's volatility dynamics. A high DEV value means the volatility thrust is erratic and unpredictable. A low DEV value suggests the change in volatility is smooth and directional. 3. The DEVMA Crossover: Identifying Regime Shifts This is the primary signal generator. We take two moving averages of the DEV value. Mathematical Formula: fastDEVMA = SMA(DEV, fast_period) slowDEVMA = SMA(DEV, slow_period) The Core Signal: The strategy triggers on the crossover and crossunder of these two DEVMA lines. This is a profound concept: we are not looking at a moving average of price or even of volatility, but a moving average of the standard deviation of the normalized rate of change of volatility. Bullish Crossover (fastDEVMA > slowDEVMA): This signals that the short-term measure of volatility's chaos is increasing relative to the long-term measure. This often precedes a significant market expansion and is interpreted as a bullish volatility regime. Bearish Crossunder (fastDEVMA < slowDEVMA): This signals that the short-term measure of volatility's chaos is decreasing. The market is settling down or contracting, often leading to trending moves or range consolidation. ⚙️ INPUTS MENU: CONFIGURING YOUR ANALYSIS ENGINE Every input has been meticulously designed to give you full control over the strategy's behavior. Understanding these settings is key to adapting VoVix+ to your specific instrument, timeframe, and trading style. 🌀 VoVix DEVMA Configuration 🧬 Deviation Lookback: This sets the lookback period for calculating the DEV value. It defines the window for measuring the stability of the VoVix Score. A shorter value makes the system highly reactive to recent changes in volatility's character, ideal for scalping. A longer value provides a smoother, more stable reading, better for identifying major, long-term regime shifts. ⚡ Fast VoVix Length: This is the lookback period for the fastDEVMA. It represents the short-term trend of volatility's chaos. A smaller number will result in a faster, more sensitive signal line that reacts quickly to market shifts. 🐌 Slow VoVix Length: This is the lookback period for the slowDEVMA. It represents the long-term, baseline trend of volatility's chaos. A larger number creates a more stable, slower-moving anchor against which the fast line is compared. How to Optimize: The relationship between the Fast and Slow lengths is crucial. A wider gap (e.g., 20 and 60) will result in fewer, but potentially more significant, signals. A narrower gap (e.g., 25 and 40) will generate more frequent signals, suitable for more active trading styles. 🧠 Adaptive Intelligence 🧠 Enable Adaptive Features: When enabled, this activates the strategy's performance tracking module. The script will analyze the outcome of its last 50 trades to calculate a dynamic win rate. ⏰ Adaptive Time-Based Exit: If Enable Adaptive Features is on, this allows the strategy to adjust its Maximum Bars in Trade setting based on performance. It learns from the average duration of winning trades. If winning trades tend to be short, it may shorten the time exit to lock in profits. If winners tend to run, it will extend the time exit, allowing trades more room to develop. This helps prevent the strategy from cutting winning trades short or holding losing trades for too long. ⚡ Intelligent Execution 📊 Trade Quantity: A straightforward input that defines the number of contracts or shares for each trade. This is a fixed value for consistent position sizing. 🛡️ Smart Stop Loss: Enables the dynamic stop-loss mechanism. 🎯 Stop Loss ATR Multiplier: Determines the distance of the stop loss from the entry price, calculated as a multiple of the current 14-period ATR. A higher multiplier gives the trade more room to breathe but increases risk per trade. A lower multiplier creates a tighter stop, reducing risk but increasing the chance of being stopped out by normal market noise. 💰 Take Profit ATR Multiplier: Sets the take profit target, also as a multiple of the ATR. A common practice is to set this higher than the Stop Loss multiplier (e.g., a 2:1 or 3:1 reward-to-risk ratio). 🏃 Use Trailing Stop: This is a powerful feature for trend-following. When enabled, instead of a fixed stop loss, the stop will trail behind the price as the trade moves into profit, helping to lock in gains while letting winners run. 🎯 Trail Points & 📏 Trail Offset ATR Multipliers: These control the trailing stop's behavior. Trail Points defines how much profit is needed before the trail activates. Trail Offset defines how far the stop will trail behind the current price. Both are based on ATR, making them fully adaptive to market volatility. ⏰ Maximum Bars in Trade: This is a time-based stop. It forces an exit if a trade has been open for a specified number of bars, preventing positions from being held indefinitely in stagnant markets. ⏰ Session Management These inputs allow you to confine the strategy's trading activity to specific market hours, which is crucial for day trading instruments that have defined high-volume sessions (e.g., stock market open). 🎨 Visual Effects & Dashboard These toggles give you complete control over the on-chart visuals and the dashboard. You can disable any element to declutter your chart or focus only on the information that matters most to you. 📊 THE DASHBOARD: YOUR AT-A-GLANCE COMMAND CENTER The dashboard centralizes all critical information into one compact, easy-to-read panel. It provides a real-time summary of the market state and strategy performance. 🎯 VOVIX ANALYSIS Fast & Slow: Displays the current numerical values of the fastDEVMA and slowDEVMA. The color indicates their direction: green for rising, red for falling. This lets you see the underlying momentum of each line. Regime: This is your most important environmental cue. It tells you the market's current state based on the DEVMA relationship. 🚀 EXPANSION (Green) signifies a bullish volatility regime where explosive moves are more likely. ⚛️ CONTRACTION (Purple) signifies a bearish volatility regime, where the market may be consolidating or entering a smoother trend. Quality: Measures the strength of the last signal based on the magnitude of the DEVMA difference. An ELITE or STRONG signal indicates a high-conviction setup where the crossover had significant force. PERFORMANCE Win Rate & Trades: Displays the historical win rate of the strategy from the backtest, along with the total number of closed trades. This provides immediate feedback on the strategy's historical effectiveness on the current chart. EXECUTION Trade Qty: Shows your configured position size per trade. Session: Indicates whether trading is currently OPEN (allowed) or CLOSED based on your session management settings. POSITION Position & PnL: Displays your current position (LONG, SHORT, or FLAT) and the real-time Profit or Loss of the open trade. 🧠 ADAPTIVE STATUS Stop/Profit Mult: In this simplified version, these are placeholders. The primary adaptive feature currently modifies the time-based exit, which is reflected in how long trades are held on the chart. 🎨 THE VISUAL UNIVERSE: DECIPHERING MARKET GEOMETRY The visuals are not mere decorations; they are geometric representations of the underlying mathematical concepts, designed to give you an intuitive feel for the market's state. The Core Lines: FastDEVMA (Green/Maroon Line): The primary signal line. Green when rising, indicating an increase in short-term volatility chaos. Maroon when falling. SlowDEVMA (Aqua/Orange Line): The baseline. Aqua when rising, indicating a long-term increase in volatility chaos. Orange when falling. 🌊 Morphism Flow (Flowing Lines with Circles): What it represents: This visualizes the momentum and strength of the fastDEVMA. The width and intensity of the "beam" are proportional to the signal strength. Interpretation: A thick, steep, and vibrant flow indicates powerful, committed momentum in the current volatility regime. The floating '●' particles represent kinetic energy; more particles suggest stronger underlying force. 📐 Homotopy Paths (Layered Transparent Boxes): What it represents: These layered boxes are centered between the two DEVMA lines. Their height is determined by the DEV value. Interpretation: This visualizes the overall "volatility of volatility." Wider boxes indicate a chaotic, unpredictable market. Narrower boxes suggest a more stable, predictable environment. 🧠 Consciousness Field (The Grid): What it represents: This grid provides a historical lookback at the DEV range. Interpretation: It maps the recent "consciousness" or character of the market's volatility. A consistently wide grid suggests a prolonged period of chaos, while a narrowing grid can signal a transition to a more stable state. 📏 Functorial Levels (Projected Horizontal Lines): What it represents: These lines extend from the current fastDEVMA and slowDEVMA values into the future. Interpretation: Think of these as dynamic support and resistance levels for the volatility structure itself. A crossover becomes more significant if it breaks cleanly through a prior established level. 🌊 Flow Boxes (Spaced Out Boxes): What it represents: These are compact visual footprints of the current regime, colored green for Expansion and red for Contraction. Interpretation: They provide a quick, at-a-glance confirmation of the dominant volatility flow, reinforcing the background color. Background Color: This provides an immediate, unmistakable indication of the current volatility regime. Light Green for Expansion and Light Aqua/Blue for Contraction, allowing you to assess the market environment in a split second. 📊 BACKTESTING PERFORMANCE REVIEW & ANALYSIS The following is a factual, transparent review of a backtest conducted using the strategy's default settings on a specific instrument and timeframe. This information is presented for educational purposes to demonstrate how the strategy's mechanics performed over a historical period. It is crucial to understand that these results are historical, apply only to the specific conditions of this test, and are not a guarantee or promise of future performance. Market conditions are dynamic and constantly change. Test Parameters & Conditions To ensure the backtest reflects a degree of real-world conditions, the following parameters were used. The goal is to provide a transparent baseline, not an over-optimized or unrealistic scenario. Instrument: CME E-mini Nasdaq 100 Futures (NQ1!) Timeframe: 5-Minute Chart Backtesting Range: March 24, 2024, to July 09, 2024 Initial Capital: $100,000 Commission: $0.62 per contract (A realistic cost for futures trading). Slippage: 3 ticks per trade (A conservative setting to account for potential price discrepancies between order placement and execution). Trade Size: 1 contract per trade. Performance Overview (Historical Data) The test period generated 465 total trades , providing a statistically significant sample size for analysis, which is well above the recommended minimum of 100 trades for a strategy evaluation. Profit Factor: The historical Profit Factor was 2.663 . This metric represents the gross profit divided by the gross loss. In this test, it indicates that for every dollar lost, $2.663 was gained. Percent Profitable: Across all 465 trades, the strategy had a historical win rate of 84.09% . While a high figure, this is a historical artifact of this specific data set and settings, and should not be the sole basis for future expectations. Risk & Trade Characteristics Beyond the headline numbers, the following metrics provide deeper insight into the strategy's historical behavior. Sortino Ratio (Downside Risk): The Sortino Ratio was 6.828 . Unlike the Sharpe Ratio, this metric only measures the volatility of negative returns. A higher value, such as this one, suggests that during this test period, the strategy was highly efficient at managing downside volatility and large losing trades relative to the profits it generated. Average Trade Duration: A critical characteristic to understand is the strategy's holding period. With an average of only 2 bars per trade , this configuration operates as a very short-term, or scalping-style, system. Winning trades averaged 2 bars, while losing trades averaged 4 bars. This indicates the strategy's logic is designed to capture quick, high-probability moves and exit rapidly, either at a profit target or a stop loss. Conclusion and Final Disclaimer This backtest demonstrates one specific application of the VoVix+ framework. It highlights the strategy's behavior as a short-term system that, in this historical test on NQ1!, exhibited a high win rate and effective management of downside risk. Users are strongly encouraged to conduct their own backtests on different instruments, timeframes, and date ranges to understand how the strategy adapts to varying market structures. Past performance is not indicative of future results, and all trading involves significant risk. 🔧 THE DEVELOPMENT PHILOSOPHY: FROM VOLATILITY TO CLARITY The journey to create VoVix+ began with a simple question: "What drives major market moves?" The answer is often not a change in price direction, but a fundamental shift in market volatility. Standard indicators are reactive to price. We wanted to create a system that was predictive of market state. VoVix+ was designed to go one level deeper—to analyze the behavior, character, and momentum of volatility itself. The challenge was twofold. First, to create a robust mathematical model to quantify these abstract concepts. This led to the multi-layered analysis of ATR differentials and standard deviations. Second, to make this complex data intuitive and actionable. This drove the creation of the "Visual Universe," where abstract mathematical values are translated into geometric shapes, flows, and fields. The adaptive system was intentionally kept simple and transparent, focusing on a single, impactful parameter (time-based exits) to provide performance feedback without becoming an inscrutable "black box." The result is a tool that is both profoundly deep in its analysis and remarkably clear in its presentation. ⚠️ RISK DISCLAIMER AND BEST PRACTICES VoVix+ is an advanced analytical tool, not a guarantee of future profits. All financial markets carry inherent risk. The backtesting results shown by the strategy are historical and do not guarantee future performance. This strategy incorporates realistic commission and slippage settings by default, but market conditions can vary. Always practice sound risk management, use position sizes appropriate for your account equity, and never risk more than you can afford to lose. It is recommended to use this strategy as part of a comprehensive trading plan. This was developed specifically for Futures "The prevailing wisdom is that markets are always right. I take the opposite view. I assume that markets are always wrong. Even if my assumption is occasionally wrong, I use it as a working hypothesis." — George Soros — Dskyz, Trade with insight. Trade with anticipation.Pine Script®策略由DskyzInvestments提供2020718
Enhanced Ichimoku Cloud Strategy V1 [Quant Trading]Overview This strategy combines the powerful Ichimoku Kinko Hyo system with a 171-period Exponential Moving Average (EMA) filter to create a robust trend-following approach. The strategy is designed for traders seeking to capitalize on strong momentum moves while using the Ichimoku cloud structure to identify optimal entry and exit points. This is a patient, low-frequency trading system that prioritizes quality over quantity. In backtesting on Solana, the strategy achieved impressive results with approximately 3600% profit over just 29 trades, demonstrating its effectiveness at capturing major trend movements rather than attempting to profit from every market fluctuation. The extended parameters and strict entry criteria are specifically optimized for Solana's price action characteristics, making it well-suited for traders who prefer fewer, higher-conviction positions over high-frequency trading approaches. What Makes This Strategy Original This implementation enhances the traditional Ichimoku system by: Custom Ichimoku Parameters: Uses non-standard periods (Conversion: 7, Base: 211, Lagging Span 2: 120, Displacement: 41) optimized for different market conditions EMA Confirmation Filter: Incorporates a 171-period EMA as an additional trend confirmation layer State Memory System: Implements a sophisticated memory system to track buy/sell states and prevent false signals Dual Trade Modes: Offers both traditional Ichimoku signals ("Ichi") and cloud-based signals ("Cloud") Breakout Confirmation: Requires price to break above the 25-period high for long entries How It Works Core Components Ichimoku Elements: -Conversion Line (Tenkan-sen): 7-period Donchian midpoint -Base Line (Kijun-sen): 211-period Donchian midpoint -Span A (Senkou Span A): Average of Conversion and Base lines, plotted 41 periods ahead -Span B (Senkou Span B): 120-period Donchian midpoint, plotted 41 periods ahead -Lagging Span (Chikou Span): Current close plotted 41 periods back EMA Filter: 171-period EMA acts as a long-term trend filter Entry Logic (Ichi Mode - Default) A long position is triggered when ALL conditions are met: Cloud Bullish: Span A > Span B (41 periods ago) Breakout Confirmation: Current close > 25-period high Ichimoku Bullish: Conversion Line > Base Line Trend Alignment: Current close > 171-period EMA State Memory: No previous buy signal is still active Exit Logic Positions are closed when: Ichimoku Bearish: Conversion Line < Base Line Alternative Cloud Mode When "Cloud" mode is selected, the strategy uses: Entry: Span A crosses above Span B with additional cloud and EMA confirmations Exit: Span A crosses below Span B with cloud and EMA confirmations Default Settings Explained Strategy Properties Initial Capital: $1,000 (realistic for average traders) Position Size: 100% of equity (appropriate for backtesting single-asset strategies) Commission: 0.1% (realistic for most brokers) Slippage: 3 ticks (accounts for realistic execution costs) Date Range: January 1, 2018 to December 31, 2069 Key Parameters Conversion Periods: 7 (faster than traditional 9, more responsive to price changes) Base Periods: 211 (much longer than traditional 26, provides stronger trend confirmation) Lagging Span 2 Periods: 120 (custom period for stronger support/resistance levels) Displacement: 41 (projects cloud further into future than standard 26) EMA Period: 171 (long-term trend filter, approximately 8.5 months of daily data) How to Use This Strategy Best Market Conditions Trending Markets: Works best in clearly trending markets where the cloud provides strong directional bias Medium to Long-term Timeframes: Optimized for daily charts and higher timeframes Volatile Assets: The breakout confirmation helps filter out weak signals in choppy markets Risk Management The strategy uses 100% equity allocation, suitable for backtesting single strategies Consider reducing position size when implementing with real capital Monitor the 25-period high breakout requirement as it may delay entries in fast-moving markets Visual Elements Green/Red Cloud: Shows bullish/bearish cloud conditions Yellow Line: Conversion Line (Tenkan-sen) Blue Line: Base Line (Kijun-sen) Orange Line: 171-period EMA trend filter Gray Line: Lagging Span (Chikou Span) Important Considerations Limitations Lagging Nature: Like all Ichimoku strategies, signals may lag significant price moves Whipsaw Risk: Extended periods of consolidation may generate false signals Parameter Sensitivity: Custom parameters may not work equally well across all market conditions Backtesting Notes Results are based on historical data and past performance does not guarantee future results The strategy includes realistic slippage and commission costs Default settings are optimized for backtesting and may need adjustment for live trading Risk Disclaimer This strategy is for educational purposes only and should not be considered financial advice. Always conduct your own analysis and risk management before implementing any trading strategy. The unique parameter combinations used may not be suitable for all market conditions or trading styles. Customization Options Trade Mode: Switch between "Ichi" and "Cloud" signal generation Short Trading: Option to enable short positions (disabled by default) Date Range: Customize backtesting period All Ichimoku Parameters: Fully customizable for different market conditions This enhanced Ichimoku implementation provides a structured approach to trend following while maintaining the flexibility to adapt to different trading styles and market conditions.Pine Script®策略由Quant_Trading_Pro提供75
RSI-Adaptive T3 + Squeeze Momentum Strategy✅ Strategy Guide: RSI-Adaptive T3 + Squeeze Momentum Strategy 📌 Overview The RSI-Adaptive T3 + Squeeze Momentum Strategy is a dynamic trend-following strategy based on an RSI-responsive T3 moving average and Squeeze Momentum detection . It adapts in real-time to market volatility to enhance entry precision and optimize risk. ⚠️ This strategy is provided for educational and research purposes only. Past performance does not guarantee future results. 🎯 Strategy Objectives The main objective of this strategy is to catch the early phase of a trend and generate consistent entry signals. Designed to be intuitive and accessible for traders from beginner to advanced levels. ✨ Key Features RSI-Responsive T3: T3 length dynamically adjusts according to RSI values for adaptive trend detection Squeeze Momentum: Combines Bollinger Bands and Keltner Channels to identify trend buildup phases Visual Triggers: Entry signals are generated from T3 crossovers and momentum strength after squeeze release 📊 Trading Rules Long Entry: When T3 crosses upward, momentum is positive, and the squeeze has just been released. Short Entry: When T3 crosses downward, momentum is negative, and the squeeze has just been released. Exit (Reversal): When the opposite condition to the entry is triggered, the position is reversed. 💰 Risk Management Parameters Pair & Timeframe: BTC/USD (30-minute chart) Capital (simulated): $30,00 Order size: `$100` per trade (realistic, low-risk sizing) Commission: 0.02% Slippage: 2 pips Risk per Trade: 5% Number of Trades (backtest period): 181 📊 Performance Overview Symbol: BTC/USD Timeframe: 30-minute chart Date Range: January 1, 2024 – July 3, 2025 Win Rate: 47.8% Profit Factor: 2.01 Net Profit: 173.16 (units not specified) Max Drawdown: 5.77% or 24.91 (0.79%) ⚙️ Indicator Parameters Indicator Name: RSI-Adaptive T3 + Squeeze Momentum RSI Length: 14 T3 Min Length: 5 T3 Max Length: 50 T3 Volume Factor: 0.7 BB Length: 27 (Multiplier: 2.0) KC Length: 20 (Multiplier: 1.5, TrueRange enabled) 🖼 Visual Support T3 slope direction, squeeze status, and momentum bars are visually plotted on the chart, providing high clarity for quick trend analysis and execution. 🔧 Strategy Improvements & Uniqueness Inspired by the RSI Adaptive T3 by ChartPrime and Squeeze Momentum Indicator by LazyBear , this strategy fuses both into a hybrid trend-reversal and momentum breakout detection system . Compared to traditional trend-following methods, it excels at capturing early trend signals with greater sensitivity . ✅ Summary The RSI-Adaptive T3 + Squeeze Momentum Strategy combines momentum detection with volatility-responsive risk management. With a strong balance between visual clarity and practicality, it serves as a powerful tool for traders seeking high repeatability. ⚠️ This strategy is based on historical data and does not guarantee future profits. Always use appropriate risk management when applying it.Pine Script®策略由PakunFX提供146
Tuga SupertrendDescription This strategy uses the Supertrend indicator enhanced with commission and slippage filters to capture trends on the daily chart. It’s designed to work on any asset but is especially effective in markets with consistent movements. Use the date inputs to set the backtest period (default: from January 1, 2018, through today, June 30, 2025). The default input values are optimized for the daily chart. For other timeframes, adjust the parameters to suit the asset you’re testing. Release Notes June 30, 2025 • Updated default backtest period to end on June 30, 2025. • Default commission adjusted to 0.1 %. • Slippage set to 3 ticks. • Default slippage set to 3 ticks. • Simplified the strategy name to “Tuga Supertrend”. Default Parameters Parameter Default Value Supertrend Period 10 Multiplier (Factor) 3 Commission 0.1 % Slippage 3 ticks Start Date January 1, 2018 End Date June 30, 2025Pine Script®策略由pedromto934提供19
LANZ Strategy 1.0 [Backtest]🔷 LANZ Strategy 1.0 — Time-Based Session Trading with Smart Reversal Logic and Risk-Controlled Limit Orders This backtest version of LANZ Strategy 1.0 brings precision to session-based trading by using directional confirmation, pre-defined risk parameters, and limit orders that execute overnight. Designed for the 1-hour timeframe, it allows traders to evaluate the system with configurable SL, TP, and risk settings in a fully automated environment. 🧠 Core Strategy Logic: 1. Directional Confirmation at 18:00 NY: At 18:00 NY, the system compares the 08:00 open vs the 18:00 close: If the direction matches the previous day, the signal is reversed. If the direction differs, the current day's trend is kept. This logic is designed to avoid momentum exhaustion and capture corrective reversals. 2. Entry Level Definition: Based on the confirmed direction: For BUY, the Low of the day is used as Entry Point (EP). For SELL, the High of the day becomes EP. The system plots a Stop Loss and Take Profit based on user-defined pip inputs (default: SL = 18 pips, TP = 54 pips → RR 1:3). 3. Time-Limited Entry Execution (LIMIT Orders): Orders are sent after 18:00 NY and can be triggered anytime between 18:00 and 08:00 NY. If EP is not touched before 08:00, the order is automatically cancelled. 4. Manual Close Feature: If the trade is still open at the configured hour (default 09:00 NY), the system closes all positions, simulating realistic intraday exit scenarios. 5. Lot Size Calculation Based on Risk: Lot size is dynamically calculated using the account size, risk percentage, and SL distance. This ensures consistent risk exposure regardless of market volatility. ⚙️ Step-by-Step Flow: 08:00 NY → Captures the open of the day. 18:00 NY → Confirms direction and defines EP, SL, and TP. After 18:00 NY → If conditions are met, a LIMIT order is placed at EP. Between 18:00–08:00 NY → If price touches EP, the trade is executed. At 08:00 NY → If EP wasn’t touched, the order is cancelled. At Configured Manual Close Time (default 09:00 NY) → All open positions are force-closed if still active. 🧪 Backtest Settings: Timeframe: 1-hour only Order Type: strategy.entry() with limit= SL/TP Configurable: Yes, in pips Risk Input: % of capital per trade Manual Close Time: Fully adjustable (default 09:00 NY) 👨💻 Credits: Developed by LANZ Strategy logic and trading concept built with clarity and precision. Code structure and documentation by Kairos, your AI trading assistant. Designed for high-confidence execution and clean backtesting performance. Pine Script®策略由rau_u_lanz提供已更新 11313