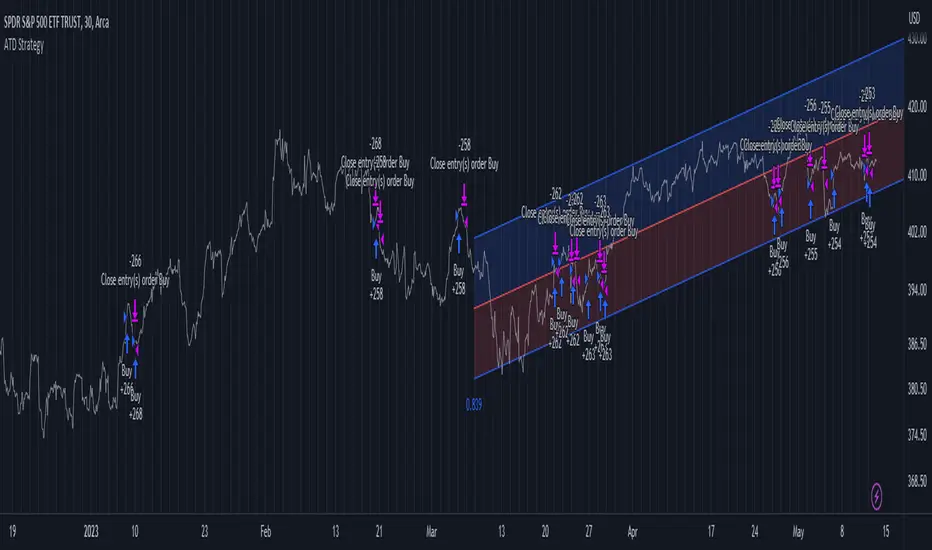
Price Action - Support & Resistance + MACD LONG StrategyUsing "Price Action - Support & Resistance by DGT" and the MACD (Moving Average Convergence Divergence) indicator in TradingView can help develop a trade strategy. Here's a step-by-step approach you can follow:
1. Identifying Support and Resistance Levels: Apply the "Price Action - Support & Resistance by DGT" indicator to your chart. This indicator helps you identify key support and resistance levels based on price action. These levels act as potential areas where the price may reverse or consolidate.
2. Confirming Support and Resistance Levels: Once the indicator has plotted support and resistance levels on your chart, analyze the historical price action around these levels. Look for multiple touches or bounces from the same level, which adds strength to the support or resistance zone.
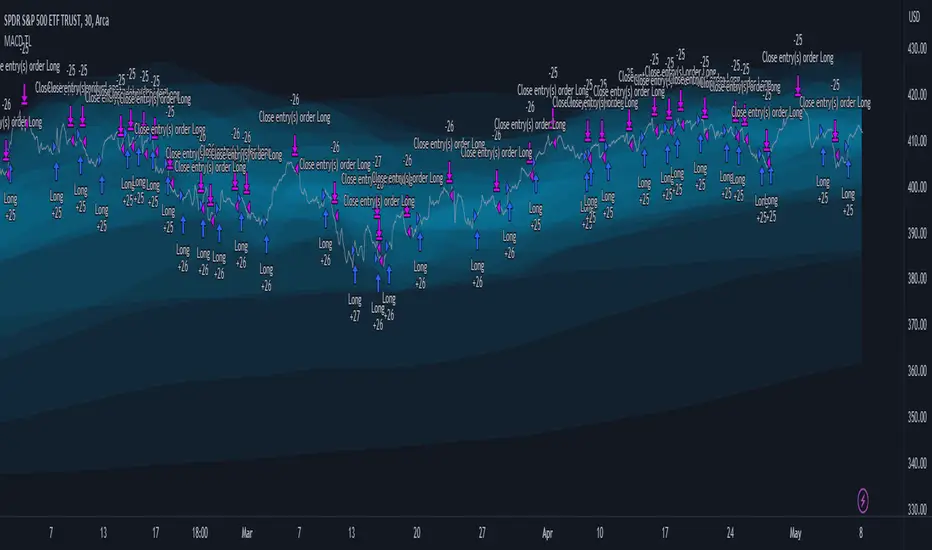
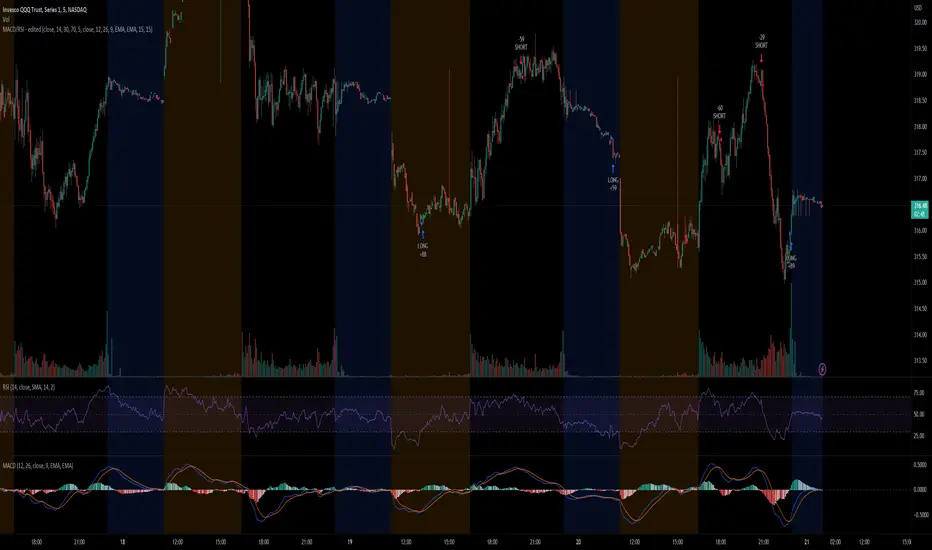
3. Analyzing the MACD Indicator: Add the MACD indicator to your chart. The MACD consists of two lines: the MACD line and the signal line, along with a histogram representing the difference between the two lines. The MACD helps identify momentum and potential trend reversals.
When the MACD line crosses above the signal line and the histogram turns positive, it suggests bullish momentum.
4. Identifying Trade Opportunities:
Bullish Trade: Look for a bullish setup when the price approaches a strong support level identified by the "Price Action - Support & Resistance by DGT" indicator. Wait for the MACD lines to cross above the signal line and the histogram to turn positive, indicating bullish momentum. Enter a long position with a stop loss below the
support level.
Managing the Trade: Once you enter a trade, consider setting a target based on the distance between your entry point and the nearest significant support or resistance level. You can also use trailing stop losses or other risk management techniques to protect your profits and limit potential losses.
Remember that no trading strategy is guaranteed to be successful, and it's important to practice proper risk management and conduct thorough analysis before making any trading decisions. Additionally, it's recommended to backtest and demo trade this strategy before using it with real money.
Pine Script®策略