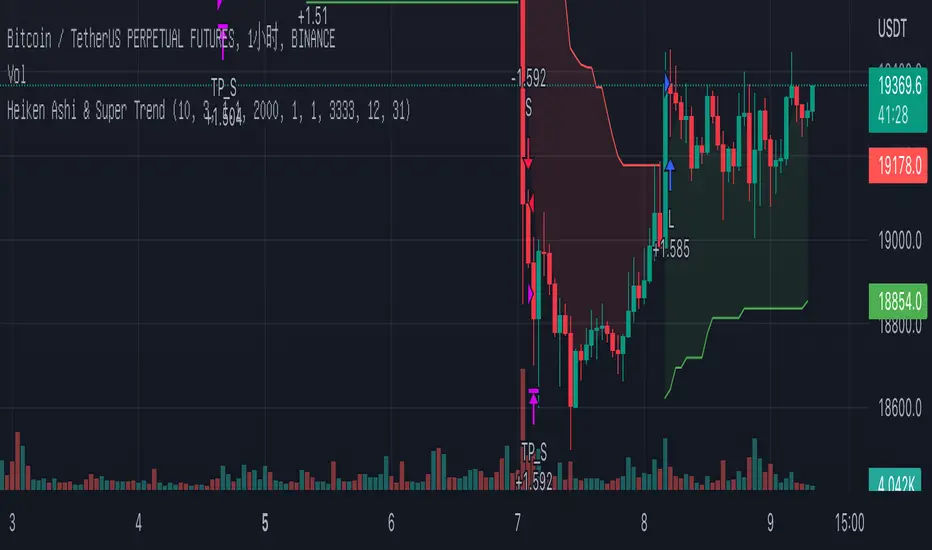
Time of Day and Day of Week Buying and Selling StrategyThis strategy allows you to back test longing or shorting or do nothing during time increments of 30 minutes for various days of the week. For example if you want to see if every Saturday if Bitcoin dropped in value from 1600-7000 UTC, this script will allow you to test that.
Make sure you are in the 30 minute time frame while viewing the performance and trade history.
趨勢分析
Combo Backtest 123 Reversal & RSIThis is combo strategies for get a cumulative signal.
First strategy
This System was created from the Book "How I Tripled My Money In The
Futures Market" by Ulf Jensen, Page 183. This is reverse type of strategies.
The strategy buys at market, if close price is higher than the previous close
during 2 days and the meaning of 9-days Stochastic Slow Oscillator is lower than 50.
The strategy sells at market, if close price is lower than the previous close price
during 2 days and the meaning of 9-days Stochastic Fast Oscillator is higher than 50.
Second strategy
The RSI is a very popular indicator that follows price activity.
It calculates an average of the positive net changes, and an average
of the negative net changes in the most recent bars, and it determines
the ratio between these averages. The result is expressed as a number
between 0 and 100. Commonly it is said that if the RSI has a low value,
for example 30 or under, the symbol is oversold. And if the RSI has a
high value, 70 for example, the symbol is overbought.
WARNING:
- For purpose educate only
- This script to change bars colors.
Monthly Returns in PineScript StrategiesI'm not 100% satisfied with the strategy performance output I receive from TradingView. Quite often I want to see something that is not available by default. I usually export raw trades/metrics from TradingView and then do additional analysis manually.
But with tables, you can build additional metrics and tools for your strategies quite easily.
This script will just show a table with monthly/yearly performance of your script. Quite a lot of traders/investors used to look at returns like that. Also, it might help you to identify periods of time when your strategy performed good/bad than expected and try to analyze that better.
The script is very simple and I believe you can easily apply it to your own strategies.
Disclaimer
Please remember that past performance may not be indicative of future results.
Due to various factors, including changing market conditions, the strategy may no longer perform as well as in historical backtesting.
This post and the script don’t provide any financial advice.
Chanu Delta StrategyThis strategy is built on the Chanu Delta Indicator, which indicates the strength of the Bitcoin market. When the Chanu Delta Indicator hits “Delta_bull” and “Delta_bear” and closes the candle, long and short signals are triggered respectively. The example shown on the screen is a default setting optimized for a 4-hour candlestick strategy based on the Bybit BTCUSDT futures market. For the 15-minute candle, "Delta_bull=32", "Delta_bear=-31", "Source=hlc3" are best. You can use it by adjusting the setting value and modifying it to suit you.
If you use this strategy in conjunction with the Chanu Delta Indicator, it is convenient to anticipate alert signals in advance. Since the Chanu Delta Indicator represents the price difference based on the Bybit BTCUSDT futures market, backtesting is possible from March 2020.
High/Low Channel Multi averages Crypto Swing strategyThis is a swing strategy designed for trending markets such as crypto and stock, with big timeframes , like 8h.
For this strategy we take SMA, EMA, VWMA, ALMA, SMMA, LSMA and VWMA and make an apply them all to both HIGH and LOW separately and make 2 averages, 1 applied to high and the other applied to low.
With them we make a channel.
Rules for entry
For long: close of a candle is above avg applied to high.
For short: close of a candle is below avg applied to low.
Rules for exit
We exit when we either hit TP or SL or when we receive a different condition than the entry one.(long- > short and viceversa)
If you have any questions, let me know !
Swing/Scalper HULL + T3 avg Crypto StrategyThis is a both a swing and a scalper strategy(depends on the timeframe that you use), that works with all timeframes, however I noticed that with swing 3h works the best on most crypto pairs, such as ETH, BTC and so on.
Its main components are:
Hull moving average
T3 moving average
Risk management
With them I make an average and use it as the main moving average.
Rules for entry
For long: Average moving average is bigger than previous average moving average value.
For short:Average moving average is lower than previous average moving average value.
Rules for exit
We exit when either the TP/SL has been hit, or when we get a different condition than previous one(both for long and short).
If you have any questions, let me know !
Aggresive Scalper/Swing Crypto StrategyThis is a simple yet very efficient scalper long strategy adapted for low timeframes for crypto. Can also be used with bigger timeframes as a swinger.
Its main components are:
Price oscillator swing
Vortex
Risk management for TP/SL
Rules for entry
We calculate the difference between the oscillator from the lowest low and the highest high. If the difference is positive, its a long potential. If its negative we exit from the long trade.
At the same time we check that the we have a crossover between the VIP vortex with the VIM vortex part.
Lastly we check that the current candle is bigger the second previous high.
Rules for exit
If we reach the take profit or the stop loss.
If we have a negative difference betwee LL and HH and VIP vortex crossunder with VIM vortex .
In this example I aimed for a 1:10 risk reward ratio, meaing that for every dollar lost, we will gain 10 when we win. Thus having a 10% minimum win rate will give us a profit over many trades.
If you have any questions, let me know !
Hull Crossover Strategy no TP or SLWhat is it?
A simple yet effective strategy ran on the 30m chart.
This is a basic idea that can be expanded on using different indicator to either add signals or filter out certain bad signals!
The strategy consists of 1 fast moving average and 1 slow moving average.
Both of these moving averages are the Hull Moving Average
What is the Hull Moving Average?
The Hull Moving Average ( HMA ) is a directional trend indicator.
It captures the current market conditions and uses recent price action to determine if conditions are bullish or bearish relative to historical data.
The Hull is different from traditional trend indicators like the EMA and the SMA .
It is designed to reduce the lag often associated with other MAs by providing a faster signal on a smoother visual plane.
How it works?
When the fast HMA crosses over the slow HMA , we initiate a long signal, and
when the fast HMA crosses under the slow HMA , we initiate a short signal.
Conclusion
The power of simplicity is what makes this such a great core to use to build onto making something even better!
The results were optimised to suit the most common market conditions seen today.
******** Not financial advice! ********
8 Whittle DownThe system is designed to short on directionally negative instruments like VXX & SQQQ
The system only shorts, no longs
It enters a pilot position if the system has no trades open at the time is in the late afternoon
It uses a 200-day moving average as a filter and will only short if the price is below the 200 day moving average
The pilot position will only enter with 1/3 ( one third ) of the total expected position size
StopLossPerc sets the stop loss, (1.15) means it is set to a 15% stop loss. -- The Red Line
The system will buy additional shares for a full position if the pilot piston profit target was not reached
The full shares position is set to purchase at a higher price. T2EntTrgPerc sets the buy percentage target for the additional shares. -- The Yellow Line
Each entry has different settable profit targets. T1ProfTrgPerc sets the profit target for the first trade (0.95) is basically set to a 5% profit.
T2ProfTrgPerc sets the profit target for the second trade (0.90) is basically set to a 10% profit. -- The White Line
RED LINE == STOP LOSS LINE
GREENLINE == PROFIT TARGET FOR THE 1ST TRADE
YELLOW LINE == ADD ON SHARES TO THE TRADE
WHITE LINE == PROFIT TARGET FOR THE 1st & 2nd TRADE COMBINED
Let me know if you have any questions and I'll try to clarify
Combo Backtest 123 Reversal & Awesome Oscillator (AO) This is combo strategies for get a cumulative signal.
First strategy
This System was created from the Book "How I Tripled My Money In The
Futures Market" by Ulf Jensen, Page 183. This is reverse type of strategies.
The strategy buys at market, if close price is higher than the previous close
during 2 days and the meaning of 9-days Stochastic Slow Oscillator is lower than 50.
The strategy sells at market, if close price is lower than the previous close price
during 2 days and the meaning of 9-days Stochastic Fast Oscillator is higher than 50.
Second strategy
This indicator is based on Bill Williams` recommendations from his book
"New Trading Dimensions". We recommend this book to you as most useful reading.
The wisdom, technical expertise, and skillful teaching style of Williams make
it a truly revolutionary-level source. A must-have new book for stock and
commodity traders.
The 1st 2 chapters are somewhat of ramble where the author describes the
"metaphysics" of trading. Still some good ideas are offered. The book references
chaos theory, and leaves it up to the reader to believe whether "supercomputers"
were used in formulating the various trading methods (the author wants to come across
as an applied mathemetician, but he sure looks like a stock trader). There isn't any
obvious connection with Chaos Theory - despite of the weak link between the title and
content, the trading methodologies do work. Most readers think the author's systems to
be a perfect filter and trigger for a short term trading system. He states a goal of
10%/month, but when these filters & axioms are correctly combined with a good momentum
system, much more is a probable result.
There's better written & more informative books out there for less money, but this author
does have the "Holy Grail" of stock trading. A set of filters, axioms, and methods which are
the "missing link" for any trading system which is based upon conventional indicators.
This indicator plots the oscillator as a histogram where periods fit for buying are marked
as blue, and periods fit for selling as red. If the current value of AC (Awesome Oscillator)
is over the previous, the period is deemed fit for buying and the indicator is marked blue.
If the AC values is not over the previous, the period is deemed fir for selling and the indicator
is marked red.
WARNING:
- For purpose educate only
- This script to change bars colors.
Stock trending strategy This is a long only strategy designed maily for stock markets and futures. In general it works best with 1h, however it can be optimized with other timeframes as well.
Components:
VWAP
MACD histogram
EMA 9
Rules for entry
Long :
For VWAP: close is above the vwap daily
EMA: close is above the moving average
MACD histogram is above 0
Short:
For VWAP: close is belowthe vwap daily
EMA: close is below the moving average
MACD histogram is below 0
Rules for exit
This strategy does not have any risk management inside. Instead it exits whenver it receives an opposite signal form the original one used for entry.
If you have any questions let me know !
Ichimoku with MACD/ CMF/ TSIThis is a very powerful trend strategy designed for markets such as stocks market , stock index and crypto.
For time frames I found out that 1h seems to do the trick.
Components:
Ichimoku full pack
MACD histogram
CMF oscillator
TSI oscillator
Rules for entry
Long :
For Ichimoku:Tenkan part of cloud is bigger than kijun, Chikou is above 0 , close of a candle is above the Senkou
MACD histogram is above 0
CMF oscillator is positive and bigger than 0.1
TSI oscillator is above 0
Short:
For Ichimoku:Tenkan part of cloud is smaller than kijun, Chikou is below 0 , close of a candle is belowthe Senkou
MACD histogram is below 0
CMF oscillator is negative and below -0.1
TSI oscillator is below 0
Rules for exit
This strategy does not have any risk management inside. Instead it exits whenver it receives an opposite signal form the original one used for entry.
If you have any questions let me know !
Combo Backtest 123 Reversal & Awesome Oscillator (AC) This is combo strategies for get a cumulative signal.
First strategy
This System was created from the Book "How I Tripled My Money In The
Futures Market" by Ulf Jensen, Page 183. This is reverse type of strategies.
The strategy buys at market, if close price is higher than the previous close
during 2 days and the meaning of 9-days Stochastic Slow Oscillator is lower than 50.
The strategy sells at market, if close price is lower than the previous close price
during 2 days and the meaning of 9-days Stochastic Fast Oscillator is higher than 50.
Second strategy
This indicator plots the oscillator as a histogram where blue denotes
periods suited for buying and red . for selling. If the current value
of AO (Awesome Oscillator) is above previous, the period is considered
suited for buying and the period is marked blue. If the AO value is not
above previous, the period is considered suited for selling and the
indicator marks it as red.
WARNING:
- For purpose educate only
- This script to change bars colors.
Random Entries Work!" tHe MaRkEtS aRe RaNdOm ", say moron academics.
The purpose of this study is to show that most markets are NOT random! Most markets show a clear bias where we can make such easy money, that a random number generator can do it.
=== HOW THE INDICATOR WORKS ===
The study will randomly enter the market
The study will randomly exit the market if in a trade
You can choose a Long Only, Short Only, or Bidirectional strategy
=== DEFAULT VALUES AND THEIR LOGIC ===
Percent Chance to Enter Per Bar: 10%
Percent Chance to Exit Per Bar: 3%
Direction: Long Only
Commission: 0
Each bar has a 10% chance to enter the market. Each bar has a 3% to exit the market . It will only enter long.
I included zero commission for simplification. It's a good exercise to include a commission/slippage to see just how much trading fees take from you.
=== TIPS ===
Increasing "Percent Chance to Exit" will shorten the time in a trade. You can see the "Avg # Bars In Trade" go down as you increase. If "Percent Chance to Exit" is too high, the study won't be in the market long enough to catch any movement, possibly exiting on the same bar most of the time.
If you're getting the red screen, that means the strategy lost so much money it went broke. Try reducing the percent equity on the Properties tab.
Switch the start year to avoid/minimize black swan events like the covid drop in 2020.
=== FINDINGS ===
Most markets lose money with a "Random" direction strategy.
Most markets lose ALL money with a "Short Only" strategy.
Most markets make money with a "Long Only" strategy.
Try this strategy on: Bitcoin (BTCUSD) and the NASDAQ (QQQ).
There are two popular memes right now: "Bitcoin to the moon" and "Stocks only go up". Both are seemingly true. Bitcoin was the best performing asset of the 2010's, gaining several billion percent in gains. The stock market is on a 100 year long uptrend. Why? BECAUSE FIAT CURRENCIES ALWAYS GO DOWN! This is inflation. If we measure the market in terms of others assets instead of fiat, the Long Only strategy doesn't work anymore (or works less well).
Try this strategy on: Bitcoin/GLD (BTCUSD/GLD), the Eurodollar (EURUSD), and the S&P 500 measured in gold (SPY/GLD).
Bitcoin measured in gold (BTCUSD/GLD) still works with a Long Only strategy because Bitcoin increased in value over both USD and gold.
The Eurodollar (EURUSD) generally loses money no matter what, especially if you add any commission. This makes sense as they are both fiat currencies with similar inflation schedules.
Gold and the S&P 500 have gained roughly the same amount since ~2000. Some years will show better results for a long strategy, while others will favor a short strategy. Now look at just SPY or GLD (which are both measured in USD by default!) and you'll see the same trend again: a Long Only strategy crushes even when entering and exiting randomly.
=== " JUST TELL ME WHAT TO DO, YOU NERD! " ===
Bulls always win and Bears always lose because fiat currencies go to zero.
You're not underperforming a random number generator, are you?
Strategy TemplateTrying to include few basic things which is needed for strategy which can be used as template.
Few important components
Strategy parameters
Few important parameters include - initial_capital, default_qty_type, default_qty_value, commission_type, pyramiding and commission_value. All my strategies will have similar settings with initial captial set to 20000 to 100000. 100% of equity per trade with no pyramiding (set to 1) and minimal commission.
margin_long and margin_short can be used for leveraged trading. But, since we are not using pyramiding, it will make no effect.
Trade Limiting parameters
Two types of limiting is available in the scripts
Limiting trading direction : this is done through method strategy.risk.allow_entry_in and input parameter tradeDirection
Limiting trades to particular time window : This is achieved through adding start time and end time parameters of type input.time and check whether time is within this window
Custom Methods
customized security method to get higher timeframe data
customized moving average method to get moving average of any type
Custom Parameters
Moving average Type option list which I use quite often. Any strategy where there is need to use moving average, I try to scan through different moving average types and lengths to see which one is more appropriate for the given strategy. Hence, keeping this parameter in template to make it readily available when I start with new strategy
waitForCloseBeforeExit - this is used if trailing stop need to activated as soon as price hits the stop or only on close price. This is again something I switch quite often based on strategy. Hence, keeping this as part of the template.
Entry and Exit statements for long and short
These statements from line (57 to 62) can remain as is even with new strategy. Only thing to be set are variables - buyCondition, sellCondition, closeBuyCondition and closeSellCondition
Last but not the least
In pinescript, a long and short position cannot coexist in a strategy at any point of time. Any short positions created will automatically stop long positions and vice versa. Hence, it is important make short and long trades mutually exclusive. In this example, I have used 200 weekly moving average as trend bias. No short positions are taken when price is trading above 200 weekly moving average low/close and no long positions are taken when price is less than 200 weekly moving average high/close. Any rule built on top of this (In this case a simple supertrend rules) ensures that there are no conflicting signals and hence avoids confusing trades on the stratgy.
MACandles-LinearRegression-StrategyThis is combination of multiple indicators and strategies. Mainly useful for indexes and to time the entry and exits of indexes. No stoploss used - makes it less desirable for leveraged trades or trading individual stocks.
Let us rewind and look back at some of the indicators/strategies published earlier.
1. Moving Average Candles - this is one of my favourite tool for general trend filtering. Applying supertrend on moving average candles is one of the easiest ways to find reversal in trending market without exiting positions too early. Few scripts published on this basis are:
MA Candles Supertrend
MA Candles Supertrend Strategy
2. VixFix and Linear Regression - this itself is combination of two indicators.
Williams-Vix-Fix-Finds-Market-Bottoms - by @ChrisMoody
Squeeze-Momentum-Indicator - by @LazyBear
I have combined these two indicators to derive VIX-Fix linear regression to find absolute market bottoms. More description here:
VixFixLinReg-Strategy
VixFixLinReg-Indicator
Now, in this strategy, we combine all these together.
Derive moving average candles
Derive momentum of moving average candles
Derive Linear regression on momentum
Optionally, also calculate VIX Fix and Linear regression on VixFix momentum
To find market bottom:
There are two options
1. Use when momentum of MA candles hit bottom (red) and slowly turn up (orange). In aggressiveLong mode, signals are also generated when momentum starts going positive from negative.
2. Use Vix Fix linear regression of MA candles as described in the original script of VixFixLinReg-Strategy
To find market top
Here only Ma candles momentum decreasing is used as signal. If looking for longTrades , exit signal is generated only when momentum is turning negative extreme(orange). Or else, exit signal is generated when momentum has turned neutral.
At this stage, it is very much experimental - use it with caution :)
Supertrend LSMA long StrategyThis is a long strategy which combines Super trend indicator with LSMA moving average.
In general it tends to works better with long trending markets such as stocks and cryptos using a big timeframe.
The rules are simple
Long entry:
Supertrend is telling us to go long and close of a candle is above moving average
Long exit:
Supertrend is telling us to go short
IF you have any questions, let me know !
Aroon Strategy long onlyThis is a simple long only strategy made of Aroon and Least Square moving average.
The rules are simple:
Long entry = crossover of upper part with the lower part from aroon and close of the candle is above the moving average
Long exit = crossunder of upper part with the lower part from aroon and close of the candle is below the moving average
IF you have any questions let me know !
Pivot Reversal strategy long onlyPivot Point Reversal Strategy
Pivot point reversal strategy is based on the first support level’s price action during the bullish trend and the first resistance level during the bearish trend . Traders follow the main trend and enter into the trade after reversal analyzing pivot point levels.
This version is an upgraded version, combining the initial pivot point reversal strategy together with one of the most accuracy moving average in my opinion for day trade, the Least square moving average.
At the same time I applied an option to backtest using a date range and a leverage calculator.
The default options are optimized for BTC /USDT 2H charts, using 0.1% comission fee.
If you have any questions, let me know
Extremely high win rate FOREX swing strategyTHis is a very simple yet extremely efficient FOREX strategy .
In general it tends to work the best against NZD and AUD pairs, however other major pairs and crosses can work as well.
It's made of a time management, together with MACD , moving average , a price action rule and a risk management.
THe logic behind is the next one :
For LONG:
We have 3 ascending candles.
Histogram of MACD is positive.
Last close of a candle is was above moving average.
If all those previous condition happened before 17/18 UTC time depending if its summer time or not, we enter the trade.
For Short:
We have 3 descending candles.
Histogram of MACD is negative.
Last close of a candle is was below moving average.
If all those previous condition happened before 17/18 UTC time depending if its summer time or not, we enter the trade.
RIsk management
For risk management, since we aim to have a 95%+ win rate, we aim to have a 5:1 or 10:1 risk to reward ratio. Meaning that for each $ we can win, we can lose 5-10$.
THats why I recommend to be extremely careful when playing with leverage with this strategy.
Full Forex scalper StrategyTHis is a FOREX scalping system that can be optimized with almost all majors and crosses pairs.
Its made of multiple elements such as :
MACD
Stochastic RSI
Fast VW moving average
Slow VW moving average
Time management( forex sessions as inputs)
Rules for entry
Long
Last 2 MACD values were ascending, fast moving average is below moving average and stochastic RSI is below 30 level. At the same time we are either into London or NY session.
Short
Last 2 MACD values were descending, fast moving average is above moving average and stochastic RSI is above 70 level. At the same time we are either into London or NY
Rules for exit
WE have 2 exit possibilities: we can exit either at the end of NY/London Session or based on a TP/SL risk management calculating % in movement.
If you have any questions let me know !
Combo Backtest 123 Reversal & 2/20 Exponential MA This is combo strategies for get a cumulative signal.
First strategy
This System was created from the Book "How I Tripled My Money In The
Futures Market" by Ulf Jensen, Page 183. This is reverse type of strategies.
The strategy buys at market, if close price is higher than the previous close
during 2 days and the meaning of 9-days Stochastic Slow Oscillator is lower than 50.
The strategy sells at market, if close price is lower than the previous close price
during 2 days and the meaning of 9-days Stochastic Fast Oscillator is higher than 50.
Second strategy
This indicator plots 2/20 exponential moving average. For the Mov
Avg X 2/20 Indicator, the EMA bar will be painted when the Alert criteria is met.
WARNING:
- For purpose educate only
- This script to change bars colors.
Vwap mtf Swing Stock StrategyThis is a trending strategy designed for stock market, especially long trending assets such as TSLA, NIO, AMAZON and so on.
Its made of volatility bands and weekly VWAP, in this case daily and weekly.
This strategy has been adapted to go long only.
Rules for entry
For long , we want to enter close of a candle is above vwap weekly, and at the same time the close of a candle cross-under the lower volatility band.
For exit , we want to enter close of a candle is below vwap weekly, and at the same time the close of a candle cross-over the upper volatility band.
This strategy does not have a risk management inside, so use it with caution.
If you have any questions, let me know !