Transactional Rate of Change (TROC)TRANSACTIONAL RATE OF CHANGE (TROC) INDICATOR
Transaction Rate of Change (TROC) is an advanced momentum indicator that analyzes the rate of change in cumulative inferred buy/sell volume data to identify shifts in buying and selling acceleration and deceleration of transaction flow, providing early signals of potential trend changes, exhaustion/absorption, and momentum shifts. It builds further upon the official Volume Delta indicator released by TradingView.
If a stock price is a rocket climbing , then volume delta is the total fuel burned, and TROC is the fuel burn rate . A rocket can keep rising even after engines start throttling down (decelerating TROC), but it won't go much higher without more thrust. When TROC shows extreme positive readings, the engines are at maximum burn—expect explosive price movement. When TROC drops to zero while price is still high, the fuel is depleted and gravity (selling pressure) takes over. Are buyers pushing on the gas, or are they backing off? Are more buyers coming to the table, or are they losing interest or taking profits? Are excited retail buying highs while smart money close their positions using the excited retail liquidity?
KEY FEATURES
• Volume Delta Analysis - Approximates up and down volume from lower timeframe data to calculate true buying vs. selling pressure.
• Rate of Change Calculation - Measures the momentum of cumulative delta over a customizable period. Essentially, it displays the rate of change between buying and selling. How fast is it going, is it slowing, how excited are they?
• Momentum State Detection - Automatically identifies four distinct market states: accelerating up, decelerating up, accelerating down, and decelerating down
• Extreme Threshold Zones - Bands based on standard deviation to highlight unusually high or low transaction rates, helping to spot potential extreme values, blow offs, and capitulation.
• Z-Score Normalization - Optional standardization for comparing momentum across different timeframes and instruments.
• Momentum Strength Index (MSI) - Filters out weak signals by highlighting only bars with momentum exceeding a threshold.
• Flexible Reset Modes - Reset cumulative delta daily, weekly, monthly, or per session to prevent data drift, or leave it default for continual cumulative data.
APPLICATION
Trend Confirmation
When price makes a new high but TROC is decelerating (lighter colors), it suggests weakening buying pressure and potential exhaustion. Conversely, strong acceleration (darker colors) confirms robust trend continuation. Either buyers are supporting the move, or they aren't. Same goes for selling. It can also assist spotting short covering.
Divergence Trading
Use it similar to MACD divergence strategies. Is price movement confirmed by expansion in TROC, or is the TROC showing weakness while price is continuing it's trend?
Momentum Breakouts
When TROC crosses above the upper threshold zone with strong momentum (MSI activated), it signals institutional-level buying that often precedes significant price moves. Use this for breakout entries.
Mean Reversion
Extreme readings beyond the threshold zones often precede short-term reversals as transaction rates normalize. Consider taking profits or counter-trend positions when TROC reaches statistical extremes. Utilizing the extreme threshold bands can help you identify tops and bottoms.
Absorption Detection
Spot areas where buying or selling is being done, but price is hitting a wall or floor and not moving. This can indicate a hidden seller or a buyer reloading at price levels/zones.
SETTINGS
Timeframe for Volume Delta Calculation
Select the lower timeframe used to calculate buying and selling volume. Default: 1S (1 second)
• 1S or 5S - Maximum precision for scalping and intraday trading on liquid markets
• 1m or 5m - Balanced precision for swing trading and less liquid instruments
• Higher timeframes - Provide more historical data but reduce accuracy
Note: Higher frequency data yields more accurate delta calculations but may not be available for all symbols or historical periods. If you are using higher timeframes (Daily, Weekly) you will need to change this setting to a higher timeframe.
Rate of Change Period
Determines how many bars back to measure the momentum change. Default: 14
• Short periods (7-10) - More responsive, ideal for scalping and quick momentum shifts
• Medium periods (14-20) - Balanced sensitivity for day trading
• Long periods (25-50) - Smoother readings for swing trading and trend analysis
Shorter periods generate more signals but increase false positives; longer periods reduce noise but may lag significant changes.
Extreme Threshold Zones
Bands that highlight unusual transaction rate extremes based on standard deviation.
• Show Zones - Enable/disable the upper and lower threshold lines (Default: Enabled)
• Multiplier - Standard deviation multiplier for zone placement (Default: 2.0)
Values of 1.5-2.0 catch moderate extremes
Values of 2.5-3.0 identify only the most extreme readings
• Lookback Period - Number of bars used to calculate mean and standard deviation (Default: 100)
Shorter lookback (50-75) adapts faster to changing market conditions
Longer lookback (150-200) provides more stable, consistent zones
Smooth Cumulative Delta
Applies Adaptive Moving Average to reduce noise in the cumulative volume delta before calculating rate of change. Default: Enabled
• Smoothing Length - period (Default: 5)
Lower values (3-5) preserve responsiveness
Higher values (7-10) significantly reduce noise on choppy markets
Smoothing is particularly useful on volatile instruments or when using very short ROC periods.
Momentum Strength Index (MSI)
Filters the histogram to highlight only bars exceeding a specified momentum threshold, eliminating weak signals.
• Show MSI - Enable/disable momentum strength filtering (Default: Disabled)
• MSI Threshold - Minimum momentum strength multiplier (Default: 2.0)
Values of 1.5-2.0 show above-average momentum
Values of 2.5-3.5 isolate only exceptional momentum bars
When enabled, bars meeting the threshold display in the "Strong Up/Down" colors, while normal bars use standard momentum colors.
Display Settings
• Histogram Bar Width - Visual thickness of the columns (Default: 1, Range: 1-10)
• Use Z-Score Normalization - Standardizes TROC values for cross-asset comparison (Default: Disabled)
Enable when comparing multiple instruments or timeframes simultaneously
Z-Score converts values to standard deviations from the mean
• Z-Score Threshold - When using Z-Score Normalization mode, sets the extreme zone levels (Default: 2.0)
Represents standard deviations from mean (2.0 = ~95% confidence interval)
Cumulative Transaction Reset
Determines when the cumulative volume delta resets to zero, preventing infinite accumulation. Default: None
• None - Cumulative delta never resets (continues from symbol history start)
• Daily - Resets at the start of each new trading day
• Weekly - Resets at the start of each week
• Monthly - Resets at the start of each month
• On session change - Resets when market opens (useful for 24-hour markets)
Reset modes prevent cumulative drift that can distort ROC calculations over extended periods.
Color Customization Fully customizable color scheme.
-------------------------------------------------------------------
Note: This indicator requires volume data from your data vendor. It uses inferred buy/sell volume. To learn more, read the TradingView Volume Delta documentation. Optimal performance is achieved on liquid instruments with high-frequency data.
成交量

OutsiderEdge - Adaptive Node Efficiency Function (ANEF)Overview - What is ANEF?
ANEF is a zero-centered oscillator that blends price efficiency, effective volume around VWAP (node proximity), order-flow imbalance (uptick/downtick proxy), and returns volatility into a single, normalized score. The goal is to help you spot efficient breakouts and inefficient mean-reversions in a way that’s transparent, systematic, and easy to align with your own analysis.
Users can combine ANEF’s components to build rules such as: “ Only consider short breakout signals when trend context is bearish and the ANEF score pushes into the Efficient Zone ,” or “ Look for mean-reversion setups when the ANEF score sinks into the Inefficient Zone while trend context remains bullish. ”
While ANEF can stand on its own, it also works well as a secondary confirmation layer to a user’s primary process (volume profile, price action, S/R, market structure, or your preferred overlays).
🔹 FEATURES
Below is each ANEF component/feature in the order that typically leads to the most confluence.
ANEF Core (Normalized Score)
Combines a price change term with effective volume near VWAP and order-flow imbalance, scaled by volatility and normalized into a zero-centered oscillator.
Read it like a pressure gauge: high positive values = efficient upside impulse risk; deep negative values = inefficient pressure that often reverts.
Efficient & Inefficient Zones (Thresholds)
Two user-set levels (default ≥ +4.6 and ≤ −4.6) to quickly see when ANEF pushes into efficient breakout territory (top zone) or inefficient territory (bottom zone).
Thresholds are not overbought/oversold; they’re contextual “efficiency bands.”
2nd-Signal Confirmation (Optional)
An opt-in rule to ignore the first signal of a type and only print the second occurrence within X bars (default 6).
Reduces one-off noise without repainting or lookahead.
Trend Context (EMA-based Wave, Optional)
A lightweight EMA context that lets you filter signals (e.g., only show ▼ in downtrend, only show ▲ in uptrend).
The context is plotted as a sub-pane wave centered around zero so it doesn’t fight for price-panel space.
Clean Alerts (Raw & Confirmed)
Raw alerts fire at zone interactions.
Confirmed alerts respect the 2nd-signal rule and (optionally) the trend filter.
Price-Panel Markers (through force_overlay)
Even with the oscillator in a separate pane, ANEF can print mini markers on the main chart.
Useful to correlate impulses/reversions with structure, S/R, or higher-TF levels.
🔹 USAGE
In the examples below, you see chart snapshot with five labeled points of (in)efficiency breakouts.
ICMARKETS:UK100
Point 1 — Efficient Downside Breakout (▼)
ANEF surges into the Efficient Zone, indicating downside momentum that’s aligned with node volume/imbalance and volatility. Typical use: trend-following continuation, takeprofit on existing long or tightening risk on existing shorts (invalidations above recent structure).
Point 2 — Inefficient Upside Reversion (▲)
First rebound after the selloff with ANEF deep in the Inefficient Zone. Not an ideal long entry on its own, but a good management cue: take partial profits on shorts or tighten stops as an early confirmation that the drop may be exhausting.
Point 3, 4 and 5 — Inefficient Upside Reversion (▲)
Another 3x ▲ appears as price forms a higher low and ANEF prints a less extreme negative reading. With the “second-signal within X bars” option enabled, this becomes a more credible mean-reversion attempt. Possible long entries or takeprofits on existing shorts.
Trading involves substantial risk. This tool is for educational purposes only and is not financial advice. Past performance does not guarantee future results. You are solely responsible for your trading decisions and risk management.
🔹 NAVIGATING MARKET CONDITIONS
Trending phases:
Expect more time in or near the zones in the trend direction.
Consider allowing only trend-aligned signals (filter ON) and using counter zone exits for trail/partials rather than counter-trend trades.
Ranging phases:
Expect frequent dips and surges into the (In)efficient Zones and back.
Counter-moves (▲ in range downs, ▼ in range ups) can be productive with tight invalidation and the 2nd-signal rule to reduce noise.
Regime shifts:
Watch for repeated failures of one side’s signals plus cross-pane confluence (e.g., context flips while ANEF re-anchors around zero).
That sequence often marks transitions where your rules should adapt (e.g., disable the trend filter temporarily or widen your 2nd-signal window).
🔹 SETTINGS SUMMARY
ANEF Core: lengthPrice, lengthVol, lengthVolat, imbalanceCap
Zones: Efficient (≥), Inefficient (≤)
Confirmation: Require 2nd signal, Lookahead bars
Trend Filter: Enable, EMA length, optional smoothing & “only show ▲/▼ with trend”
Chart Markers: Also show on main chart (force_overlay)
Alerts: Raw vs Confirmed (pick what suits your workflow)
🔹 GOOD PRACTICES
Treat signals as context cues, not as mechanical buy/sell calls. You can align ANEF with structure (S/R, HTF bias, LVN, HVN or POC) and risk management (partials on zone exit, invalidation beyond recent swing). Start with defaults; tweak parameters to match your market/TF.
🔹 LIMITATIONS / DISCLAIMER
ANEF does not use lookahead and does not repaint, but no indicator guarantees outcomes.
Thresholds are heuristics; markets can remain efficient/inefficient longer than expected.
Use appropriate position sizing and independent validation.
Trading involves substantial risk. This tool is for educational purposes only and is not financial advice. Past performance does not guarantee future results. You are solely responsible for your trading decisions and risk management.
Release Notes
v1.0 — Initial invite-only release with: normalized ANEF core, Efficient/Inefficient zones, optional EMA trend context, 2nd-signal confirmation, raw & confirmed alerts, and optional price-panel markers via force_overlay.

QuantumFlowTraderQuantumFlowTrader
Adaptive Flow Visualizer with Multi-ATR Volatility Engine and Multi-EMA Clouds
Overview
QuantumFlowTrader is an adaptive market flow visualizer that integrates multiple EMA clouds, a session VWAP framework, and a tested multi-ATR volatility engine.
It is built to help traders interpret directional strength, institutional balance, and volatility synchronization across any asset and timeframe available on TradingView.
How It Works
1. Multi-EMA Clouds — Trend Structure and Flow Context
QuantumFlowTrader employs several EMA-based cloud layers to represent short-, medium-, and long-term structure simultaneously.
Each cloud adapts dynamically to price movement, revealing trend alignment and momentum stacking across depths of the market.
When all EMA clouds align in the same direction, the color gradient intensifies (green for bullish, red for bearish).
When structure conflicts, transparency increases, signaling mixed or transitional phases.
This multi-cloud approach allows traders to see structure, flow, and trend shifts at a glance, eliminating guesswork and highlighting transitions between trend and consolidation.
2. Session VWAP — Institutional Equilibrium and Reaction Zones
The Session VWAP represents the real-time mean price that institutional participants often reference.
QuantumFlowTrader enhances it with tested adaptive deviation envelopes, which highlight zones where price frequently reacts or pauses.
These deviation zones dynamically expand or contract with volatility, defining institutional fair-value regions and potential continuation or mean-reversion boundaries.
VWAP color automatically changes based on whether price trades above or below the equilibrium, giving immediate visual feedback on session bias.
3. QuantumFlow ATR Engine — Core Innovation
At the heart of QuantumFlowTrader is its proprietary multi-ATR engine, a deeply tested system that runs multiple ATR calculations and deviation layers at the same time.
Unlike single-metric approaches, this composite engine merges several ATRs with different sensitivities and deviations to identify synchronized volatility alignment.
When all ATR layers align bullish, a green up-arrow appears below the bar.
When all align bearish, a red down-arrow appears above the bar.
This configuration has been tested for many years across market types and volatility regimes.
Its goal is to detect moments when price action, volatility, and structure converge, which historically coincide with the start or continuation of strong directional flows.
This multi-ATR architecture is what makes QuantumFlowTrader genuinely unique among volatility-based systems.
Adaptability Across Assets and Timeframes
QuantumFlowTrader is universally adaptable:
Works effectively on any timeframe, from scalping to swing or position trading.
Performs consistently across Forex, Stocks, Indices, Commodities, and Crypto.
The internal algorithms automatically adjust their sensitivity and scaling to the selected chart’s behavior, ensuring smooth adaptation to different volatility environments.
This makes it suitable for traders who want a consistent analytical framework adaptable to both short-term and long-term contexts.
Customization and Alerts
EMA Clouds: adjust colors, transparency, and visibility for each structural layer.
VWAP Zones: toggle the equilibrium line and deviation visualization.
ATR Arrows: control arrow appearance and size for bullish/bearish events.
Dynamic Scaling: built-in adaptive multiplier auto-balances volatility response.
Built-in alerts:
Buy Condition: all ATR layers bullish and price above VWAP.
Sell Condition: all ATR layers bearish and price below VWAP.
These alerts identify situations where both directional flow and volatility alignment agree.
Originality and Value
QuantumFlowTrader is not a mash-up of public indicators.
Its originality lies in how it integrates:
Multiple EMA clouds for layered structural analysis.
Session VWAP with adaptive deviation zones to reveal institutional equilibrium and price reactions.
A proprietary multi-ATR engine that combines several ATR and deviation configurations simultaneously for volatility confirmation.
Together, these systems produce a unified, adaptive visualization of market structure, volatility, and flow — helping traders stay aligned with dynamic directional conditions while filtering out low-efficiency noise.
Example — Multi-Timeframe Integration (Optional Use)
While QuantumFlowTrader works effectively on any single chart, many traders use a three-screen workflow to synchronize trend, momentum, and execution:
1 Screen: 15-minute, Defines dominant trend direction (multi-EMA cloud + VWAP bias).
2 Screen: 5-minute, Confirms flow alignment and momentum coherence.
3 Screen: 1-minute, Executes entries when ATR arrows appear in the same direction as the 15-minute trend.
Example workflow:
1. Identify overall direction from 15m cloud and VWAP structure.
2. Wait for 5m confirmation.
3. Time entries on 1m using ATR arrows aligned with the higher timeframe.
This structure enhances precision and reduces counter-trend exposure.
Best Practices and Limitations
Always use proper risk management and forward testing before applying live.
Author’s Instructions:
To request access, please contact the author through the TradingView profile.

AUD/USD Optimized Sentiment Pro By Revan BlezinskyAUD/USD Global Sentiment Pro is an advanced trading indicator that combines both technical and fundamental analysis to provide comprehensive sentiment signals for the AUD/USD currency pair.
Key Features:
Multi-Timeframe Analysis: Utilizes daily data from key financial instruments including DXY (US Dollar Index), XAU/USD (Gold), CNY/USD (Chinese Yuan), SPX (S&P 500 Index), and AUD/CAD for a holistic view.
Dynamic Scoring System:
Fundamental Score: Weighted changes in DXY, Gold, CNY, SPX, and AUD/CAD.
Technical Score: Based on EMA crossovers (13, 48, 89), RSI with dynamic levels, and trend direction.
Momentum Confirmation: MACD for additional momentum insight.
Adaptive Thresholds: Uses moving average and standard deviation of the total score to generate dynamic buy/sell thresholds.
Risk Management: Includes ATR-based stop loss and take profit levels, and limits the number of signals per day to avoid overtrading.
Advanced Filtering:
Volume spike detection
Volatility filter (high/low/normal)
Trend filter (using 89 EMA)
Parameters:
EMA Lengths: Fast (13), Slow (48), Trend (89)
RSI Length: 14
Dynamic Lookback: 55 periods
Risk/Reward Ratio: 1.5
Max Signals Per Day: 3
Signals:
Bullish: Total score above dynamic threshold and above zero, with trend and volume confirmation.
Bearish: Total score below dynamic threshold and below zero, with trend and volume confirmation.
This indicator is designed for traders who want to incorporate both technical and fundamental factors into their trading decisions, providing a systematic approach to trading the AUD/USD pair.

HVIB UltimateThis script shows specific VIBs (volume imbalances) Customizable
HVIB - shows all HVIBS for short/ long, timeframe customization (current, 10, 15), colour customization, Fill close customisation (body/wick, number of closes needed to stop showing it as a valid)
2: FVIB indicator - shows two types of Failed vibs
FHVIBs (basicaly HVIBS but only those failed ones)
FVIB - Vib between two same candles closed by the third opposite candle (failed vib)
I like to have those two indicators three times copied for each timeframes /HVIBS 3 times and Fhvibs three times. to turn in quickly on and off and look which timeframes are aligned (which is even stronger I believe)

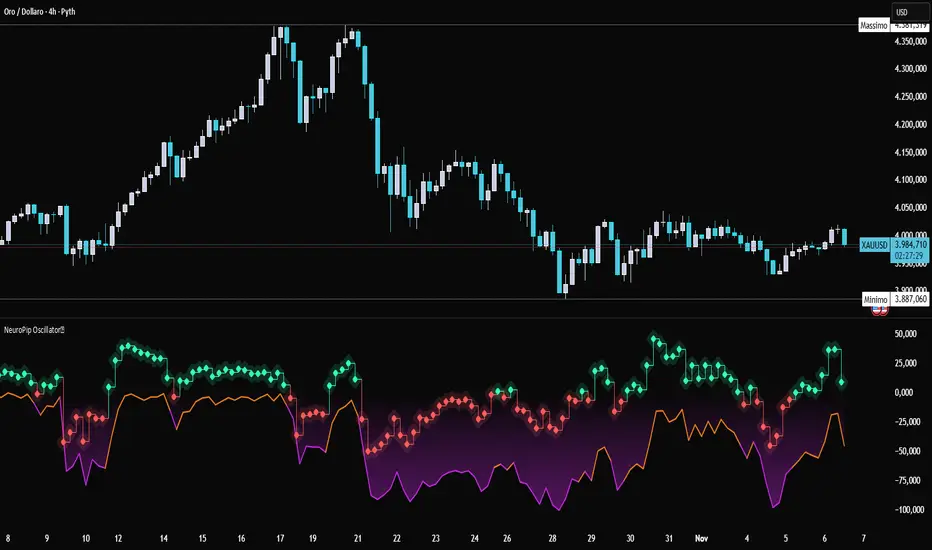
NeuroPip OscillatorNeuroPip Oscillator – Adaptive Momentum Oscillator with Deviation “Bursts”
Indicator published by PipGuard.
NeuroPip Oscillator is an adaptive momentum oscillator displayed in a separate panel , designed to read market momentum and regime shifts through a dynamically adjusted signal line.
The main signal ( NeuroPulse ) changes color according to the active regime, while the Synapse Burst line highlights real-time deviations and momentum acceleration phases.
How it Works
• Non-Classical Logic:
Unlike conventional 3-candle swing models, NeuroPip uses a custom adaptive mechanism that blends trend behavior , volatility , and closing dynamics over a dynamic bar range .
This allows the oscillator to filter noise and focus on true structural impulses , rather than random fluctuations, producing smoother and more reliable regime detection.
• Color Shift & Waves:
The NeuroPulse line turns orange in bullish phases and violet in bearish phases.
A Colour fill between the signal and baseline visually represents the intensity and direction of momentum in real time.
• Synapse Burst (Active Deviation):
The Synapse Burst line measures the distance between the momentum curve and its adaptive baseline, revealing acceleration "bursts" or momentum drops as they occur.
How to Use
1. Add the oscillator to your chart (separate panel).
2. Read the color of the signal to determine the current market regime (bullish/bearish).
3. Observe the wave strength to gauge momentum continuity and pressure .
4. Use Synapse Burst spikes to confirm acceleration or deceleration in price movement.
5. Combine its insights with your risk management and main chart analysis.
EXAMPLE OF USE
EXAMPLE OF USE
Settings
• All parameters are internally preconfigured for stability and visual consistency.
• Colors and waves are optimized and not user-editable.
• Works on all markets and timeframes (panel overlay=false ).
Alerts (Recommended to Enable)
Two built-in alerts trigger on bar close when the regime changes:
• Bullish Cross → signal turning bullish .
• Bearish Cross → signal turning bearish .
Each alert includes the symbol and timeframe , ensuring you never miss a regime shift even when you’re away from the screen.
Limitations
• The oscillator confirms regime changes; it does not predict them.
• In low-volatility environments, transitions may appear more frequent.
• Past performance does not guarantee future results .
Access
This script is available under invite-only access .
To request access, use the link provided in the Signature below the publication.
Note: Technical analysis tool designed to study price momentum and structure. It does not constitute financial advice or guarantee performance.
Indicator published by PipGuard.
SRD
SRD v11 - Multi-Timeframe Volume Profile (POC, VAH, VAL)
Key Features
Dual Timeframe Analysis:
📈 Main Analysis (Daily): Calculates and displays the most significant levels based on a user-defined period of daily bars. This is ideal for identifying intraday and short-term trading opportunities.
📊 Strategic Analysis (Weekly): Plots key levels from a weekly perspective, giving you a broader, long-term view of market sentiment and structure. This can be toggled on or off.
Volume Profile Core Levels: The indicator automatically calculates and visualizes the three most important levels derived from volume analysis for both timeframes:
🎯 POC (Point of Control): The price level with the highest traded volume for the specified period. It acts as a powerful magnet for price and a key reference for market equilibrium.
🔴 VAH (Value Area High): The highest price level within the "Value Area" (where ~70% of the volume was traded). It often acts as a significant resistance zone.
🟢 VAL (Value Area Low): The lowest price level within the Value Area. It often serves as a strong support zone.
🟠 24-Hour High: An optional feature that plots the highest price reached in the last 24 hours, providing a crucial reference point for breakout and reversal traders.
Dynamic and Non-Repainting: The levels are calculated based on historical confirmed bars and update automatically as new periods (daily or weekly) close. The lines extend to the right, remaining relevant until a new calculation period begins.
Integrated Alert System: Never miss a key price interaction. The indicator includes a comprehensive alert system for:
Breakouts: Triggers when the price crosses above or below the POC, VAH, or VAL.
Touches: Triggers when the price touches one of these key levels without breaking through it (within a small tolerance).
Unified Alert: A single alert that notifies you of any of the above conditions.
Customization
The SRD v11 is fully customizable to fit your trading style. You can adjust:
Timeframes: Change the base timeframes for both the main (default Daily) and strategic (default Weekly) analysis.
Analysis Periods: Define the number of bars (days or weeks) to include in the Volume Profile calculation.
Visuals: Customize the color, width, and style (solid, dashed, dotted) of every line and label for clear and intuitive visualization.
Toggle Elements: Easily show or hide the strategic (weekly) analysis and the 24-hour high line.
How to Use It >
Identify Key Zones: Use the VAH (resistance) and VAL (support) lines to identify potential entry and exit zones. The area between VAH and VAL is the "Value Area," where the market has found acceptance.
Monitor the POC: The Point of Control is the ultimate level of equilibrium. Watch for price reactions around the POC. A sustained break above or below can signal a new trend.
Combine Timeframes: Use the strategic (weekly) levels as major, long-term points of interest and the main (daily) levels for your day-to-day trading setup. Confluence between levels from different timeframes can indicate extremely strong support or resistance.
Set Alerts: Configure alerts for breakouts or touches to be notified of critical market movements in real-time, even when you are away from the charts.

Dynamic FVG & Trap Zones📘 Dynamic FVG & Trap Zones (DFTZ)
A Hybrid Model Combining Imbalance Mapping, Volume Behavior, and Trap Detection
Concept Overview
“Dynamic FVG & Trap Zones” is built to visualize real-time Fair Value Gaps (FVGs) and identify liquidity trap events inside those gaps using adaptive volume filters and wick-based logic.
Traditional FVG indicators merely mark imbalance zones between consecutive candles, but this model goes further — it measures how volume reaction and price penetration inside those zones reveal potential f alse moves or trap formations by smart money.
⚙️ How It Works
1. FVG Detection
• A Bullish FVG is detected when low > high , showing a price void left by aggressive buying.
• A Bearish FVG forms when high < low , implying a selling imbalance.
• These zones are automatically drawn as semi-transparent boxes that extend forward for 10 bars and decay once they exceed the configurable lookback window.
2. Volume Normalization & Grading
• Every bar’s volume is compared against a dynamic SMA( volLookback ) average to calculate a Volume Grade = current vol / avg vol.
• Only bars exceeding the Min Volume Grade threshold are eligible to generate valid FVG zones, ensuring that low-participation moves are ignored.
• The Trap Volume Threshold sets how quiet the reaction bar must be (relative to average volume) to qualify as a trap event.
3. Trap Detection Logic
• Each active FVG zone monitors incoming candles.
• A potential trap is triggered when price re-enters the zone (body or wick depending on settings) but fails to expand with confirming volume.
• If the event occurs inside a Bullish FVG, it marks a Bear Trap (green zone turned red).
If it happens inside a Bearish FVG, it flags a Bull Trap (red zone turned green).
• This reversal in zone color visually conveys trapped liquidity and potential directional fade.
4. Exclusivity and Cooldown Control
• To avoid signal clustering, you can choose exclusivity modes:
Allow Both, Bear over Bull, or Bull over Bear.
• A built-in per-signal cooldown timer prevents back-to-back plots of the same type, enhancing signal clarity during rapid price action.
5. Adaptive Visualization
• Wick-based vs body-based trap detection (toggleable).
• Optional cooldown filtering on shapes ensures the chart only displays validated events.
• Old FVG boxes are pruned automatically beyond the chosen lookback horizon.
🧠 Why It’s Different
Unlike static FVG detectors or simple liquidity sweep tools, DFTZ blends:
• Volume context (Smart Volume Grade filtering)
• Behavioral trap detection within imbalance zones
• Dynamic cooldown mechanics that control over-signaling
• Forward-propagating zones that self-expire gracefully
This synergy makes it a compact yet powerful tool for visualizing imbalances + liquidity traps in one framework — ideal for discretionary traders combining SMC concepts with volume analytics.
📈 How to Use
• Primary Context: Use on 15 min to 1 h charts to spot active FVG zones forming after impulsive moves.
• Trap Signal Interpretation:
• 🔴 “Trap” below bar → Bullish reversal (Bear Trap).
• 🟢 “Trap” above bar → Bearish reversal (Bull Trap).
• Combine With: Market structure breaks, VWAP, or delta volume tools to confirm true reversal intent.
• Alerts: All major events (FVG creation & trap confirmation) trigger ready-to-use alerts for automation or back-testing.
🧩 Customization
Setting Function
Max FVG Lookback Controls how long old zones remain active.
Volume SMA Period Defines the baseline for volume grading.
Min Volume Grade & Trap Volume Threshold Tune the sensitivity of trap confirmation.
Wick-Based Trap Detection Enable to capture wick rejections inside zones.
Signal Cooldown Prevents rapid multiple plots on successive bars.
⚠️ Disclaimer
This tool is designed for educational and analytical purposes only. It does not constitute financial advice or guarantee trading performance. Always conduct your own analysis and risk management before entering a position.

God of Scalping BTCUnleash divine precision in the chaotic realm of BTC scalping with the God of Scalping BTC—a bespoke, price-action powerhouse crafted for lightning-fast entries and exits on 1-5 minute charts. Forged from raw momentum velocity (no recycled RSI or MACD here), this indicator detects micro-trend accelerations to pinpoint surge moments where BTC's volatility bends to your will.Core Mechanics:Velocity Engine: Calculates fast (default: 3-bar) and slow (default: 8-bar) price speeds, then derives normalized acceleration using ATR (14-bar) to filter noise in BTC's wild swings.
Surge Detection: Smoothed signal line confirms crossovers—bullish when acceleration surges above signal with positive bias; bearish on the downside.
Volume Guardian: Triggers only on 20%+ volume spikes above its EMA (10-bar), ensuring conviction behind the chaos.
Visual Oracle:Blue/Red Lines: Fast (EMA close, 3-bar) and slow (EMA close, 8-bar) velocity trends for trend context.
Background Glow: Subtle green/red tint for real-time momentum bias.
Divine Arrows: Green triangles below bars for BUY surges; red above for SELL—your scalp signals from the heavens.
Scalping Ritual:Optimal Altar: Load on BTCUSD/USDT (1m-5m). Tune lengths for your broker's feed.
Invocation: Enter long on green arrow (target 0.1-0.3% gains), short on red. Tight stops at recent swings; exit on opposite signal or threshold breach (1.5x mult).
Alerts: Built-in notifications—"God Surge Buy: BTC Scalp Entry!"—to summon you mid-prayer (er, trade).
Backtested for BTC's fury, this isn't a holy grail, but a scalper's Excalibur: pure, adaptive, and unyielding. Trade wisely—markets are mortal, your edge is eternal.

Volumemetrix Variance StrategyThe “Volumemetrix Variance Strategy” is an advanced Pine Script strategy designed to identify trade entries and exits using a combination of volume profile analysis, candle structure, and volatility filters. It constructs a dynamic volume profile over a specified lookback period to identify critical price levels such as the Point of Control (PoC), Value Area High (VAH), and Value Area Low (VAL). These levels represent zones of high trading activity that often act as support and resistance. The script smooths and adjusts these levels across different timeframes to align short-term market structure with higher-timeframe trends. It incorporates a variety of filters to exclude doji candles, detect continuation or rejection patterns, and confirm alignment with higher timeframe candle direction (e.g., 4-hour bullish or bearish bias).
Trade logic is built around detecting crossovers and breakouts relative to the PoC and value areas. The system can trigger entries based on several configurable behaviors: breakout, retake, bounce, reversal, or rejection near key volume zones. It supports flexible entry conditions for long, short, or both sides of the market, as well as a range of customizable settings for time-based trading restrictions, end-of-day position closures, and alert-based data capture. For execution, the script includes integrated risk management—users can specify take-profit and stop-loss levels, enable moving (trailing) stops, and even apply a “power curve” model to dynamically adjust trailing stops using exponential decay logic that adapts to price progress.
Overall, the Volumemetrix Variance Strategy is a hybrid between a quantitative volume-based strategy and a volatility-adaptive trade manager. It combines fixed range volume profiling with multi-timeframe confirmation, candle pattern validation, and adaptive exit logic. Its architecture allows for detailed trade automation, alert generation for external systems, and real-time control over parameters such as ATR scaling, entry delay, or bar confirmation. The result is a high-granularity framework for both backtesting and live execution that seeks to capture statistically favorable setups around liquidity concentration zones.


coinbot_ICT_Unicorn(AUTOTRADE)1. 🎯 핵심 기능: 자동매매 신호 전송 (Webhook)
이 스크립트는 매매 신호가 발생할 때마다, 사용자가 '자동매매 설정(Autotrade Settings)'에 입력한 값들을 조합하여 구체적인 JSON 메시지를 생성하고 alert() 함수를 통해 웹훅으로 전송합니다.
입력 설정: user_id, exchange(거래소), leverage(레버리지), capital_percent(투입 시드 %), sl_percent(손절 %), 그리고 3단계 분할 익절(tp1_price_percent, tp1_qty_percent 등) 설정을 입력받습니다.
신호 종류:
ENTRY (진입): 매수(buy) 또는 매도(sell) 신호가 발생하면, 위 모든 설정값을 포함한 진입 명령을 보냅니다.
CLOSE (손절): 전략의 내부 로직에 의해 손절가에 도달하면(slAlertTick), 포지션을 종료하라는 신호를 보냅니다.
TAKE_PROFIT (익절): 목표가에 도달하면(tpAlertTick), 설정된 물량만큼 익절하라는 신호를 보냅니다.
2. 📈 작동 원리: "ICT 유니콘" 매매 전략
이 스크립트의 진입 로직은 ICT(Inner Circle Trader) 개념 중 하나인 **'유니콘 모델'**을 따릅니다.
구성 요소 식별:
Breaker Block (BB): '브레이커 블록'을 식별합니다. 이는 특정 고점/저점을 만든 후 그 방향으로 가지 못하고 반대 방향으로 돌파(Break)된 오더 블록(Order Block)입니다.
Fair Value Gap (FVG): '공정 가치 갭' (가격 불균형 영역)을 식별합니다.
핵심 진입 신호 (Unicorn): 이 전략의 핵심 진입 조건은 **Breaker Block(BB)과 Fair Value Gap(FVG)이 중첩(Overlap)**되는, 소위 '유니콘'이라 불리는 강력한 지지/저항 영역이 발생하는 것입니다.
Long (매수) 진입:
가격이 하락하며 **'하락형 브레이커 블록(Bearish Breaker Block)'**을 만듭니다.
이후 가격이 상승 돌파하며 이 브레이커 블록 영역과 중첩되는 **'상승형 FVG(Bullish FVG)'**를 생성합니다.
이 중첩 영역(FVG-BB Overlap)이 바로 매수 진입의 근거가 됩니다. (코드가 dbgRequireRetracement 설정에 따라 FVG로의 되돌림을 기다리거나 즉시 진입 신호를 보냅니다.)
Short (매도) 진입:
가격이 상승하며 **'상승형 브레이커 블록(Bullish Breaker Block)'**을 만듭니다.
이후 가격이 하락 돌파하며 이 브레이커 블록 영역과 중첩되는 **'하락형 FVG(Bearish FVG)'**를 생성합니다.
이 중첩 영역이 매도 진입의 근거가 됩니다.
3. 📊 부가 기능
시각화: 차트 상에 FVG 영역과 Breaker Block 영역을 박스로 그려주어(설정에 따라 표시/숨김 가능) 매매 근거를 시각적으로 확인할 수 있게 합니다.
백테스팅 대시보드: 차트 우측 상단(기본값)에 이 전략의 누적 성과(총 진입 횟수, 승/패, 승률, 총수익률)를 보여주는 대시보드를 표시합니다.
요약
이 스크립트는 **"Breaker Block과 FVG의 중첩(유니콘 모델)"**을 유일한 진입 조건으로 사용하는 매우 구체적인 ICT 전략입니다. 이 조건이 충족되면, 사용자가 미리 설정한 상세한 리스크 관리 값들을 담아 자동매매 봇으로 즉시 실행 가능한 주문 신호를 전송하는 '올인원(All-in-One)' 전략 스크립트입니다.
요청하신 대로, 해당 지표 요약본을 영어로 번역하여 제공합니다.
This script is an automated trading (Autotrade) strategy signal generator based on the ICT "Unicorn" trading model.
As the "AUTOTRADE" in its name implies, the core purpose of this indicator is to detect specific conditions on the chart and send JSON-formatted order signals (webhooks) to an external automated trading bot.
Here are the core mechanics and features of this script:
1. 🎯 Core Feature: Automated Signal Transmission (Webhook)
Whenever a trade signal occurs, this script generates a specific JSON message by combining the values entered by the user in the "Autotrade Settings" and sends it via webhook using the alert() function.
Input Settings: It takes inputs for user_id, exchange, leverage, capital_percent (equity %), sl_percent (stop loss %), and settings for 3-stage split take-profits (e.g., tp1_price_percent, tp1_qty_percent).
Signal Types:
ENTRY: When a "buy" or "sell" signal occurs, it sends an entry command including all the settings above.
CLOSE (Stop-Loss): If the price hits the stop loss according to the strategy's internal logic (slAlertTick), it sends a signal to close the position.
TAKE_PROFIT: When a profit target is reached (tpAlertTick), it sends a signal to take profit on the specified quantity.
2. 📈 How It Works: The "ICT Unicorn" Strategy
The script's entry logic follows the "Unicorn Model," one of the concepts from ICT (Inner Circle Trader).
Identifying Components:
Breaker Block (BB): It identifies a "Breaker Block." This is an Order Block that, after creating a specific high/low, fails to continue in that direction and is instead broken through in the opposite direction.
Fair Value Gap (FVG): It identifies a "Fair Value Gap" (a price imbalance area).
Core Entry Signal (The Unicorn): The core entry condition for this strategy is the overlap of a Breaker Block (BB) and a Fair Value Gap (FVG), which creates a powerful support/resistance zone known as the "Unicorn."
Long Entry:
Price moves down, creating a "Bearish Breaker Block."
Subsequently, price breaks upward, creating a "Bullish FVG" that overlaps with this Breaker Block area.
This overlapping area (FVG-BB Overlap) becomes the basis for the long entry. (Depending on the dbgRequireRetracement setting, the code either waits for a retracement to the FVG or sends an immediate entry signal.)
Short Entry:
Price moves up, creating a "Bullish Breaker Block."
Subsequently, price breaks downward, creating a "Bearish FVG" that overlaps with this Breaker Block area.
This overlapping area becomes the basis for the short entry.
3. 📊 Additional Features
Visualization: It draws the FVG and Breaker Block zones as boxes on the chart (can be toggled in settings), allowing for visual confirmation of the trade setup.
Backtesting Dashboard: It displays a dashboard in the top-right corner (by default) showing the strategy's cumulative performance (total entries, wins/losses, win rate, total profit).
Summary
This script is a highly specific ICT strategy that uses the "overlap of a Breaker Block and an FVG (the Unicorn Model)" as its sole entry condition. When this condition is met, it transmits an immediately executable order signal to an automated trading bot, complete with all the detailed risk management values preset by the user. It is an "all-in-one" strategy script.

CoinBot_Volumatic VIDYA Strategy이 스크립트는 **"모멘텀에 적응하는 VIDYA와 ATR 밴드를 이용한 돌파 추세 추종 전략"**입니다.
트렌드가 시작되는 지점(밴드 돌파)에서 진입 신호를 발생시키고, 이 신호를 JSON 메시지로 만들어 자동 매매 봇으로 전송하는 올인원(All-in-One) 전략 스크립트입니다. 사용자는 리스크 관리 설정(SL/TP)과 웹훅 정보만 입력하면 됩니다.
This script is "a breakout trend-following strategy using momentum-adaptive VIDYA and ATR bands."
It generates entry signals at the point where a trend begins (a band breakout), converts these signals into a JSON message, and sends them to an automated trading bot. It is an all-in-one strategy script. The user only needs to input their risk management settings (SL/TP) and webhook information.

The Machine – Smart Zones PRO The Machine – Smart Zones PRO
Overview
The Machine – Smart Zones PRO is a multi-component analytical indicator that identifies key market structure zones, trend alignments, and potential confluence areas using a weighted probability model. It’s designed to map price behavior around support and resistance pivots while integrating higher-timeframe trend and volatility data for confirmation.
Core Logic
The indicator combines four analytical modules to generate its visualization and probability metrics:
Trend Analysis
Calculates short-term trend using a moving-average filter (SMA) and ATR-based volatility structure.
Confirms directional bias from a user-selected higher timeframe for multi-timeframe alignment.
Volatility and Confirmation
Detects volume spikes relative to the moving average of volume to confirm activity strength.
Generates bar-confirmed buy/sell signals when local and higher-timeframe trends align with volatility expansion.
Smart Zone Mapping
Uses pivot-based detection on the selected timeframe to locate reaction highs and lows.
Converts those pivots into adaptive “Smart Zones” (highlighted boxes) extended forward in time to represent potential support/resistance regions.
Old zones are automatically cleared to keep the chart optimized.
Confluence Logic
Calculates the proximity of price to existing Smart Zones and scores confluence strength.
When trend, volatility, and zone alignment agree, the system marks a “Buy” or “Sell” confluence marker.
Scoring and Probabilities
Each signal and zone evaluation is expressed as a weighted probability. The model blends four weighted components:
Local trend (wTrend)
Higher-timeframe alignment (wHTF)
Volume confirmation (wVol)
Proximity to Smart Zones (wZone)
These weights produce two probability values — Buy Probability and Sell Probability — that update in real time and can be visualized as continuous plot lines.
Visual Elements
Smart Zones: Dynamic colored boxes marking pivot-based support and resistance regions.
Trendlines: Optional horizontal extensions from local pivots.
Signal Markers: Buy/Sell labels appear only after confirmed bar closes.
Confluence Markers: Triangular symbols when price interacts with significant zones during aligned trend conditions.
Dashboard Panel: Displays the latest signal, probability score, active trend direction, and potential next directional bias.
Use Case
This indicator helps visualize market structure shifts, identify high-probability confluence areas, and monitor how price interacts with statistically significant zones. It can be applied to any timeframe or instrument for structural confirmation or bias observation.
Disclaimer
This script is for technical analysis and educational purposes only. It does not provide trade recommendations or financial advice.

VWAP Reversion (Sequential Stats + Profit/Loss Points)First time posting. This is my attempt to evaluate the effectiveness of VWAP reversion. I decided to make this an indicator with its own integrated stats.
If you set the session length to lets say 100, but choose a 1 minute timeframe, it will only load as many sessions as the chart will allow for that timeframe. increasing the timeframe will allow you to go back further with more sessions.
I plan to implement more and more as I refine it. I just wanted to get my working copy out into the universe. I'd like to add some method of "scaling in". Perhaps if the price goes further and further away from the original entry, say for each additional std. deviation band further, it could add another entry signal.
My trading journey is just beginning, I've never coded before, and this was made entirely through the fusion of my attempt to communicate the ideas in my head for ChatGPT to turn into code!

Delta Money Flow IndexThe Delta Money Flow Index is a modified version of the traditional Money Flow Index that uses directional volume instead of total volume to measure buying and selling pressure in a different way.
It helps traders identify overbought/oversold conditions based on actual buy/sell pressure rather than just total volume. It's designed for traders who want to see if price movements are backed by genuine buying or selling activity.
How to use it:
- Values above 80 indicate overbought conditions
- Values below 20 indicate oversold conditions
- The 50 level acts as a neutral zone. Above suggests buyers are in control, below suggests sellers are in control.
- Traders can check for divergences for potential reversal signals
- Works best on intraday timeframes where delta volume is most meaningful
What makes it different:
Unlike the standard MFI which uses total volume, the Delta MFI calculates an approximation of volume delta by assigning positive volume to up-closing candles and negative volume to down-closing candles.
This means:
- It focuses on directional pressure, not just activity
- Filters out low-conviction volume that doesn't move price
- Provides clearer signals when actual buying/selling dominates
The indicator includes visual aids like background colors for overbought/oversold and a fill showing whether the Delta MFI is above or below the 50 midpoint for quick interpretation.

Rolling VWAP Indicator🧭 Rolling VWAP Indicator
Overview
The Rolling VWAP Signals indicator offers a clean, real-time view of price behavior relative to its volume-weighted fair value.
It extends the traditional VWAP concept by introducing a Rolling VWAP that continuously adapts over a dynamic window of recent bars, allowing traders to visualize evolving equilibrium zones without being limited to daily or session resets.
Additionally, it includes a Multi-Timeframe (MTF) Trend Bias Filter — designed not to recalculate VWAP across timeframes, but to confirm directional alignment with higher-timeframe momentum. This ensures that short-term signals are traded only when the broader bias agrees, reducing false reversals and improving signal quality.
VWAP vs Rolling VWAP
The Volume-Weighted Average Price (VWAP) is one of the most widely used institutional benchmarks.
It represents the average traded price weighted by volume — effectively the market’s “fair value.”
However, standard VWAP resets each day or session, losing continuity across time and ignoring cumulative order flow beyond that session.
The Rolling VWAP used here continuously recalculates over a moving window of the most recent bars:
• It adapts naturally to 24×7 markets such as crypto and indices.
• It reflects the current consensus of price and volume rather than starting from zero each morning.
• It acts as a dynamic fair-value magnet, showing when price deviates too far from equilibrium.
In short:
• Standard VWAP → resets daily, suited for intraday benchmarks.
• Rolling VWAP → continuous measure of short-term market balance and sentiment.
How It Works
1. Rolling VWAP Calculation
Uses the last N bars (auto-adjusted by timeframe: e.g., 288 for 5-min, 96 for 15-min, 24 for 1-hour) to compute the continuously weighted mean price:
RVWAP = \frac{\sum(Price \times Volume)}{\sum(Volume)}
2. VWAP Bands
Three deviation envelopes are plotted above and below RVWAP at user-defined percentages — visual zones of overbought/oversold or expansion/compression.
3. Signal Logic
• Buy Signal: price closes above the Rolling VWAP after being below (bullish reclaim).
• Sell Signal: price closes below the Rolling VWAP after being above (bearish rejection).
• Cooldown Period: blocks repeated signals within a set bar interval to avoid whipsaws.
4. MTF Trend Bias
• Pulls higher-timeframe trend direction (e.g., from 1-hour while trading 5-min).
• Signals are confirmed only when short-term cross aligns with higher-timeframe bias.
• This filter does not modify or recalculate the VWAP — it purely acts as a directional validator.
5. Session Filter
Restrict signal generation to defined trading hours and timezone (e.g., 09:30–13:00 NY). Its for US market positional traders.
6. Dashboard Panel
Displays system states: data sufficiency, session activity, VWAP bias, cooldown status, and Buy/Sell signal triggers.
Why It’s Useful
• Provides a real-time adaptive fair-value anchor instead of static daily VWAP.
• Highlights both trend continuation and mean-reversion zones.
• Integrates MTF bias confirmation to trade only in line with higher-timeframe flow.
• Eliminates clutter — no oscillators or complex models, just price vs volume behavior.
How to Use
1. Apply on any timeframe (5M–4H).
2. Observe Buy (green) and Sell (red) signals relative to the blue Rolling VWAP line.
3. Enable MTF Trend Bias to confirm signals with higher-timeframe direction.
4. Use deviation bands for identifying overextended conditions or pullback opportunities.
5. Monitor the dashboard for live system feedback.
Customization
• Auto or manual Rolling VWAP window.
• Adjustable band multipliers.
• MTF bias confirmation toggle.
• Session and timezone settings.
• Dashboard size and placement.
Conceptual Takeaway
The Rolling VWAP Simple Signals indicator combines the strength of volume-weighted mean reversion with higher-timeframe directional filtering, producing clear, context-aware entries and exits.
It answers two critical trader questions:
“Where is the real, volume-based fair value right now?”
“Does my signal align with the larger trend?”
⚠️ Disclaimer
This indicator is designed s olely for educational and analytical purposes . It does not constitute financial advice, investment recommendation, or trading signal service. Trading involves substantial risk and may not be suitable for all investors. Always perform your own analysis and use proper risk management before taking any trade. The author assumes no liability for financial losses resulting from the use or interpretation of this tool.

Smart Flow Tracker [The_lurker]
Smart Flow Tracker (SFT): Advanced Order Flow Tracking Indicator
Overview
Smart Flow Tracker (SFT) is an advanced indicator designed for real-time tracking and analysis of order flows. It focuses on detecting institutional patterns, massive orders, and potential reversals through analysis of lower timeframes (Lower Timeframe) or live ticks. It provides deep insights into market behavior using a multi-layered intelligent detection system and a clear visual interface, giving traders a competitive edge.
SFT focuses on trade volumes, directions, and frequencies to uncover unusual activity that may indicate institutional intervention, massive orders, or manipulation attempts (traps).
Indicator Operation Levels
SFT operates on three main levels:
1. Microscopic Monitoring: Tracks every trade at precise timeframes (down to one second), providing visibility not available in standard timeframes.
2. Advanced Statistical Analysis: Calculates averages, deviations, patterns, and anomalies using precise mathematical algorithms.
3. Behavioral Artificial Intelligence: Recognizes behavioral patterns such as hidden institutional accumulation, manipulation attempts and traps, and potential reversal points.
Key Features
SFT features a set of advanced functions to enhance the trader's experience:
1. Intelligent Order Classification System: Classifies orders into six categories based on size and pattern:
- Standard: Normal orders with typical size.
- Significant 💎: Orders larger than average by 1.5 times.
- Major 🔥: Orders larger than average by 2.5 times.
- Massive 🐋: Orders larger than average by 3 times.
- Institutional 🏛️: Consistent patterns indicating institutional activity.
- Reversal 🔄: Large orders indicating direction change.
- Trap ⚠️: Patterns that may be price traps.
2. Institutional Patterns Detection: Tracks sequences of similar-sized orders, detects organized institutional activity, and is customizable (number of trades, variance ratio).
3. Reversals Detection: Compares recent flows with previous ones, detects direction shifts from up to down or vice versa, and operates only on large orders (Major/Massive/Institutional).
4. Traps Detection: Identifies sequences of large orders in one direction, followed by an institutional order in the opposite direction, with early alerts for false moves.
5. Flow Delta Bar: Displays the difference between buy and sell volumes as a percentage for balance, with instant updates per trade.
6. Dynamic Statistics Panel: Displays overall buy and sell ratios with real-time updates and interactive colors.
How It Works and Understanding
SFT relies on logical sequential stages for data processing:
A. Data Collection: Uses the `request.security_lower_tf()` function to extract data from a lower timeframe (like 1S) even on a higher timeframe (like 5D). For each time unit, it calculates:
- Adjusted Volume: Either normal volume or "price-weighted volume" (hlc3 * volume) based on user choice.
- Trade Direction: Compared to previous close (rise → buy, fall → sell).
B. Building Temporary Memory: Maintains a dynamic list (sizeHistory) of the last 100 trade sizes, continuously calculating the moving average (meanSize).
C. Intelligent Classification: Compares each new trade to the average:
- > 1.5 × average → Significant.
- > 2.5 × average → Major.
- > 3.0 × average → Massive.
- Institutional Patterns Check: A certain number of trades (e.g., 5) with a specified variance ratio (±5%) → Institutional.
D. Advanced Detection:
- Reversal: Compares buy/sell totals in two consecutive periods.
- Trap: Sequence of large trades in one direction followed by an opposite institutional trade.
E. Display and Alerts: Results displayed in an automatically updated table, with option to enable alerts for notable events.
Settings (Fully Customizable)
SFT offers extensive options to adapt to the trader's needs:
A. Display Settings:
- Language: English / Arabic.
- Table Position: 9 options (e.g., Top Right, Middle Right, Bottom Left).
- Display Size: Tiny / Small / Normal / Large.
- Max Rows: 10–100.
- Enable Flow Delta Bar: Yes / No.
- Enable Statistics Panel: Yes / No (displays buy/sell % ratio).
B.- Technical Settings:
- Data Source: Lower Timeframe / Live Tick (simulation).
- Timeframe: Optional (e.g., 1S, 5S, 1).
- Calculation Type: Volume / Price Volume.
C. Intelligent Detection System:
- Enable Institutional Patterns Detection.
- Pattern Length: 3–20 trades.
- Allowed Variance Ratio: 1%–20%.
- Massive Orders Detection Factor: 2.0–10.0.
D. Classification Criteria:
- Significant Orders Factor: 1.2–3.0.
- Major Orders Factor: 2.0–5.0.
E. **Advanced Detection**:
- Enable Reversals Detection (with review period).
- Enable Traps Detection (with minimum sequence limit).
F. Alerts System:
- Enable for each type: Massive orders, institutional patterns, reversals, traps, severe imbalance (60%–90%).
G. Color System: Manual customization for each category:
- Standard Buy 🟢: Dark gray green.
- Standard Sell 🔴: Dark gray red.
- Significant Buy 🟢: Medium green.
- Significant Sell 🔴: Medium red.
- Major Orders 🟣: Purple.
- Massive Orders 🟠: Orange.
- Institutional 🟦: Sky blue.
- Reversal 🔵: Blue.
- Trap 🟣: Pink-purple.
Target Audiences
SFT benefits a wide range of traders and investors:
1. Scalpers: Instant detection of large orders, liquidity points identification, avoiding traps in critical moments.
2. Day Traders: Tracking smart money footprint, determining real session direction, early reversals detection.
3. Swing Traders: Confirming trend strength, detecting institutional accumulation/distribution, identifying optimal entry points.
4. Investors: Understanding true market sentiments, avoiding entry at false peaks, identifying real value zones.
⚠️ Disclaimer:
This indicator is for educational and analytical purposes only. It does not constitute financial, investment, or trading advice. Use it in conjunction with your own strategy and risk management. Neither TradingView nor the developer is liable for any financial decisions or losses.
Smart Flow Tracker (SFT): مؤشر متقدم لتتبع تدفقات الأوامر
نظرة عامة
Smart Flow Tracker (SFT) مؤشر متقدم مصمم لتتبع وتحليل تدفقات الأوامر في الوقت الفعلي. يركز على كشف الأنماط المؤسسية، الأوامر الضخمة، والانعكاسات المحتملة من خلال تحليل الأطر الزمنية الأقل (Lower Timeframe) أو التيك الحي. يوفر رؤية عميقة لسلوك السوق باستخدام نظام كشف ذكي متعدد الطبقات وواجهة مرئية واضحة، مما يمنح المتداولين ميزة تنافسية.
يركز SFT على حجم الصفقات، اتجاهها، وتكرارها لكشف النشاط غير العادي الذي قد يشير إلى تدخل مؤسسات، أوامر ضخمة، أو محاولات تلاعب (فخاخ).
مستويات عمل المؤشر
يعمل SFT على ثلاثة مستويات رئيسية:
1. المراقبة المجهرية: يتتبع كل صفقة على مستوى الأطر الزمنية الدقيقة (حتى الثانية الواحدة)، مما يوفر رؤية غير متوفرة في الأطر الزمنية العادية.
2. التحليل الإحصائي المتقدم: يحسب المتوسطات، الانحرافات، الأنماط، والشذوذات باستخدام خوارزميات رياضية دقيقة.
3. الذكاء الاصطناعي السلوكي: يتعرف على أنماط سلوكية مثل التراكم المؤسسي المخفي، محاولات التلاعب والفخاخ، ونقاط الانعكاس المحتملة.
الميزات الرئيسية
يتميز SFT بمجموعة من الوظائف المتقدمة لتحسين تجربة المتداول:
1. نظام تصنيف الأوامر الذكي: يصنف الأوامر إلى ست فئات بناءً على الحجم والنمط:
- Standard (قياسي)**: أوامر عادية بحجم طبيعي.
- Significant 💎 (مهم)**: أوامر أكبر من المتوسط بـ1.5 ضعف.
- Major 🔥 (كبير)**: أوامر أكبر من المتوسط بـ2.5 ضعف.
- Massive 🐋 (ضخم)**: أوامر أكبر من المتوسط بـ3 أضعاف.
- Institutional 🏛️ (مؤسسي)**: أنماط متسقة تشير إلى نشاط مؤسسي.
- Reversal 🔄 (انعكاس)**: أوامر كبيرة تشير إلى تغيير اتجاه.
- Trap ⚠️ (فخ)**: أنماط قد تكون فخاخًا سعرية.
2. كشف الأنماط المؤسسية: يتتبع تسلسل الأوامر المتشابهة في الحجم، يكشف النشاط المؤسسي المنظم، وقابل للتخصيص (عدد الصفقات، نسبة التباين).
3. كشف الانعكاسات: يقارن التدفقات الأخيرة بالسابقة، يكشف تحول الاتجاه من صعود إلى هبوط أو العكس، ويعمل فقط على الأوامر الكبيرة (Major/Massive/Institutional).
4. كشف الفخاخ: يحدد تسلسل أوامر كبيرة في اتجاه واحد، يليها أمر مؤسسي في الاتجاه المعاكس، مع تنبيه مبكر للحركات الكاذبة.
5. شريط دلتا التدفق: يعرض الفرق بين حجم الشراء والبيع كنسبة مئوية للتوازن، مع تحديث فوري لكل صفقة.
6. لوحة إحصائيات ديناميكية: تعرض نسبة الشراء والبيع الإجمالية مع تحديث لحظي وألوان تفاعلية.
طريقة العمل والفهم
يعتمد SFT على مراحل منطقية متسلسلة لمعالجة البيانات:
أ. جمع البيانات: يستخدم دالة `request.security_lower_tf()` لاستخراج بيانات من إطار زمني أدنى (مثل 1S) حتى على إطار زمني أعلى (مثل 5D). لكل وحدة زمنية، يحسب:
- الحجم المعدّل: إما الحجم العادي (volume) أو "الحجم المرجّح بالسعر" (hlc3 * volume) حسب الاختيار.
- اتجاه الصفقة: مقارنة الإغلاق الحالي بالسابق (ارتفاع → شراء، انخفاض → بيع).
ب. بناء الذاكرة المؤقتة: يحتفظ بقائمة ديناميكية (sizeHistory) لآخر 100 حجم صفقة، ويحسب المتوسط المتحرك (meanSize) باستمرار.
ج. التصنيف الذكي: يقارن كل صفقة جديدة بالمتوسط:
- > 1.5 × المتوسط → Significant.
- > 2.5 × المتوسط → Major.
- > 3.0 × المتوسط → Massive.
- فحص الأنماط المؤسسية: عدد معين من الصفقات (مثل 5) بنسبة تباين محددة (±5%) → Institutional.
د. الكشف المتقدم:
- الانعكاس: مقارنة مجموع الشراء/البيع في فترتين متتاليتين.
- الفخ: تسلسل صفقات كبيرة في اتجاه واحد يتبعها صفقة مؤسسية معاكسة.
هـ. العرض والتنبيه: عرض النتائج في جدول محدّث تلقائيًا، مع إمكانية تفعيل تنبيهات للأحداث المميزة.
لإعدادات (قابلة للتخصيص بالكامل)
يوفر SFT خيارات واسعة للتكييف مع احتياجات المتداول:
أ. إعدادات العرض:
- اللغة: English / العربية.
- موقع الجدول: 9 خيارات (مثل Top Right, Middle Right, Bottom Left).
- حجم العرض: Tiny / Small / Normal / Large.
- الحد الأقصى للصفوف: 10–100.
- تفعيل شريط دلتا التدفق: نعم / لا.
- تفعيل لوحة الإحصائيات: نعم / لا (تعرض نسبة الشراء/البيع %).
ب. الإعدادات التقنية:
- مصدر البيانات: Lower Timeframe / Live Tick (محاكاة).
- الإطار الزمني: اختياري (مثل 1S, 5S, 1).
- نوع الحساب: Volume / Price Volume.
ج. نظام الكشف الذكي:
- تفعيل كشف الأنماط المؤسسية.
- طول النمط: 3–20 صفقة.
- نسبة التباين: 1%–20%.
- عامل كشف الأوامر الضخمة: 2.0–10.0.
د. معايير التصنيف:
- عامل الأوامر المهمة: 1.2–3.0.
- عامل الأوامر الكبرى: 2.0–5.0.
هـ. الكشف المتقدم:
- تفعيل كشف الانعكاسات (مع فترة مراجعة).
- تفعيل كشف الفخاخ (مع حد أدنى للتسلسل).
و. نظام التنبيهات:
- تفعيل لكل نوع: أوامر ضخمة، أنماط مؤسسية، انعكاسات، فخاخ، عدم توازن شديد (60%–90%).
ز. نظام الألوان**: تخصيص يدوي لكل فئة:
- شراء قياسي 🟢: أخضر رمادي داكن.
- بيع قياسي 🔴: أحمر رمادي داكن.
- شراء مهم 🟢: أخضر متوسط.
- بيع مهم 🔴: أحمر متوسط.
- أوامر كبرى 🟣: بنفسجي.
- أوامر ضخمة 🟠: برتقالي.
- مؤسسي 🟦: أزرق سماوي.
- انعكاس 🔵: أزرق.
- فخ 🟣: وردي-أرجواني.
الفئات المستهدفة
يستفيد من SFT مجموعة واسعة من المتداولين والمستثمرين:
1. السكالبرز (Scalpers): كشف لحظي للأوامر الكبيرة، تحديد نقاط السيولة، تجنب الفخاخ في اللحظات الحرجة.
2. المتداولون اليوميون (Day Traders): تتبع بصمة الأموال الذكية، تحديد اتجاه الجلسة الحقيقي، كشف الانعكاسات المبكرة.
3. المتداولون المتأرجحون (Swing Traders): تأكيد قوة الاتجاه، كشف التراكم/التوزيع المؤسسي، تحديد نقاط الدخول المثلى.
4. المستثمرون: فهم معنويات السوق الحقيقية، تجنب الدخول في قمم كاذبة، تحديد مناطق القيمة الحقيقية.
⚠️ إخلاء مسؤولية:
هذا المؤشر لأغراض تعليمية وتحليلية فقط. لا يُمثل نصيحة مالية أو استثمارية أو تداولية. استخدمه بالتزامن مع استراتيجيتك الخاصة وإدارة المخاطر. لا يتحمل TradingView ولا المطور مسؤولية أي قرارات مالية أو خسائر.

Volume x PriceThis indicator displays the traded volume weighted by the closing price of each candle. It's useful for visualizing the intensity of capital movement in the market, beyond traditional volume.
Calculation: Volume × Closing Price
Display: Column-style histogram
Coloring:
🟩 Green if the session was bullish (close > open)
🟥 Red if the session was bearish (close < open)
Ideal for spotting high-activity zones with directional bias. It complements classic volume analysis and helps identify strong capital inflows or outflows.

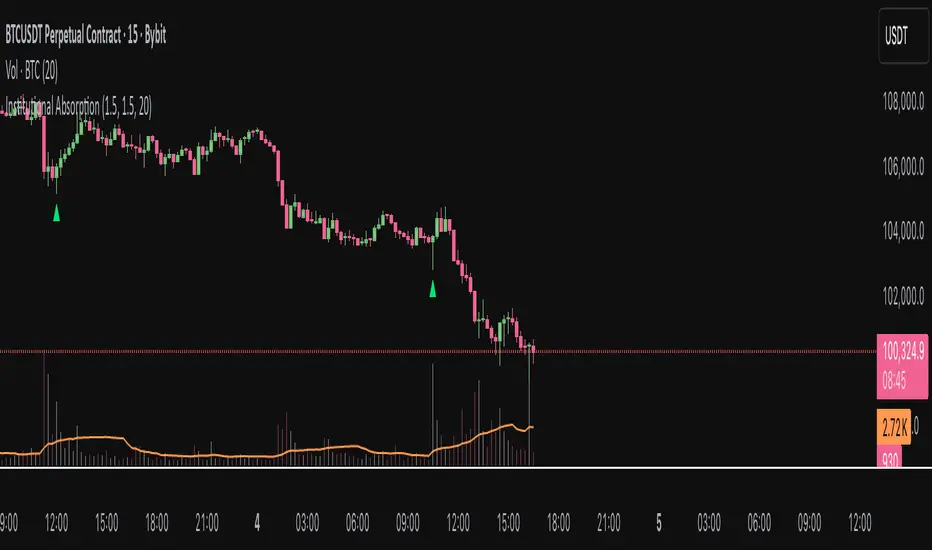
Institutional AbsorptionHighlights potential zones where institutional participants may be absorbing aggressive buying or selling pressure.
It analyzes candle structure and volume to detect possible bullish and bearish absorption events, providing a visual cue for traders studying market imbalance and liquidity dynamics.
The script compares each candle’s wick–body ratio and volume relative to its moving average.
A bullish absorption setup occurs when strong volume appears after a sharp downward move with long lower wicks, while bearish absorption occurs after upward moves with long upper wicks, suggesting the presence of large counter-orders.
+ Features
Detects bullish and bearish absorption candles.
Customizable wick to body ratio and volume multiple thresholds.
Optional filter to require candle color alignment with trend (green/red).
Option to ignore tiny body (doji-like) candles.
+ How to Use
Adjust wick–body ratio, volume multiplier, and lookback length under “Conditions (Absorption)”.
Enable “Require candle color” to strengthen directional context.
Use alerts to receive notifications when new absorption signals appear.
+ Notes
This tool aims to visualize possible absorption behavior, not confirm institutional activity.
Combine it with your broader market structure, volume, or order flow analysis for a more comprehensive analysis.
Smart Money Flow Index (SMFI) - Advanced SMC [PhenLabs]📊Smart Money Flow Index (SMFI)
Version: PineScript™v6
📌Description
The Smart Money Flow Index (SMFI) is an advanced Smart Money Concepts implementation that tracks institutional trading behavior through multi-dimensional analysis. This comprehensive indicator combines volume-validated Order Block detection, Fair Value Gap identification with auto-mitigation tracking, dynamic Liquidity Zone mapping, and Break of Structure/Change of Character detection into a unified system.
Unlike basic SMC indicators, SMFI employs a proprietary scoring algorithm that weighs five critical factors: Order Block strength (validated by volume), Fair Value Gap size and recency, proximity to Liquidity Zones, market structure alignment (BOS/CHoCH), and multi-timeframe confluence. This produces a Smart Money Score (0-100) where readings above 70 represent optimal institutional setup conditions.
🚀Points of Innovation
Volume-Validated Order Block Detection – Only displays Order Blocks when formation candle exceeds customizable volume multiplier (default 1.5x average), filtering weak zones and highlighting true institutional accumulation/distribution
Auto-Mitigation Tracking System – Fair Value Gaps and Order Blocks automatically update status when price mitigates them, with visual distinction between active and filled zones preventing trades on dead levels
Proprietary Smart Money Score Algorithm – Combines weighted factors (OB strength 25%, FVG proximity 20%, Liquidity 20%, Structure 20%, MTF 15%) into single 0-100 confidence rating updating in real-time
ATR-Based Adaptive Calculations – All distance measurements use 14-period Average True Range ensuring consistent function across any instrument, timeframe, or volatility regime without manual recalibration
Dynamic Age Filtering – Automatically removes liquidity levels and FVGs older than configurable thresholds preventing chart clutter while maintaining relevant levels
Multi-Timeframe Confluence Integration – Analyzes higher timeframe bias with customizable multipliers (2-10x) and incorporates HTF trend direction into Smart Money Score for institutional alignment
🔧Core Components
Order Block Engine – Detects institutional supply/demand zones using characteristic patterns (down-move-then-strong-up for bullish, up-move-then-strong-down for bearish) with minimum volume threshold validation, tracks mitigation when price closes through zones
Fair Value Gap Scanner – Identifies price imbalances where current candle's low/high leaves gap with two-candle-prior high/low, filters by minimum size percentage, monitors 50% fill for mitigation status
Liquidity Zone Mapper – Uses pivot high/low detection with configurable lookback to mark swing points where stop losses cluster, extends horizontal lines to visualize sweep targets, manages lifecycle through age-based removal
Market Structure Analyzer – Tracks pivot progression to identify trend through higher-highs/higher-lows (bullish) or lower-highs/lower-lows (bearish), detects Break of Structure and Change of Character for trend/reversal confirmation
Scoring Calculation Engine – Evaluates proximity to nearest Order Blocks using ATR-normalized distance, assesses FVG recency and distance, calculates liquidity proximity with age weighting, combines structure bias and MTF trend into smoothed final score
🔥Key Features
Customizable Display Limits – Control maximum Order Blocks (1-10), Liquidity Zones (1-10), and FVG age (10-200 bars) to maintain clean charts focused on most relevant institutional levels
Gradient Strength Visualization – All zones render with transparency-adjustable coloring where stronger/newer zones appear more solid and weaker/older zones fade progressively providing instant visual hierarchy
Educational Label System – Optional labels identify each zone type (Bullish OB, Bearish OB, Bullish FVG, Bearish FVG, BOS) with color-coded text helping traders learn SMC concepts through practical application
Real-Time Smart Money Score Dashboard – Top-right table displays current score (0-100) with color coding (green >70, yellow 30-70, red <30) plus trend arrow for at-a-glance confidence assessment
Comprehensive Alert Suite – Configurable notifications for Order Block formation, Fair Value Gap detection, Break of Structure events, Change of Character signals, and high Smart Money Score readings (>70)
Buy/Sell Signal Integration – Automatically plots triangle markers when Smart Money Score exceeds 70 with aligned market structure and fresh Order Block detection providing clear entry signals
🎨Visualization
Order Block Boxes – Shaded rectangles extend from formation bar spanning high-to-low of institutional candle, bullish zones in green, bearish in red, with customizable transparency (80-98%)
Fair Value Gap Zones – Rectangular areas marking imbalances, active FVGs display in bright colors with adjustable transparency, mitigated FVGs switch to gray preventing trades on filled zones
Liquidity Level Lines – Dashed horizontal lines extend from pivot creation points, swing highs in bearish color (short targets above), swing lows in bullish color (long targets below), opacity decreases with age
Structure Labels – "BOS" labels appear above/below price when Break of Structure confirmed, colored by direction (green bullish, red bearish), positioned at 1% beyond highs/lows for visibility
Educational Info Panel – Bottom-right table explains key terminology (OB, FVG, BOS, CHoCH) and score interpretation (>70 high probability) with semi-transparent background for readability
📖Usage Guidelines
General Settings
Show Order Blocks – Default: On, toggles visibility of institutional supply/demand zones, disable when focusing solely on FVGs or Liquidity
Show Fair Value Gaps – Default: On, controls FVG zone display including active and mitigated imbalances
Show Liquidity Zones – Default: On, manages liquidity line visibility, disable on lower timeframes to reduce clutter
Show Market Structure – Default: On, toggles BOS/CHoCH label display
Show Smart Money Score – Default: On, controls score dashboard visibility
Order Block Settings
OB Lookback Period – Default: 20, Range: 5-100, controls bars scanned for Order Block patterns, lower values detect recent activity, higher values find older blocks
Min Volume Multiplier – Default: 1.5, Range: 1.0-5.0, sets minimum volume threshold as multiple of 20-period average, higher values (2.0+) filter for strongest institutional candles
Max Order Blocks to Display – Default: 3, Range: 1-10, limits simultaneous Order Blocks shown, lower settings (1-3) maintain focus on most recent zones
Fair Value Gap Settings
Min FVG Size (%) – Default: 0.3, Range: 0.1-2.0, defines minimum gap size as percentage of close price, lower values detect micro-imbalances, higher values focus on significant gaps
Max FVG Age (bars) – Default: 50, Range: 10-200, removes FVGs older than specified bars, lower settings (10-30) for scalping, higher (100-200) for swing trading
Show FVG Mitigation – Default: On, displays filled FVGs in gray providing visual history, disable to show only active untouched imbalances
Liquidity Zone Settings
Liquidity Lookback – Default: 50, Range: 20-200, sets pivot detection period for swing highs/lows, lower values (20-50) mark shorter-term liquidity, higher (100-200) identify major swings
Max Liquidity Age (bars) – Default: 100, Range: 20-500, removes liquidity lines older than specified bars, adjust based on timeframe
Liquidity Sensitivity – Default: 0.5, Range: 0.1-1.0, controls pivot detection sensitivity, lower values mark only major swings, higher values identify minor swings
Max Liquidity Zones to Display – Default: 3, Range: 1-10, limits total liquidity levels shown maintaining chart clarity
Market Structure Settings
Pivot Length – Default: 5, Range: 3-15, defines bars to left/right for pivot validation, lower values (3-5) create sensitive structure breaks, higher (10-15) filter for major shifts
Min Structure Move (%) – Default: 1.0, Range: 0.1-5.0, sets minimum percentage move required between pivots to confirm structure change
Multi-Timeframe Settings
Enable MTF Analysis – Default: On, activates higher timeframe trend analysis incorporation into Smart Money Score
Higher Timeframe Multiplier – Default: 4, Range: 2-10, multiplies current timeframe to determine analysis timeframe (4x on 15min = 1hour)
Visual Settings
Bullish Color – Default: Green (#089981), sets color for bullish Order Blocks, FVGs, and structure elements
Bearish Color – Default: Red (#f23645), defines color for bearish elements
Neutral Color – Default: Gray (#787b86), controls color of mitigated zones and neutral elements
Show Educational Labels – Default: On, displays text labels on zones identifying type (OB, FVG, BOS), disable once familiar with patterns
Order Block Transparency – Default: 92, Range: 80-98, controls Order Block box transparency
FVG Transparency – Default: 92, Range: 80-98, sets Fair Value Gap zone transparency independently from Order Blocks
Alert Settings
Alert on Order Block Formation – Default: On, triggers notification when new volume-validated Order Block detected
Alert on FVG Formation – Default: On, sends alert when Fair Value Gap appears enabling quick response to imbalances
Alert on Break of Structure – Default: On, notifies when BOS or CHoCH confirmed
Alert on High Smart Money Score – Default: On, alerts when Smart Money Score crosses above 70 threshold indicating high-probability setup
✅Best Use Cases
Order Block Retest Entries – After Break of Structure, wait for price retrace into fresh bullish Order Block with Smart Money Score >70, enter long on zone reaction targeting next liquidity level
Fair Value Gap Retracement Trading – When price creates FVG during strong move then retraces, enter as price approaches unfilled gap expecting institutional orders to continue trend
Liquidity Sweep Reversals – Monitor price approaching swing high/low liquidity zones against prevailing Smart Money Score trend, after stop hunt sweep watch for rejection into premium Order Block/FVG
Multi-Timeframe Confluence Setups – Identify alignment when current timeframe Order Block coincides with higher timeframe FVG plus MTF analysis showing matching trend bias
Break of Structure Continuations – After BOS confirms trend direction, trade pullbacks to nearest Order Block or FVG in direction of structure break using Smart Money Score >70 as entry filter
Change of Character Reversal Plays – When CHoCH detected indicating potential reversal, look for Smart Money Score pivot with opposing Order Block formation then enter on structure confirmation
⚠️Limitations
Lagging Pivot Calculations – Pivot-based features (Liquidity Zones, Market Structure) require bars to right of pivot for confirmation, meaning these elements identify levels retrospectively with delay equal to lookback period
Whipsaw in Ranging Markets – During choppy conditions, Order Blocks fail frequently and structure breaks produce false signals as Smart Money Score fluctuates without clear institutional bias, best used in trending markets
Volume Data Dependency – Order Block volume validation requires accurate volume data which may be incomplete on Forex pairs or limited in crypto exchange feeds
Subjectivity in Scoring Weights – Proprietary 25-20-20-20-15 weighting reflects general institutional behavior but may not optimize for specific instruments or market regimes, user cannot adjust factor weights
Visual Complexity on Lower Timeframes – Sub-hour timeframes generate excessive zones creating cluttered charts, requires aggressive display limit reduction and higher minimum thresholds
No Fundamental Integration – Indicator analyzes purely technical price action and volume without incorporating economic events, news catalysts, or fundamental shifts that override technical levels
💡What Makes This Unique
Unified SMC Ecosystem – Unlike indicators displaying Order Blocks OR FVGs OR Liquidity separately, SMFI combines all three institutional concepts plus market structure into single cohesive system
Proprietary Confidence Scoring – Rather than manual setup assessment, automated Smart Money Score quantifies probability by weighting five institutional dimensions into actionable 0-100 rating
Volume-Filtered Quality – Eliminates weak Order Blocks forming without institutional volume confirmation, ensuring displayed zones represent genuine accumulation/distribution
Adaptive Lifecycle Management – Automatically updates mitigation status and removes aged zones preventing trades on dead levels through continuous validity and age monitoring
Educational Integration – Built-in tooltips, labeled zones, and reference panel make indicator functional for both learning Smart Money Concepts and executing strategies
🔬How It Works
Order Block Detection – Scans for patterns where strong directional move follows counter-move creating last down-candle before rally (bullish OB) or last up-candle before sell-off (bearish OB), validates formations only when candle exhibits volume exceeding configurable multiple (default 1.5x) of 20-bar average volume
Fair Value Gap Identification – Compares current candle’s high/low against two-candles-prior low/high to detect price imbalances, calculates gap size as percentage of close and filters micro-gaps below minimum threshold (default 0.3%), monitors whether subsequent price fills 50% triggering mitigation status
Liquidity Zone Mapping – Employs pivot detection using configurable lookback (default 50 bars) to identify swing highs/lows where retail stops cluster, extends horizontal reference lines from pivot creation and applies age-based filtering to remove stale zones
Market Structure Analysis – Tracks pivot progression using structure-specific lookback (default 5 bars) to determine trend, confirms uptrend when new pivot high exceeds previous by minimum move percentage, detects Break of Structure when price breaks recent pivot level, flags Change of Character for potential reversals
Multi-Timeframe Confluence – When enabled, requests security data from higher timeframe (current TF × HTF multiplier, default 4x), compares HTF close against HTF 20-period MA to determine bias, contributes ±50 points to score ensuring alignment with institutional positioning on superior timeframe
Smart Money Score Calculation – Evaluates Order Block component via ATR-normalized distance producing max 100-point contribution weighted at 25%, assesses FVG factor through age penalty and distance at 20% weight, calculates Liquidity proximity at 20%, incorporates structure bias (±50-100 points) at 20%, adds MTF component at 15%, applies 3-period smoothing to reduce volatility
Visual Rendering and Lifecycle – Draws Order Block boxes, Fair Value Gap rectangles with color coding (green/red active, gray mitigated), extends liquidity dashed lines with fade-by-age opacity, plots BOS labels, displays Smart Money Score dashboard, continuously updates checking mitigation conditions and removing elements exceeding age/display limits
💡Note:
The Smart Money Flow Index combines multiple Smart Money Concepts into unified institutional order flow analysis. For optimal results, use the Smart Money Score as confluence filter rather than standalone entry signal – scores above 70 indicate high-probability setups but should be combined with risk management, higher timeframe bias, and market regime understanding.

MACD Overlay v1 [JopAlgo]Meet the MACD you can trade directly from the chart.
MACD Overlay v1 doesn’t just plot an oscillator somewhere below—
it puts value, momentum, and participation on your candles, and it refuses to fire inside chop.
When a triangle prints, it’s because energy released (expansion), not because the chart looked cute.
What it is:
An execution-ready MACD overlay with phase gating (Expansion-Only), participation gating (Weakness-Lite), and one-click Classic vs VW-MACD Compare—all adaptive, with minimal inputs.
What’s in v1 (feature set)
Overlay ribbon on price: Fast/Slow MACD value rendered as a price-level ribbon with contextual fill and optional candle tint.
Dual value model: Classic MA-MACD (EMA/SMA) and VW-MACD (Rolling VWAP fast/slow).
Compare mode: A/B Classic vs VW-MACD with a VW ghost ribbon.
Weakness-Lite (1-bar, adaptive): Gates/fades low-participation crosses using
RVOL deficit, Effort-vs-Result failure, and over-extension vs value/ATR (Strict adds wick pressure).
Expansion-Only (Impulse/Squeeze): Triangles print only when a cross coincides with a true-range burst and a histogram-slope ignition out of compression.
Signal hygiene: ±1-bar proximity around crosses, slope awareness, 2-bar debounce.
Explainable filtering: Tiny gray dots show crosses that were intentionally filtered (weak and/or no expansion).
How to use:
Use defaults: Mode Classic, Gate by Weakness ON, Expansion-Only ON, Sensitivity Auto.
Read signals fast:
Solid triangle = cross + expansion confirmed (+ not weak if gate is ON).
Faded triangle = cross + expansion but weak participation (visible only when gate is OFF).
Gray dot = there was a cross, but it was filtered (no genuine expansion or weak & gated).
Validate quickly: Flip Compare to check VW-MACD agreement. Classic + VW alignment usually improves confidence.
Why overlay > sub-pane oscillator
You see where the cross occurs: relative to value, local structure, and S/R, right on price.
The ribbon exposes regime shifts; tint hints expansion vs contraction at a glance.
Execution becomes more context-aware and less “signal-in-a-vacuum.”
Signals & visuals
Triangles (solid): MACD crossed Signal and market showed expansion out of compression; if Gate by Weakness is ON, triangle prints only with acceptable participation.
Triangles (faded): Same as above but weak (shown only when you turn the gate OFF).
Gray dots: Crosses that were filtered (no expansion and/or Weakness gate).
Ribbon: Fast vs Slow value (Classic or VW, according to Mode). Fill and candle tint reflect expansion/contraction.
Inputs
Calculation Mode: Classic | VW | Compare
VW uses Rolling VWAP fast/slow.
Compare: Classic is primary; VW shows as a ghost ribbon for A/B checks.
Gate triangles by Weakness: ON/OFF
Uses RVOL, Effort-vs-Result, extension vs value/ATR (Strict adds wick-pressure).
Sensitivity: Off / Auto / Strict (default Auto).
Expansion-Only (Impulse/Squeeze): ON/OFF
Requires compression → release: tight ribbon + flat momentum, then TR/ATR burst with hist slope flip / cross proximity.
Display: Ribbon / Candle Tint / Weakness Markers.
Advanced (optional): Evaluate Weakness only near signals, Channel (k × |MACD|), Style Preset.
No numeric thresholds to tune—all filters self-calibrate from rolling stats.
Best practices
4H crypto: Defaults are strong—Auto, Gate ON, Expansion-Only ON.
Clean trends: If you feel you miss some tidy resumptions, briefly toggle Expansion-Only OFF.
Choppy regimes: Set Sensitivity → Strict to cut more noise without adding lag.
Confirmation: Use Compare; Classic + VW alignment typically yields better follow-through.
Alerts
MACD Signal Cross Up/Down — execution-grade (use Once per bar close).
Weakness-Lite Flag — optional context alert to help audit filtered crosses.
Attribution & License
Attribution: Based on the algorithmic concept of TradingView’s built-in MACD (fast MA – slow MA, signal, histogram).
No original TradingView source code is redistributed; overlay rendering, VW-MACD, Weakness-Lite, Expansion-Only, gating visuals, and UX are new work.
License: MPL-2.0. Educational purposes only—not financial advice.

Volume Cluster Support and Resistance Levels [QuantAlgo]🟢 Overview
This indicator identifies statistically significant support and resistance levels through volume cluster analysis, isolating price zones characterized by elevated trading activity and institutional participation. By quantifying areas where volume concentration exceeded historical norms, it reveals price levels with demonstrated supply-demand imbalances that exhibit persistent influence on subsequent price action. The methodology is asset-agnostic and timeframe-independent, applicable across equities, cryptocurrencies, forex, and commodities from intraday to weekly intervals.
🟢 Key Features
1. Support and Resistance Levels
The indicator scans historical price data to identify bars where volume exceeds a user-defined threshold multiplier relative to the rolling average. For each qualifying bar, a representative price is calculated using the average of high, low, and close. Proximate price levels within a specified percentage range are then aggregated into discrete clusters using volume-weighted averaging, eliminating redundant signals. Clusters are ranked by cumulative volume to determine statistical significance. Finally, the indicator plots horizontal levels at each cluster price: support levels (green) below current price indicate zones where historical buying pressure exceeded selling pressure, while resistance levels (red) above current price mark zones where sellers historically dominated. These levels represent areas of established liquidity and price discovery, where institutional order flow previously concentrated.
The Touch Count (T) metric quantifies historical price interaction frequency, while Total Volume (TV) measures aggregate trading activity at each level, providing objective criteria for assessing level strength and trade execution decisions.
2. Volume Histogram
A histogram appears below the price chart, displaying relative volume for each bar within the lookback period, with bar height scaled to the maximum volume observed. Green bars represent up-periods (close > open) indicating buying pressure, while red bars show down-periods (close < open) indicating selling pressure. This visualization helps you confirm the validity of support/resistance levels by seeing where volume actually spiked, identify accumulation/distribution patterns, and validate breakouts by checking if they occur on above-average volume.
3. Built-in Alerts
Automated alerts trigger when price crosses below support levels or breaks above resistance levels, allowing you to monitor multiple assets without constant chart-watching.
4. Customizable Color Schemes
The indicator provides four preset color configurations (Classic, Aqua, Cosmic, Custom) optimized for visual clarity across different charting environments. Each scheme maintains consistent color mapping for support and resistance zones across both level lines and volume histogram components. The Custom configuration permits full color specification to accommodate individual charting setups, ensuring optimal visual contrast for extended analysis sessions.
Classic:
Aqua:
Cosmic:
Custom:
🟢 Pro Tips
→ Trade entry optimization: Execute long positions at support levels with high touch counts or upon confirmed resistance breakouts accompanied by above-average volume
→ Risk parameter definition: Position stop-loss orders near identified support/resistance zones with statistical significance to minimize premature exits
→ Breakout validation: Require volume confirmation exceeding historical average when price penetrates resistance to filter false breakouts
→ Level strength assessment: Prioritize levels with higher touch counts and total volume metrics for enhanced probability trade setups
→ Multi-timeframe confluence: Synthesize support/resistance levels across multiple timeframes to identify high-conviction zones where daily support aligns with 4-hour resistance structures
