OPEN-SOURCE SCRIPT
Volatility Bars (with Moving Averages)
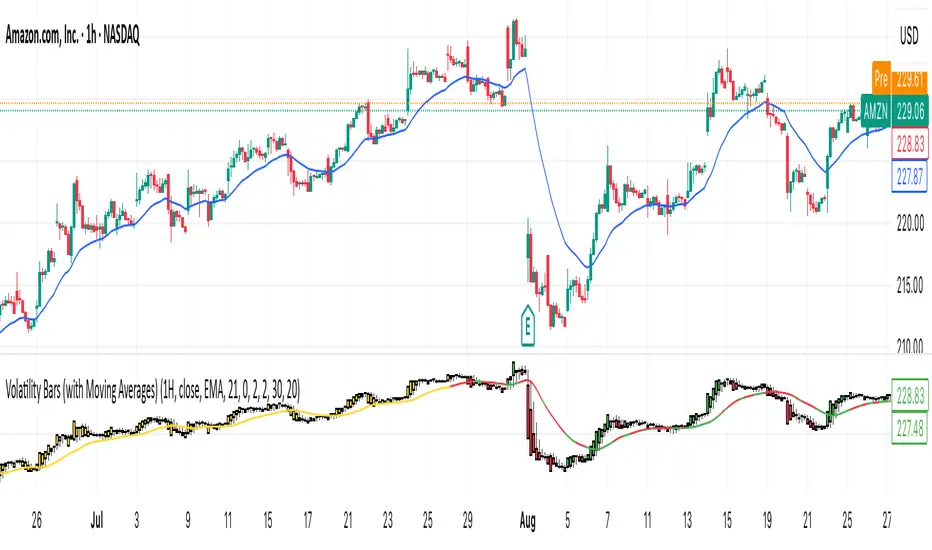
This indicator identifies trending vs. ranging market phases by comparing recent volatility to a prior period using symmetrically weighted moving averages (SWMA).
It compares volatility over two configurable windows (for example 30 vs. 60 days on daily charts) and colors bars to show relative volatility and direction.
Values of C (the volatility ratio) > 1 indicate rising volatility; C < 1 indicate falling volatility.
Recommended timeframes: 1H, 4H, 1D.
How to interpret the colors:
Note: a yellow bar indicates high volatility but does not provide information about the direction of the trend. For this reason I added a moving average for direction reference on main chart.
Practical use (options trading)
I found useful when trading Options, here are some example:
Parameters and behavior:
Two configurable windows (e.g. 30 vs. 60 on daily); the script can adapt window sizes by reference timeframe.
C = recent-window TR sum / prior-window TR sum — a relative volatility ratio.
Color thresholds are adjustable; defaults use 0.75 and 1.25.
Disclaimers:
This indicator provides informational guidance only and is not trading advice.
Backtest strategies and use risk management before applying to live trades.
It compares volatility over two configurable windows (for example 30 vs. 60 days on daily charts) and colors bars to show relative volatility and direction.
Values of C (the volatility ratio) > 1 indicate rising volatility; C < 1 indicate falling volatility.
Recommended timeframes: 1H, 4H, 1D.
How to interpret the colors:
- Yellow: recent volatility much higher than the previous period (C > 1.25). Sign of a significant increase in volatility.
- Silver: recent volatility much lower than the previous period (C < 0.75). Quieter market.
- Green: volatility within the normal range (C between 0.75 and 1.25) and bullish bar (close > open).
- Red: volatility within the normal range and bearish bar (close < open).
Note: a yellow bar indicates high volatility but does not provide information about the direction of the trend. For this reason I added a moving average for direction reference on main chart.
Practical use (options trading)
I found useful when trading Options, here are some example:
- Straddle / Strangle: consider when C is high or rising — you expect large moves but are uncertain of direction.
- Iron Butterfly: consider when C is low or falling and you expect the underlying to remain near a range (benefits from low vol and time decay).
- Iron Condor: consider when volatility is moderate-to-low and you expect limited movement within a wider range (more forgiving than a tight butterfly)
Parameters and behavior:
Two configurable windows (e.g. 30 vs. 60 on daily); the script can adapt window sizes by reference timeframe.
C = recent-window TR sum / prior-window TR sum — a relative volatility ratio.
Color thresholds are adjustable; defaults use 0.75 and 1.25.
Disclaimers:
This indicator provides informational guidance only and is not trading advice.
Backtest strategies and use risk management before applying to live trades.
開源腳本
本著TradingView的真正精神,此腳本的創建者將其開源,以便交易者可以查看和驗證其功能。向作者致敬!雖然您可以免費使用它,但請記住,重新發佈程式碼必須遵守我們的網站規則。
免責聲明
這些資訊和出版物並不意味著也不構成TradingView提供或認可的金融、投資、交易或其他類型的意見或建議。請在使用條款閱讀更多資訊。
開源腳本
本著TradingView的真正精神,此腳本的創建者將其開源,以便交易者可以查看和驗證其功能。向作者致敬!雖然您可以免費使用它,但請記住,重新發佈程式碼必須遵守我們的網站規則。
免責聲明
這些資訊和出版物並不意味著也不構成TradingView提供或認可的金融、投資、交易或其他類型的意見或建議。請在使用條款閱讀更多資訊。