OPEN-SOURCE SCRIPT
已更新 CQ_[TACHIMETER]

The Tachimeter Indicator: A Fun Financial Gauge
Visualizing Market Momentum in Real Time
Introduction
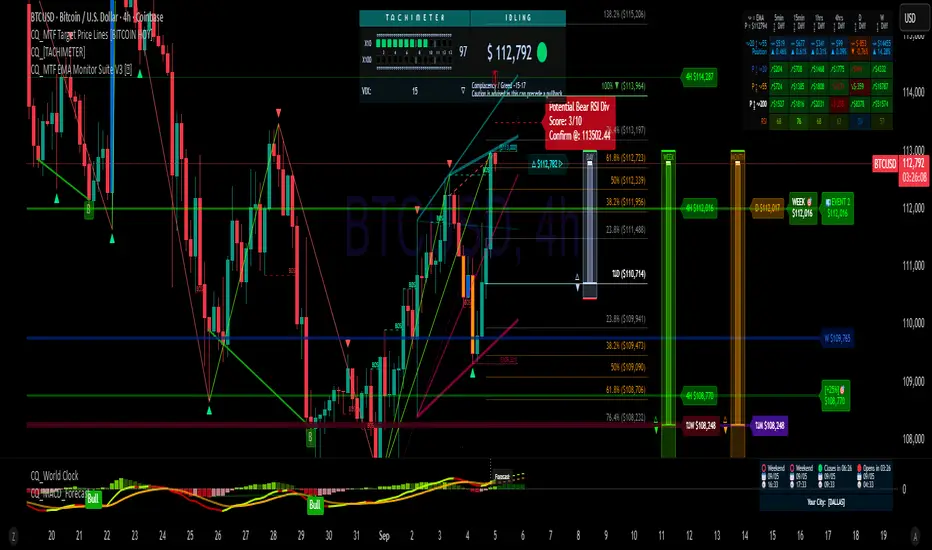
The Tachimeter is a playful and innovative indicator designed for those who enjoy observing the financial markets with a touch of excitement. Much like the tachometer in a car measures engine revolutions per minute, the Tachimeter measures the "revolutions" of money in the market — showing just how fast funds are moving in or out, every twenty seconds.
What Does the Tachimeter Show?
At its core, the Tachimeter displays how much money (in U.S. dollars) is shifting direction — either up or down — from the current price within a 20-second window. The indicator operates on a scale that starts at $0 (no significant movement) and extends to $1200, representing the maximum flow observed in each 20-second period.
• Scale: $0 to $1200 every 20 seconds
• Direction: Indicates if money is moving upwards (buying) or downwards (selling)
• Purpose: For entertainment and observation, not for actual trading decisions
Visual Design and Interpretation
The Tachimeter features a gauge reminiscent of a car’s tachometer. The gauge moves to show the current intensity of money flowing into or out of the market right now, providing an immediate sense of how "fast" buyers or sellers are acting.
• Gauge Indicator: The amount of squares shows the speed of ongoing transactions, just like a rev counter in a vehicle.
• Color-Coded Title: The title of the indicator switches colors based on the market’s relationship to the daily opening price:
• Red: When the current price is lower than the daily opening price, indicating downward momentum.
• Green: When the current price is higher than the daily opening price, signaling buying momentum.
How to Use the Tachimeter
This indicator is intended purely for fun — it gives you a rapid, visual sense of market activity, letting you "feel" the excitement of fluctuating prices. If you enjoy watching the markets move, the Tachimeter adds a dynamic, visceral element to your experience.
• Watch the needle twitch higher as heavy buying or selling takes place.
• Notice title color changes as the market sentiment shifts from bullish (green) to bearish (red), or vice versa.
• Use it as a conversation starter or to enhance your enjoyment of fast-paced trading sessions.
Final Thoughts
Like your car’s tachometer helps you sense when to shift gears, the Tachimeter lets you sense when the market is "revving up." It’s not a tool for serious decision-making, but it transforms raw financial data into an engaging, interactive visual — perfect for those who appreciate both finance and a bit of fun.
Enjoy watching the market’s RPMs!
發行說明
New horizontal design.發行說明
Minor update, eliminating redundant arrowhead.發行說明
Minor corrections made to script.發行說明
Added VIX analysis row.開源腳本
本著TradingView的真正精神,此腳本的創建者將其開源,以便交易者可以查看和驗證其功能。向作者致敬!雖然您可以免費使用它,但請記住,重新發佈程式碼必須遵守我們的網站規則。
免責聲明
這些資訊和出版物並不意味著也不構成TradingView提供或認可的金融、投資、交易或其他類型的意見或建議。請在使用條款閱讀更多資訊。
開源腳本
本著TradingView的真正精神,此腳本的創建者將其開源,以便交易者可以查看和驗證其功能。向作者致敬!雖然您可以免費使用它,但請記住,重新發佈程式碼必須遵守我們的網站規則。
免責聲明
這些資訊和出版物並不意味著也不構成TradingView提供或認可的金融、投資、交易或其他類型的意見或建議。請在使用條款閱讀更多資訊。