OPEN-SOURCE SCRIPT
已更新 Fibo Candle Middle Line
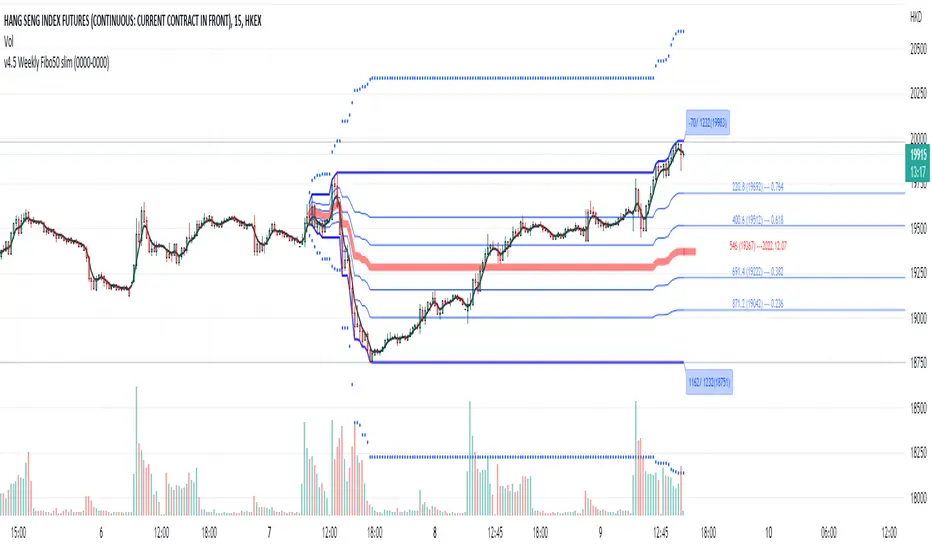
Adopt the idea of Fibo retracement 50% line, if a retracement move more than 50%, it is likely that the retracement will continue and made a new high or new low with 1.618 ratio from the middle line. You will find that the fibo 50% line also works as a support and resistance. The Dotted line is the projected 1.618 fibo target.
發行說明
The blue line is the fibo 50% middle line of a day candle. When bull and bear fight, the forming of bear and bull, need to break the Fibo 50% line first, once it break, the winning party will go to the 1.618 target line. To use this indicator, you can observe how it react at the middle line, if it win, you may set your take profit point as at te dotted line (1.618) at the time of rebound. 發行說明
Highlight functionYou can adjust the range of the fibo by clicking the indicator on the chart as well as using the indicator set up to input the begin date/time.
I find the dragging on the chart to adjust begin date/time is very useful
How to use?
1. Select the indicator on the chart
2. Move the mouse to the "square" symbol at the begining of the period
3. You can drag to change the begin date/time
開源腳本
秉持TradingView一貫精神,這個腳本的創作者將其設為開源,以便交易者檢視並驗證其功能。向作者致敬!您可以免費使用此腳本,但請注意,重新發佈代碼需遵守我們的社群規範。
免責聲明
這些資訊和出版物並非旨在提供,也不構成TradingView提供或認可的任何形式的財務、投資、交易或其他類型的建議或推薦。請閱讀使用條款以了解更多資訊。
開源腳本
秉持TradingView一貫精神,這個腳本的創作者將其設為開源,以便交易者檢視並驗證其功能。向作者致敬!您可以免費使用此腳本,但請注意,重新發佈代碼需遵守我們的社群規範。
免責聲明
這些資訊和出版物並非旨在提供,也不構成TradingView提供或認可的任何形式的財務、投資、交易或其他類型的建議或推薦。請閱讀使用條款以了解更多資訊。