INVITE-ONLY SCRIPT
Liquidity Pool - TradingED
已更新
The use of this indicator is restricted to private use, and it can be used only by invitation. Different functionalities have been added to the original codes, such as alerts and signals that seek to make trading much easier to interpret by any type of trading operator of any experience level, from beginner to intermediate and advanced .
Key components:
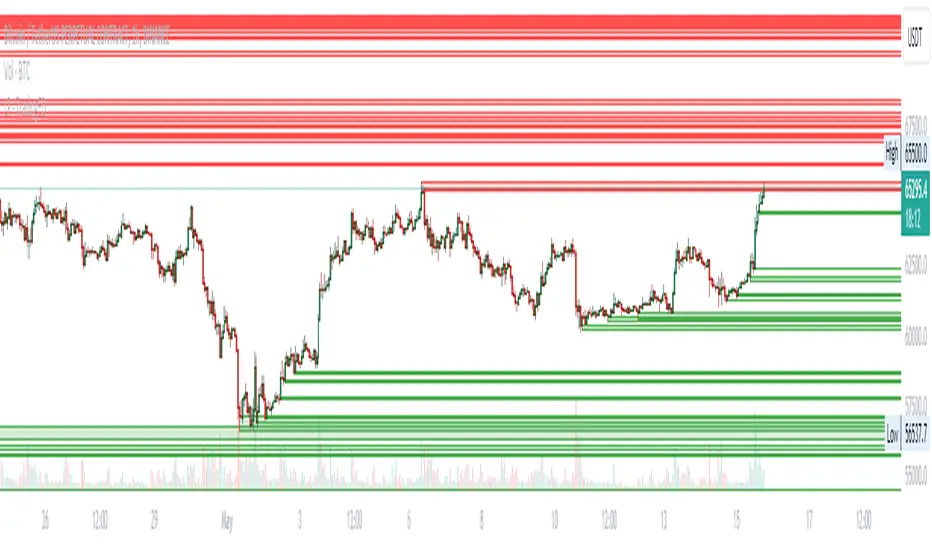
• Follow the liquidity levels, as they are going to attract the price sooner or later.
• Never open positions opposite to a liquidity level’s direction.
• During the price movement towards a liquidity level, there appears a high probability to cross that level.
• When a liquidity level is crossed, the reversal movement is quite a frequent consequence, as major players are not interested in a level anymore.
When support and resistance levels are held for a long time, the highest liquidity is cumulated above or below those levels, so this is why "Liquidity pools" occur around key support and resistance, or areas on the chart where a lot of trading activity takes place. If you trade, you need this trading activity to get your order filled. Most retail traders don’t have to worry about liquidity when it comes to getting filled. In fact, even some professional swing or trend traders may not have to worry about it. A string of order types cumulates an asset’s liquidity there. This is why investors drive prices into those areas, creating new liquidity levels.
Main functions of this indicator:
1) The SOURCE for the counts can be determined by the trader (close, open, etc).
2) The MEASURE can be based on a CANDLES count if you are trading OHLC Charts from 1D onwards, or if your trading is intraday, you can also select counts by MINUTES, HOURS or DAYS, depending on your trading style.
3) LENGTH, by default it will be loaded as in the STRATEGY, but considering the previous point, you can modify it according to your convenience.
Key components:
• Follow the liquidity levels, as they are going to attract the price sooner or later.
• Never open positions opposite to a liquidity level’s direction.
• During the price movement towards a liquidity level, there appears a high probability to cross that level.
• When a liquidity level is crossed, the reversal movement is quite a frequent consequence, as major players are not interested in a level anymore.
When support and resistance levels are held for a long time, the highest liquidity is cumulated above or below those levels, so this is why "Liquidity pools" occur around key support and resistance, or areas on the chart where a lot of trading activity takes place. If you trade, you need this trading activity to get your order filled. Most retail traders don’t have to worry about liquidity when it comes to getting filled. In fact, even some professional swing or trend traders may not have to worry about it. A string of order types cumulates an asset’s liquidity there. This is why investors drive prices into those areas, creating new liquidity levels.
Main functions of this indicator:
1) The SOURCE for the counts can be determined by the trader (close, open, etc).
2) The MEASURE can be based on a CANDLES count if you are trading OHLC Charts from 1D onwards, or if your trading is intraday, you can also select counts by MINUTES, HOURS or DAYS, depending on your trading style.
3) LENGTH, by default it will be loaded as in the STRATEGY, but considering the previous point, you can modify it according to your convenience.
發行說明
Bug Fixed!發行說明
New URL!發行說明
New version發行說明
Bug Fixed!發行說明
Bug fixed!發行說明
Bug Fixed!發行說明
Bug Fixed!發行說明
Bug Fixed!發行說明
New functions added.發行說明
NEW VERSION!The "Liquidity Pool - TradingED" indicator is an advanced tool developed for traders who need to identify and visualize liquidity zones directly on their TradingView charts. This indicator overlays the price chart, highlighting significant areas where potential support or resistance levels might form, aiding in the decision-making process by pinpointing zones of high trading interest.
Key Features:
- Dynamic Zone Visualization: Automatically calculates and displays bullish and bearish zones based on real-time market data.
- User Customization Options: Allows users to toggle the display of all pivots, only the last created pivots, and the background colors for better visibility and personal preference.
- Advanced Calculation Algorithms: Identifies bullish or bearish zones using the highest/lowest prices points combined with the open or close price within a given timeframe.
- Dynamic Filtering: Filters zones dynamically to ensure only the most relevant zones are displayed based on user-defined price targets.
- Visual Representation: Uses boxes to represent liquidity zones, extending them visually across the chart for clear, actionable insights.
Practical Applications:
- Support and Resistance Identification: Zones act as potential areas of support or resistance, guiding traders on key levels for setting stop losses or taking profits.
- Trend Confirmation: By observing how price interacts with these liquidity zones, traders can confirm potential reversals or continuation of trends.
- Strategic Trade Planning: Helps in planning entry and exit strategies by providing visual cues about high liquidity areas where price movements are likely to occur.
This indicator is tailored for day traders and swing traders who require precise visual cues about liquidity zones and wish to integrate these insights into their trading strategies. It offers a comprehensive set of features that enhance the understanding of market structures and facilitate informed trading decisions based on the analysis of liquidity pools.
發行說明
Short upgrade.僅限邀請腳本
僅限作者授權的用戶訪問此腳本,並且通常需要付費。您可以將其增加到收藏腳本中,但是只有在向作者請求並獲得許可之後,才能使用它。 請聯繫Trading_ED以了解更多信息,或按照下面作者的說明進行操作。
TradingView 不建議購買並使用此腳本,除非您 100% 信任其作者並了解腳本的工作原理。在許多情況下,您可以在我們的社群腳本中免費找到良好的開源替代方案。
作者的說明
″Send a DM to request access!
想在圖表上使用此腳本?
警告:請閱讀,然後再請求訪問權限。
We are a community of Traders interested in applying adequate Risk Management for Financial Markets.
免責聲明
這些資訊和出版物並不意味著也不構成TradingView提供或認可的金融、投資、交易或其他類型的意見或建議。請在使用條款閱讀更多資訊。