OPEN-SOURCE SCRIPT
VXN Smart Money Concepts

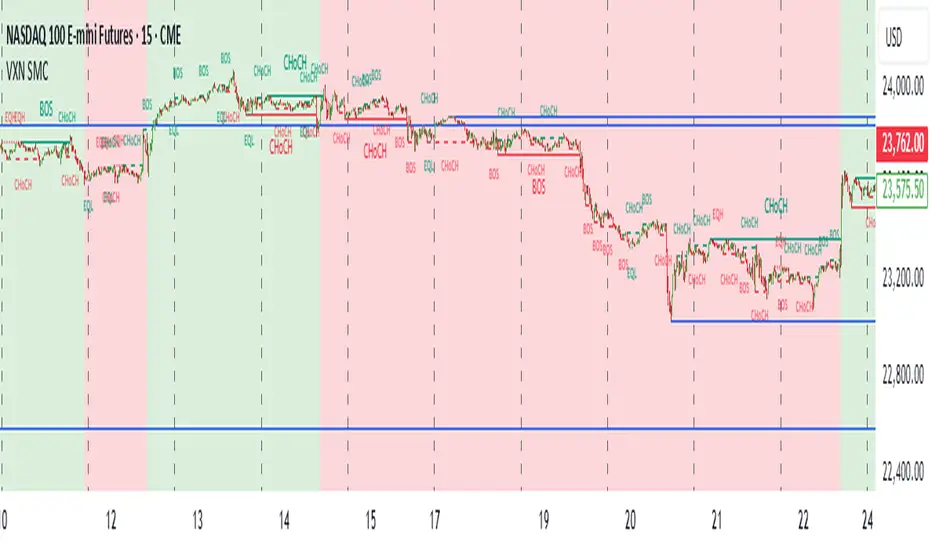
This indicator is based on other open source scripts. It's designed specifically for Nasdaq futures contracts (NQ and MNQ). It implements Smart Money Concepts (SMC) tools including internal and swing market structures, order blocks, equal highs/lows, fair value gaps, premium/discount zones, and multi-timeframe highs/lows.
The indicator overlays these elements on the chart to help identify potential reversal and continuation points in the market.
A key feature is the integration of the VXN (CBOE Nasdaq Volatility Index) to provide directional bias through background coloring:
- Green background: Indicates a bullish VXN trend (short-term EMA below long-term SMA), suggesting lower volatility and potential upward momentum. Users should prioritize bullish breakout signals (e.g., Bullish BOS or CHoCH) in this condition.
- Red background: Indicates a bearish VXN trend (short-term EMA above long-term SMA), suggesting higher volatility and potential downward pressure. Users should prioritize bearish breakout signals (e.g., Bearish BOS or CHoCH) in this condition.
Always align breakout signals from structures (BOS/CHoCH) and order blocks with the VXN direction for higher probability trades. For example, take long positions on bullish breakouts only during green backgrounds, and short positions on bearish breakouts only during red backgrounds.
開源腳本
本著TradingView的真正精神,此腳本的創建者將其開源,以便交易者可以查看和驗證其功能。向作者致敬!雖然您可以免費使用它,但請記住,重新發佈程式碼必須遵守我們的網站規則。
免責聲明
這些資訊和出版物並不意味著也不構成TradingView提供或認可的金融、投資、交易或其他類型的意見或建議。請在使用條款閱讀更多資訊。
開源腳本
本著TradingView的真正精神,此腳本的創建者將其開源,以便交易者可以查看和驗證其功能。向作者致敬!雖然您可以免費使用它,但請記住,重新發佈程式碼必須遵守我們的網站規則。
免責聲明
這些資訊和出版物並不意味著也不構成TradingView提供或認可的金融、投資、交易或其他類型的意見或建議。請在使用條款閱讀更多資訊。