ATR - Daily vs CurrentThis script provides a comprehensive view of the Average True Range (ATR) for both the current trading day and a multi-day lookback, giving traders real-time insight into volatility and potential daily price movement. Key features include:
ATR Table:
- Average ATR: 14-day ATR, representing typical daily volatility.
- Today’s ATR: Current day ATR, showing how much the price has moved so far.
- % of Avg ATR Used: Calculates the percentage of the average ATR that has been realized today, helping assess if a move is near exhaustion.
Possible Daily ATR Range Lines:
- Horizontal lines drawn from today’s open representing ±50% and ±100% of the 14-day ATR, providing a visual guide for potential price extremes.
- Lines are updated once per day and extend from the right to the left, clearly marking possible intraday range limits.
Color-coded for clarity:
- Green = +50% ATR
- Red = -50% ATR
- Lime = +100% ATR
- Maroon = -100% ATR
Usage:
- Useful for day traders and intraday scalpers to track volatility and potential price targets.
- Helps in risk management, setting stops, and estimating realistic intraday moves.
- Provides visual cues for when price has consumed a significant portion of expected daily range.
Note: ATR is a statistical measure; the lines represent possible ranges, not guaranteed targets. Daily market conditions may prevent price from reaching full ATR.
真實波幅均值(ATR)

Range TableThe Range Table indicator calculates and displays the Daily Average True Range (ATR), the current day's True Range (TR), and two customizable ATR percentage values in a clean table format. It provides values in ticks, points, and USD, helping traders set stop-loss buffers based on market volatility.
**Features:**
- Displays the Daily ATR (14-period) and current day's True Range (TR) with its percentage of the Daily ATR.
- Includes two customizable ATR percentages (default: 75% and 10%, with the second disabled by default).
- Shows values in ticks, points, and USD based on the symbol's tick size and point value.
- Customizable table position, background color, text color, and font size.
- Toggle visibility for the table and percentage rows via input settings.
**How to Use:**
1. Add the indicator to your chart.
2. Adjust the table position, colors, and font size in the input settings.
3. Enable or disable the 75% and 10% ATR rows or customize their percentages.
4. Use the displayed values to set stop-loss or take-profit levels based on volatility.
**Ideal For:**
- Day traders and swing traders looking to set volatility-based stop-losses.
- Users analyzing tick, point, and USD-based risk metrics.
**Notes:**
- Ensure your chart is set to a timeframe that aligns with the daily ATR calculations.
- USD values are approximate if `syminfo.pointvalue` is unavailable.
Developed by FlyingSeaHorse.

[Top] Simple ATR TP/SLSimple TP/SL from ATR (Locked per Bar) - Advanced Position Management Tool
What This Indicator Does:
Automatically calculates and displays Take Profit (TP) and Stop Loss (SL) levels based on Average True Range (ATR)
Locks ATR values and direction signals at the start of each bar to prevent repainting and provide consistent levels
Offers multiple direction detection modes including real-time candle-based positioning for dynamic trading approaches
Displays entry, TP, and SL levels as clean horizontal lines that extend from the current bar
Original Features That Make This Script Unique:
Bar-Locked ATR System: ATR values are captured and frozen at bar open, ensuring levels remain stable throughout the bar's progression
Multi-Modal Direction Detection: Four distinct modes for determining TP/SL positioning - Trend Following (EMA-based), Bullish Only, Bearish Only, and real-time Candle Based
Real-Time Candle Flipping: In Candle Based mode, TP/SL levels flip immediately when the current candle changes from bullish to bearish or vice versa
Persistent Line Management: Uses efficient line object management to prevent ghost lines and maintain clean visual presentation
Flexible Base Price Selection: Choose between Open (static), Close (dynamic), or midpoint (H+L)/2 for entry level calculation
How The Algorithm Works:
ATR Calculation: Captures ATR value at each bar open using specified length parameter, maintaining consistency throughout the bar
Direction Determination: Uses different methods based on selected mode - EMA crossover for trend following, or real-time candle color for dynamic positioning
Level Calculation: TP level = Base Price + (Direction × TP Multiplier × ATR), SL level = Base Price - (Direction × SL Multiplier × ATR)
Visual Management: Creates persistent line objects once, then updates their positions every bar for optimal performance
Direction Modes Explained:
Trend Following: Uses 5-period and 12-period EMA relationship to determine trend direction (locked at bar open)
Bullish Only: Always places TP above and SL below entry (traditional long setup)
Bearish Only: Always places TP below and SL above entry (traditional short setup)
Candle Based: Dynamically adjusts based on current candle direction - flips in real-time as candle develops
Key Input Parameters:
ATR Length: Period for ATR calculation (default 14) - longer periods provide smoother volatility measurement
TP Multiplier: Take profit distance as multiple of ATR (default 1.0) - higher values target larger profits
SL Multiplier: Stop loss distance as multiple of ATR (default 1.0) - higher values allow more room for price movement
Base Price: Reference point for level calculations - Open for static entry, Close for dynamic tracking
Direction Mode: Method for determining whether TP goes above or below entry level
How To Use This Indicator:
For Position Sizing: Use the displayed SL distance to calculate appropriate position size based on your risk tolerance
For Entry Timing: Wait for price to approach the entry level before taking positions
For Risk Management: Set your actual stop loss orders at or near the displayed SL level
For Profit Taking: Use the TP level as initial profit target, consider scaling out at this level
Mode Selection: Choose Candle Based for scalping and quick reversals, Trend Following for swing trading
Visual Style Customization:
Line Colors: Customize TP line color (default teal) and SL line color (default orange) for easy identification
Line Widths: Adjust TP/SL line thickness (1-5) and entry line thickness (1-3) for visibility preferences
Clean Display: Lines extend 3 bars forward from current bar and update position dynamically
Best Practices:
Use on clean charts without multiple overlapping indicators for clearest visual interpretation
Combine with volume analysis and key support/resistance levels for enhanced decision making
Adjust ATR length based on your trading timeframe - shorter for scalping, longer for position trading
Test different TP/SL multipliers based on the volatility characteristics of your chosen instruments
Consider using Trend Following mode during strong trending periods and Candle Based during ranging markets


Supertrend -Mahesh Reddy same like in zeroda best one here all super trend doesnt work perfectly so made this one

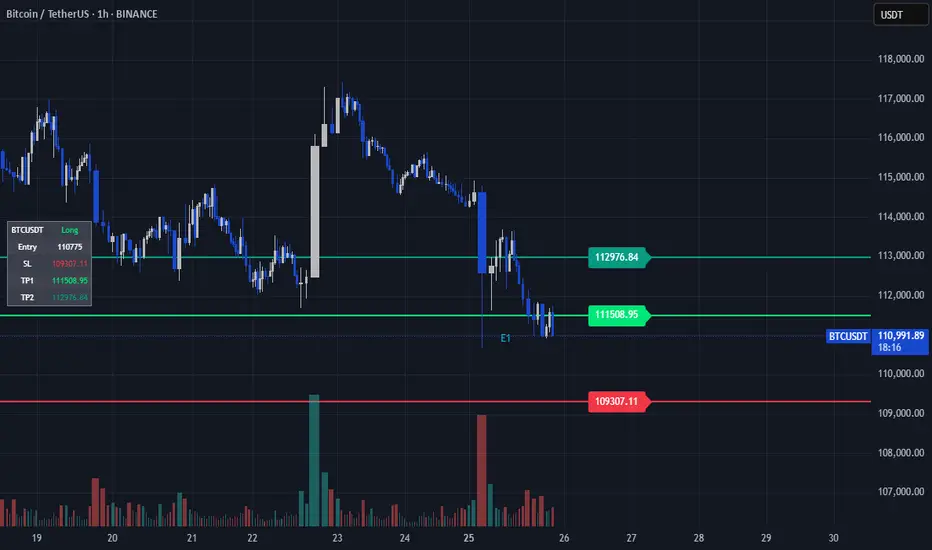
TP/SL Dynamic (FIB,ATR,MULTIPLE,PERCENT)TP/SL Dynamic (FIB, ATR, MULTIPLE, PERCENT)
This indicator provides a flexible framework for managing Take Profit (TP) and Stop Loss (SL) levels using multiple calculation schemes. It is designed for traders who want dynamic or rule-based levels that adapt to volatility, market type, and custom input.
The script supports four TP/SL methodologies:
Pro Standards (Auto-Select): Adapts method based on asset type and volatility.
R Multiples: Risk-based reward multiples from ATR-derived stop distance.
Fibonacci R: Fibonacci extension levels projected from recent pivots.
Percent: Fixed percentage distance from entry, adjusted by volatility.
ATR Multiples: ATR-based calculations with configurable multipliers.
Features:
Up to 3 manual entries, each with configurable time, price, and position size.
Weighted entry price calculation across multiple positions.
Single or multiple TP targets (up to 4) with automatic scaling.
Dynamic ATR option: updates SL/TP levels with live volatility or fixes them at entry.
Pivot-based logic for Fibonacci extensions.
Symbol Locking to prevent mismatches between intended pair and chart symbol.
Table display with optional R-multiples, TP/SL values, and entry details.
Visual chart elements: lines, labels, price-scale markers for SL/TP, and zebra-style info tables.
Entry markers (E1, E2, E3) for clarity.
Alerts for TP and SL triggers (both long and short).
How to Use:
Define entry prices, times, and position sizes (up to 3 entries).
Select a TP method (Pro Standards, R Multiples, Fibonacci R, Percent, or ATR Multiples).
Choose single or multiple TP mode.
Optionally enable Dynamic ATR to update levels in real time.
Check the on-chart table for all calculated levels and alerts.
Author & Credit:
Developed from the ground up by me (no external code used outside The Pine public library).
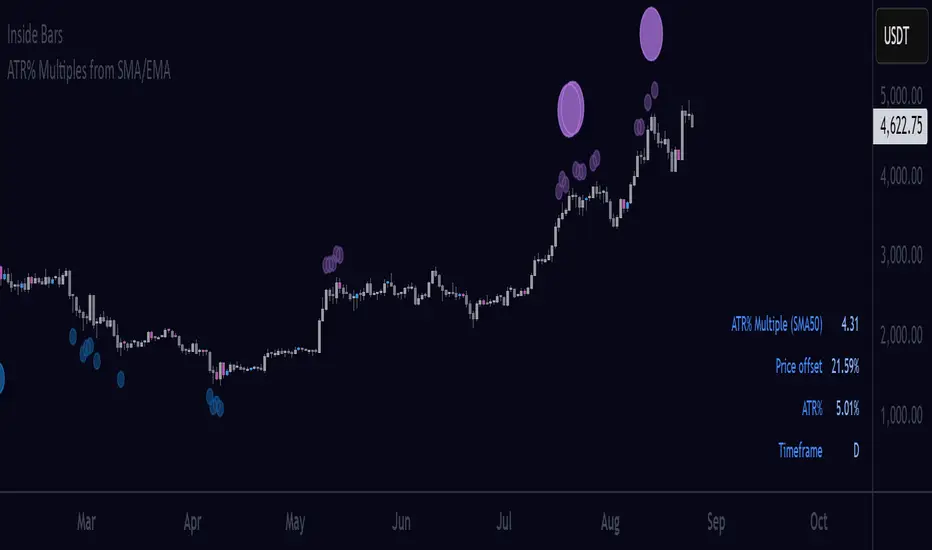
ATR% Multiples from SMA/EMAInspired by the indicator ATR% multiple from 50-MA by @jfsrev, this tool measures how far price is extended from a Moving Average using an ATR% multiple.
What’s added vs. ATR% multiple from 50-MA indicator:
Downside multiples — flags extensions below and above the MA.
Timeframe selection — compute on Daily/Weekly/Monthly or intraday, independent of your chart.
EMA/SMA toggle — choose the MA type (EMA/SMA).
Multi-thresholds — set several ATR% multiple levels.
How to use the indicator:
I find the ATR multiple to be a very versatile tool that can be used for profit taking, mean reverting, and to make better assumption about what market environment to expect.
Which thresholds should you use?
It's up to you really. Personally I use them in a quite discretionary manner where I will change inputs depending on market and it's current regime - E.g. if we are in a strong uptrend I might use higher multiples to the upside and lower multiples to the downside, and if the market is in a range I will use them in a different manner. Be creative, test things, and work out what makes sense to you and the market and timeframe you are trading in.
Skully ATR Stoploss LevelsA comprehensive ATR-based stop loss indicator designed for precise risk management across all trading styles.
✨ KEY FEATURES:
- Live Price Levels: Display up to 3 real-time stop loss lines above/below current candle
- Historical Analysis: Scroll back to see ATR levels at any historical candle
- Triple ATR System: Three customizable ATR multipliers (1.0x, 1.5x, 2.0x default)
- Long/Short Separation: Independent controls for bullish and bearish setups
- Clean Interface: Minimal visual clutter with smart default settings
🎯 PERFECT FOR:
- Swing traders setting daily/weekly stops
- Day traders needing quick, precise risk management
- Position sizing based on volatility
- Multi-timeframe stop analysis (customizable in settings)
📊 HOW IT WORKS:
The indicator calculates Average True Range over your chosen period and displays stop loss levels at 1x, 1.5x, and 2x ATR distances (also customizable). Toggle individual levels on/off, and use historical steplines to analyze/backtest past setups.
⚙️ SMART DEFAULTS:
- Only ATR1 Long Level (Live Price) visible by default (to keep charts clean)
- Historical data available but invisible until needed
- Works across any timeframe and asset class
- Default colors will display cleanly on both Dark and Light charts
Perfect for traders who want professional-grade stop placement without chart clutter.

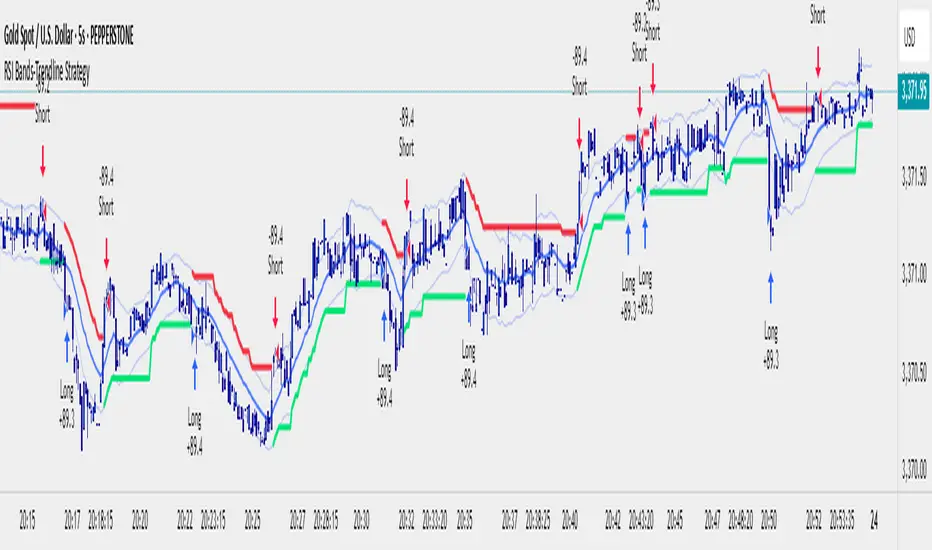
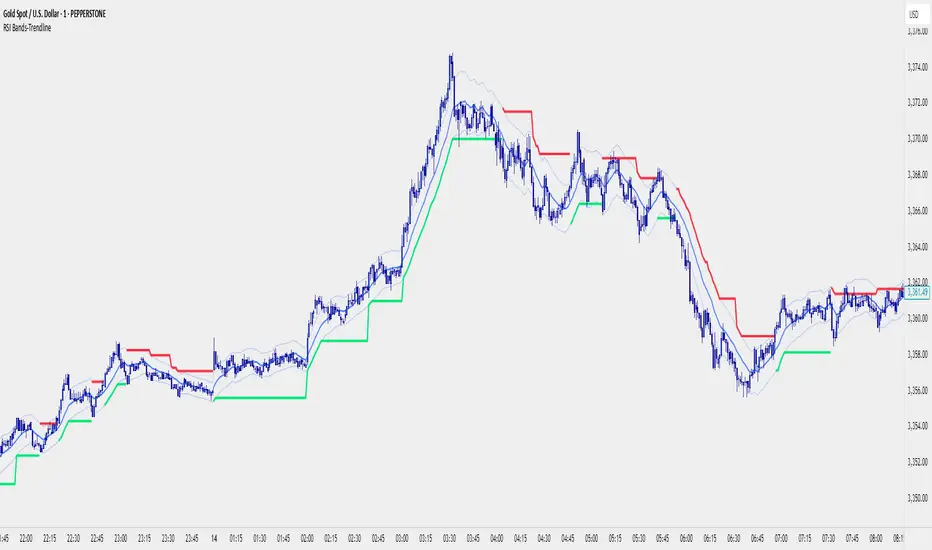
RSI Bands With RSI - ATR Trend StrategyRSI Bands With RSI-ATR Trend Line Strategy
Overview
A trend-following strategy that combines RSI regime detection with a smoothed baseline and ATR bands. Works similar to Supertrend: the line flips bullish or bearish only when price closes beyond the band, aiming to filter noise and catch clean moves.
How It Works
RSI above 50 = bullish bias, below 50 = bearish bias
A dynamic baseline is calculated from RSI and price range, then smoothed
ATR bands expand/contract with volatility
Close above the upper band → bullish flip → long entry
Close below the lower band → bearish flip → short entry
Between bands → prior trend continues
Features
Automatic Buy/Sell entries on confirmed flips
Configurable RSI, Smoothing, ATR, and Multiplier inputs
Visual trend line (green = bull, red = bear)
Backtest ready with initial capital and commission settings
Best Use Cases
Trending markets across Forex, Crypto, Indices, Commodities
Works on multiple timeframes (higher TFs = cleaner flips)
Flexible settings for conservative swing trading or aggressive scalping
⚠️ For testing/education only. Always manage risk and confirm with higher-timeframe or structure filters.
Instant Breakout Strategy with RSI & VWAPInstant Breakout Strategy with RSI & VWAP
This TradingView strategy (Pine Script v6) trades breakouts using pivot points, with optional filters for volume, momentum, RSI, and VWAP. It’s optimized for the 1-second timeframe.
Overview
The strategy identifies breakouts when price crosses above resistance (pivot highs) or below support (pivot lows). It can use basic pivot breakouts or add filters for stronger signals. Take-profit and stop-loss levels are set using ATR, and signals are shown on the chart.
Inputs
Left/Right Pivot Bars: Bars to detect pivots (default: 3). Lower values increase sensitivity.
Volume Surge Multiplier: Volume threshold vs. 20-period average (default: 1.5).
Momentum Threshold: Minimum % price change from bar open (default: 1%).
Take-Profit ATR Multiplier: ATR multiplier for take-profit (default: 9.0).
Stop-Loss ATR Multiplier: ATR multiplier for stop-loss (default: 1.0).
Use Filters: Enable/disable volume, momentum, RSI, and VWAP filters (default: off).
How It Works
1. Pivot Detection
Finds pivot highs (resistance) and lows (support) using ta.pivothigh and ta.pivotlow.
Tracks the latest pivot levels.
2. Volume Surge
Compares current volume to a 20-period volume average.
A surge occurs if volume exceeds the average times the multiplier.
3. Momentum
Measures price change from the bar’s open.
Bullish: Price rises >1% from open.
Bearish: Price falls >1% from open.
4. RSI and VWAP
RSI: 3-period RSI. Above 50 is bullish; below 50 is bearish.
VWAP: Price above VWAP is bullish; below is bearish.
5. ATR
14-period ATR sets take-profit (close ± atr * 9.0) and stop-loss (close ± atr * 1.0).
Trading Rules
Breakout Conditions
Bullish Breakout:
Price crosses above the latest pivot high.
With filters: Volume surge, bullish momentum, RSI > 50, price > VWAP.
Without filters: Only the crossover is needed.
Bearish Breakout:
Price crosses below the latest pivot low.
With filters: Volume surge, bearish momentum, RSI < 50, price < VWAP.
Without filters: Only the crossunder is needed.
Entries and Exits
Long: Enter on bullish breakout. Set take-profit and stop-loss. Close any short position.
Short: Enter on bearish breakout. Set take-profit and stop-loss. Close any long position.
Visuals
Signals: Green triangles (bullish) below bars, red triangles (bearish) above bars.
Pivot Levels: Green line (resistance), red line (support).
Indicators: RSI (blue, separate pane), VWAP (purple, on chart).
How to Use
Apply to a 1-second chart in TradingView for best results.
Adjust inputs (e.g., pivot bars, multipliers). Enable filters for stricter signals.
Watch for buy/sell triangles and monitor RSI/VWAP.
Use ATR-based take-profit/stop-loss for risk management.
Notes
Best on 1-second timeframe due to fast RSI and responsiveness.
Disable filters for more signals (less confirmation).
Backtest before live trading to check performance.
This strategy uses pivots, volume, momentum, RSI, and VWAP for clear breakout trades on the 1-second timeframe.

ORB Dashboard for the TFLX Strategy# ORB Range/ATR Dashboard - Technical Indicator Description
## Main Function
This indicator analyzes Opening Range Breakout (ORB) patterns by calculating a defined time period and its relation to historical volatility. The indicator combines multiple technical analysis methods and presents results in a configurable dashboard format.
**Purpose:** This indicator automates the manual calculation steps of the TFLX analysis methodology, providing real-time computation of volatility ratios, trend filters, and risk management parameters that would otherwise require manual calculation and monitoring.
## Requirements and Limitations
**Additional Indicator Required:** This dashboard indicator works in conjunction with a separate ORB range visualization indicator that displays the actual high/low range levels on the chart. The dashboard provides analysis and calculations, while the range indicator provides visual reference points.
**Important Notice:** This indicator serves as an analytical tool and calculation assistant for the TFLX methodology. It does not execute trades automatically but provides data analysis to support manual decision-making processes.
## TFLX Analysis Methodology Framework
### Core Analysis Rules (Discretionary Implementation)
**Primary Conditions:**
- Market position relative to neutral zones (BB analysis)
- Volatility range between 15-60% of ATR(3)
- News event screening (high-impact economic releases)
- Market session timing constraints (before calculated session end)
- US Bank Holiday considerations
**Exception Conditions:**
- High-impact news with rebreak patterns
- Reversal patterns during neutral market conditions
### Technical Specifications of the Methodology
**Range Definition:**
- Time Period: First 15 minutes after market open
- Measurement: High-Low range calculation
- Breakout Trigger: 5-minute close outside established range
**Volatility Analysis:**
- Formula: (Range Points / ATR(3) Previous Day) × 100
- Threshold Ranges:
- <15%: Below minimum threshold
- 15-20%: Low volatility range
- 25-30%: Moderate volatility range
- 30-40%: Good volatility range
- 40-50%: High volatility range
- 50-60%: Very high volatility range
- >60%: Above maximum threshold
**News Event Categories:**
- Major Events: NFP, CPI, PPI, FOMC releases
- Minor Events: All significant economic releases during market hours
- Impact Assessment: Market reaction analysis framework
**Trend Analysis Framework (1H Bollinger Bands):**
- Base Calculation: EMA(200) with standard deviation bands
- Reference Points: Market Open, ORB Close, Trigger Bar
- Decision Logic: 2 out of 3 reference points determine bias
- Zone Classifications:
- Within 0.5 multiplier: Neutral zone
- Within 1.5 multiplier: Directional bias zone
- Outside 1.5 multiplier: Strong directional zone
**Timing Constraints:**
- Session Window: Market open to calculated session end (typically 4.5 hours)
- Retracement Analysis: Maximum adverse movement before breakeven or stop loss
**Manual Calculation Process (Automated by Indicator):**
1. Measure range in points using chart measurement tools
2. Switch to daily timeframe
3. Set ATR period to 3
4. Extract previous day's ATR value
5. Calculate: (Range Points ÷ ATR Value) × 100
6. Apply percentage thresholds for analysis
## Core Components and Calculation Methods
### 1. Opening Range Calculation
**Data Source:** High/Low/Close prices of current timeframe
**Calculation:**
- Defines a configurable time period (default: 15 minutes)
- Collects during this period: `range_high = max(high)` and `range_low = min(low)`
- Calculates Range Size: `range_size = range_high - range_low`
- Stores the last close price of the period: `final_orb_close`
### 2. ATR (Average True Range) Integration
**Data Source:** Daily True Range values
**Calculation:**
```
daily_atr = ta.atr(length) // Default 3 periods
atr_yesterday = daily_atr // Previous trading day
```
**Available Methods:** RMA (default), SMA, EMA, WMA
### 3. Volatility Ratio Calculation
**Formula:**
```
ratio = (range_size / atr_yesterday) * 100
```
**Purpose:** Normalization of current range against historical volatility
**Configurable Parameters:** Min/Max thresholds (default: 15-60%)
### 4. Bollinger Bands Integration (1H Timeframe)
**Data Source:** 1-hour chart data via `request.security()`
**Calculation:**
```
bb_ema = ta.ema(close, 200) // 1H timeframe
bb_std = ta.stdev(close, 200) // 1H timeframe
bb_upper = bb_ema + (bb_std * multiplier)
bb_lower = bb_ema - (bb_std * multiplier)
```
**Configurable Multipliers:**
- Neutral Zone: 0.5x standard deviation
- Strong Zone: 1.5x standard deviation
### 5. Trend Filter System (2/3 Method)
**Components:**
1. **NY Open Signal:** Compares 1H open price with BB levels
2. **ORB Close Signal:** Compares final ORB close with BB levels
3. **Trigger Signal:** Compares breakout price with BB levels
**Logic:**
```
if (bullish_signals >= 2) → "BULLISH"
if (bearish_signals >= 2) → "BEARISH"
else → "MIXED" or "NO TREND"
```
## Component Interaction
### Trade Signal Generation
**Algorithm:**
```
trade_allowed = (orb_ratio >= min_threshold AND orb_ratio <= max_threshold)
AND (bb_signal != "NEUTRAL")
AND (trend_filter_result contains "BULLISH" OR "BEARISH")
```
### Risk Management Calculation
**Entry Points:**
- Long Entry: `range_high`
- Short Entry: `range_low`
**Stop Loss Calculation:**
```
sl_level = range_low + (range_size * sl_position_percent / 100)
```
**Take Profit Calculation:**
```
tp_distance = range_size * tp_factor_percent / 100
long_tp = long_entry + tp_distance
short_tp = short_entry - tp_distance
```
**Position Sizing (CFD-optimized):**
```
risk_per_contract = avg_risk_points * contract_value * lot_size
max_contracts = max_risk_amount / risk_per_contract
```
**Margin Calculation (CFDs):**
```
position_value = total_units * entry_price
margin_required = position_value / leverage
```
## Dashboard Elements
### 1. Volatility Filter Section
- **ORB Range:** Current range in points
- **ATR Previous:** Yesterday's ATR values
- **ORB Ratio:** Calculated ratio with color coding
### 2. Trend Filter Section
- **NY Open vs BB:** Position of 1H open relative to BB
- **ORB Close vs BB:** Position of ORB close relative to BB
- **Trigger Bar vs BB:** Position of breakout price relative to BB
- **Trend Result:** Summary of 2/3 filter
### 3. Risk Management Section (optional)
- **R/R Ratio:** Calculated from TP/SL distances
- **Risk per Lot:** Based on instrument type
- **Max Lot Packages:** Automatic position sizing calculation
- **Margin Required:** For CFD instruments
### 4. Journal Section (optional)
- **Breakout Timing:** Categorization by bars (1-3, 4-6, 7-9, 10-12, 13+)
- **Direction Tracking:** Bullish/Bearish breakout direction
- **Position Analysis:** Distance of breakout to ORB range
## Automatic Instrument Detection
**CFD/Index Treatment:**
```
if (syminfo.type == "cfd" OR syminfo.type == "index")
contract_value = 1.0 * cfd_lot_size
```
**Forex Treatment:**
```
if (syminfo.type == "forex")
contract_value = syminfo.pointvalue * cfd_lot_size
```
**Futures/Stocks:**
```
contract_value = syminfo.pointvalue
```
## Timezone Handling
- All time calculations based on configurable timezone
- Session End Time: ORB Start + 4.5 hours
- Automatic overflow handling for 24h format
## Alert System
**ORB Formation Alert:**
- Triggered upon completion of ORB period
- Includes: Range size, high/low values
**Breakout Alert:**
- Triggered on close price outside ORB range
- Includes: Direction, trade status based on filters
## Configuration Options
- **ORB Period:** Start/end time in hours/minutes
- **ATR Parameters:** Period and calculation method
- **Volatility Thresholds:** Min/max percentage limits
- **BB Parameters:** Period and multipliers
- **Risk Management:** Risk amount, SL/TP positions
- **Dashboard Layout:** Position, size, colors, visibility
## Data Integrity
- State variables with `var` declaration for persistence
- Daily reset of all relevant variables
- Lookahead bias prevention through `barmerge.lookahead_off`
- Multi-timeframe safety through `request.security()` functions
This technical implementation provides a comprehensive analysis framework for Opening Range Breakout patterns with integrated volatility, trend, and risk management components.

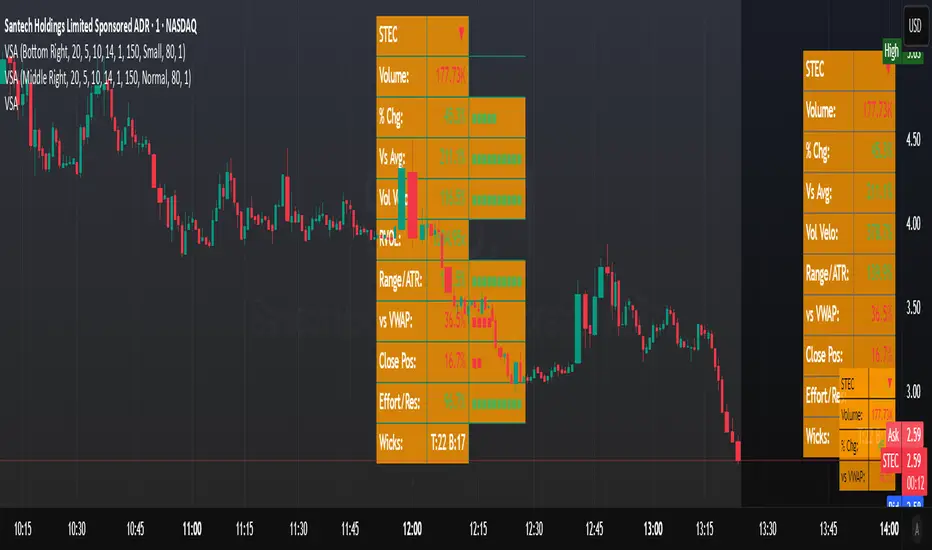
VSA - The Volume HUDVSA Volume HUD: Your At-a-Glance Volume Dashboard
Tired of cluttered charts with multiple indicators taking up screen space?
The VSA Volume HUD is a clean, powerful, and fully customisable Heads-Up Display that puts all the critical volume and price action data you need into one compact box, right on your chart.
Designed for traders who rely on Volume Spread Analysis (VSA), this tool helps you instantly gauge the strength, conviction, and context behind every price move as it happens.
Key Features
This indicator isn't just about showing the current volume; it provides a comprehensive, real-time analysis of the market's activity.
Real-time VSA Dashboard: A persistent on-screen table that updates with every tick, giving you instant feedback without needing to look away from the price. The HUD is fully draggable (hold Ctrl/Cmd + click and drag) to place it anywhere you like.
Essential Volume Metrics:
Current Volume: Displayed in a clean, abbreviated format (e.g., 1.25M for millions, 54.3K for thousands).
% Change (vs. Previous Bar): Instantly see if volume is expanding or contracting.
Vs Short-Term Average: Compare the current bar's volume to a moving average to spot unusual spikes.
Volume Velocity: Measures the rate of change in volume over a short period, helping you spot acceleration or deceleration in market interest.
Relative Volume (RVOL): See how the current volume compares to the average for that specific time of day, perfect for identifying abnormally high or low activity.
Price Action & Volatility Context:
Range vs. ATR: Quickly determine if the current bar's volatility is expanding or contracting compared to the recent average.
Price vs. VWAP: See how far the current price has deviated from the session's Volume-Weighted Average Price, a key level for institutional traders.
Deep Customization is Key
Tailor the HUD to perfectly match your trading style and chart aesthetic.
Display & Layout:
Compact Mode: Remove the metric labels for a sleek, minimalist view that saves screen space.
Bar Meters: Enable optional visual bars next to key metrics for a quick, graphical representation of strength.
Total Control: Toggle every single metric on or off to build the exact dashboard you need. Adjust text size, position, and background opacity with ease.
Smart Coloring & Visual Alerts:
Advanced VSA Coloring: This isn't just about up/down candles. The script intelligently colors volume based on confluence. It highlights increasing volume on a strong up-bar (bullish confirmation) or increasing volume on a down-bar (potential climax or distribution), giving you a deeper VSA context.
High Volume Highlight: Make standout bars impossible to miss! The entire HUD background can change color automatically when volume surges past a custom threshold (e.g., over 150% of the average), instantly drawing your attention to critical moments.
Full Color Customization: Change every color to match your chart's theme, including separate colors for bullish/bearish moves, the background, and the border.
How to Use It
The VSA Volume HUD is a powerful confirmation tool. Use it to:
Confirm Breakouts: Look for a spike in Volume vs. Average and RVOL as price breaks a key level.
Spot Exhaustion: Notice high volume on a narrow-range candle after a long trend, visible through the Range/ATR metric.
Gauge Conviction: Use the Advanced Coloring to see if volume is supporting the price move (e.g., green volume on a green candle) or diverging from it.
Close Location Value (CLV)A script that calculates where price closes relative to its low range.
0.7-1= strong bullish
0.5 to -0.5 = mid range
-1 to -0.7 strong bearish

RSI Bands With RSI - ATR Trend LineRSI Bands With RSI - ATR Trend Line (Smoothed Baseline)
Overview
A trend-following tool that fuses RSI-based regime detection with a smoothed baseline and ATR bands. Trend line aims to stay with the RSI move, cut random noise, and flip cleanly. The line draws green in bulls and red in bears; signals fire only on candle close confirmed flips.
Key Features
✅ Dynamic Trend Detection
RSI (>50 / <50) sets bullish/bearish regime
Smoothed baseline adapts to price while damping whipsaw
ATR-based bands expand/contract with volatility
✅ Precise Signal Generation
Buy when trend flips to bullish (close confirms above the upper band)
Sell when trend flips to bearish (close confirms below the lower band)
Flips require a real band break → fewer false transitions
✅ Visual Clarity
Green line = bullish trend, Red line = bearish trend
✅ Customizable Settings
RSI Length (default 14)
Baseline Smoothing (default 26)
ATR Length (default 14)
ATR Multiplier (default 1.4)
Toggles for Signals and Labels
✅ TradingView Alerts
Built-in Buy & Sell alerts (recommend Once per bar close)
How It Works
Algorithm Logic
RSI Regime: RSI above/below 50 sets bull/bear. At exactly 50, the prior target is carried forward.
Target & Smoothing: A per-bar target is built from the bar’s range and RSI, then smoothed with an EMA-style filter (Baseline Smoothing) to form the baseline.
ATR Bands: Upper/Lower = baseline ± (ATR × Multiplier).
Flip Rule (Supertrend-like):
Close above upper band → bullish flip; trend line tracks the lower band (green).
Close below lower band → bearish flip; trend line tracks the upper band (red).
Between bands → prior trend line persists.
Signals/Alerts: A flip event generates a Buy/Sell signal and alert.
Best Use Cases
Trending Markets – Built to ride sustained moves in either direction.
Multiple Timeframes – Works from intraday to higher TFs; higher TFs usually produce cleaner flips.
Various Asset Classes – Forex, Indices, Stocks, Crypto, Commodities; ATR adapts to volatility.
Recommended Settings
Conservative (Lower Frequency)
RSI 14–20 • Baseline 34 • ATR 14–21 • Multiplier 1.8–2.2
Use for swing/position trading; calmer signal stream.
Balanced (Default)
RSI 14 • Baseline 26 • ATR 14 • Multiplier 1.4
Good general-purpose setup for swing or active intraday.
Aggressive (Higher Frequency)
RSI 10–14 • Baseline 13–21 • ATR 10–14 • Multiplier 1.1–1.3
For scalping/day trading; earlier but noisier flips.
🎨 Visual Elements
RSI Smooth baseline (soft blue)
Upper/Lower ATR Bands (faint blue)
Trend Line (Bull/Bear) drawn only in the active regime (green/red)
Optional Buy/Sell arrows and labels
⚠️ Important Notes
Signals on Close
Flips confirm on bar close. Intrabar crosses can revert; wait for confirmation.
Risk Management
Size positions appropriately; many traders trail beyond the opposite band/line.
Factor in spread, slippage, sessions, and news.
Confirmation & Testing
Combine with structure/volume/HTF bias if desired.
Backtest and forward-test per instrument and timeframe.
For research/education only; not financial advice.
EMA Crossover Entry + ATR ExitOverview
A robust trend-following strategy that combines multiple Exponential Moving Averages (EMAs) for precise entry signals with smoothed Average True Range (ATR) for dynamic, volatility-based exits. Designed for traders who want to capture strong trending long-term moves while protecting profits with intelligent stop-loss management.
Strategy Logic
Entry Signal:
- Enters LONG when price closes above EMA 20, AND
- EMA 20 > EMA 50 > EMA 100 > EMA 200 (Perfect bull alignment)
Ensures entry only during confirmed uptrends with all EMAs properly stacked
Exit Signal:
- Uses smoothed ATR.
- Creates dynamic trailing stop that adjusts to market volatility
- Exits when price closes below ATR.
Check volume in addition to this, to boost confidence for your entry.
This works well for Long Term Investment.
Use Daily or Weekly timeframe.
Key Features
✅ Trend Confirmation: Four-EMA stack ensures strong trend alignment before entry
✅ Volatility-Adaptive Exits: ATR smoothing prevents whipsaw exits in choppy markets
Perfect for traders seeking systematic trend-following with professional risk management. Combines the reliability of multiple timeframe trend confirmation with the precision of volatility-based exits.
Happy Investing!
:)
Feel free to provide feedback; I would love to hear from you.
Note:
Strategy executes on bar close to prevent repainting.
Past performance does not guarantee future results.
Use proper risk management.

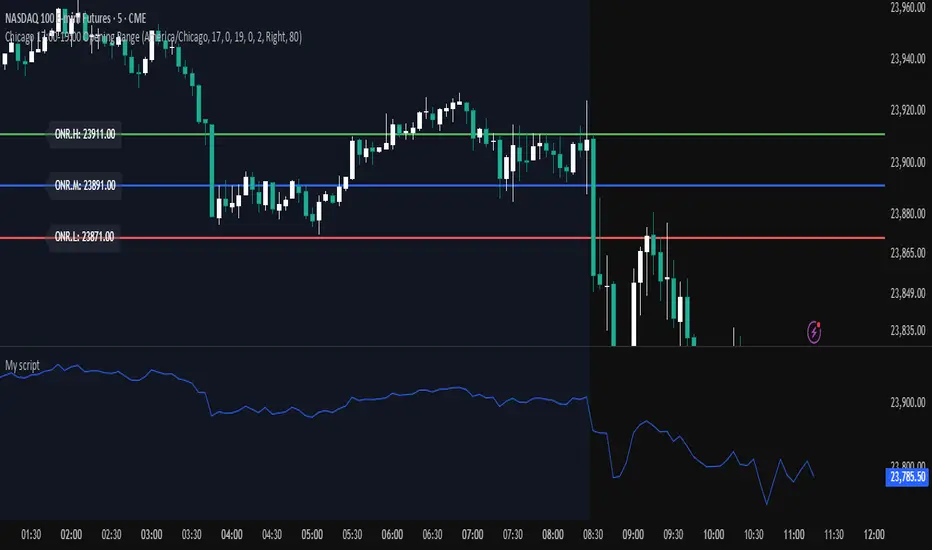
Chicago 17:00-19:00 Overnight RangeThis indicator will map out range high and range low of previous 17:00 - 19:00 of the chart. It can also display mid range if needed
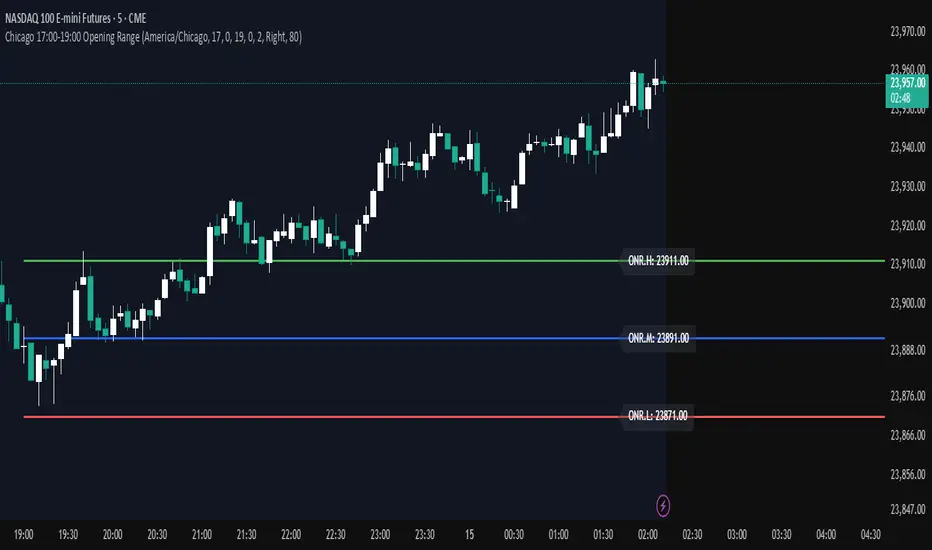
Opening Range — Chicago 17:00-19:00 (Customizable)Maps opening 2 hour range of Chicago timezone with the range high range low and medium zone. It can be customized to fit your needs
ATR x2 AUTODescription:
This indicator automatically plots ATR-based horizontal levels for each of the most recent candles, helping traders visualize potential stop-loss hunting zones, breakout areas, or price reaction points.
It works by taking the Average True Range (ATR) over a customizable period and multiplying it by a user-defined factor (default: ×2). For each of the last N candles (default: 5), it calculates and draws:
Below green candles (bullish) → A horizontal line placed ATR × multiplier below the candle’s low.
Above red candles (bearish) → A horizontal line placed ATR × multiplier above the candle’s high.
Doji candles → No line is drawn.
Each line extends to the right indefinitely, allowing traders to monitor how price reacts when returning to these ATR-based levels. This makes the tool useful for:
Identifying likely stop-loss clusters below bullish candles or above bearish candles.
Anticipating liquidity sweeps and fakeouts.
Supporting breakout or reversal strategies.
Key Features:
Customizable ATR length, multiplier, number of recent candles, and line thickness.
Separate colors for bullish and bearish candle levels.
Automatic real-time updates for each new bar.
Clean overlay on the main price chart.
Inputs:
ATR Length → Period used for ATR calculation.
Multiplier → Factor applied to the ATR distance.
Number of Candles → How many recent candles to track.
Line Thickness and Colors → Full visual customization.
Usage Tip:
These levels can be combined with key market structure points such as support/resistance, trendlines, or the 200 EMA to anticipate high-probability price reactions.

Market Open Impulse [LuciTech]Market Open Impulse Strategy
The Market Open Impulse Strategy is designed to capture significant price movements that occur at market open (2:30 PM UK time). This strategy identifies impulsive candles with high volatility and enters trades based on the direction and strength of the initial market reaction.
How It Works:
The strategy activates exclusively at 2:30 PM UK time during market open sessions. It uses ATR-based volatility filtering to identify impulsive candles that exceed a configurable multiplier (default 1.5x ATR). Long entries are triggered when an impulsive candle closes above its midpoint and above the opening price, while short entries occur when an impulsive candle closes below its midpoint and below the opening price.
Risk management is handled through precise stop loss placement at the opposite extreme of the impulse candle (high for short positions, low for long positions). Take profit levels are calculated using a configurable risk-reward ratio with a default setting of 3:1. Position sizing is automatically calculated based on the percentage risk per trade, and an optional breakeven feature can move the stop loss to the entry price at specified profit levels.
The strategy incorporates time-based filtering to ensure trades only occur during the specified market open window. Visual indicators highlight qualifying impulsive candles and plot all entry and exit levels for clear trade management. The system offers flexible risk management with customizable risk percentage, risk-reward ratios, and breakeven settings, along with multiple stop loss calculation methods including both ATR-based and candle-based options.
Key Parameters:
Market open timing is fully configurable through hour and minute settings for strategy activation. The impulse ATR multiple sets the minimum volatility threshold required for trade qualification, with visual highlighting available for qualifying setups. Risk management parameters include the percentage of account equity to risk per trade, target profit multiples relative to initial risk, and the profit level threshold for breakeven stop loss adjustment. Users can choose between ATR-based or candle-based stop loss calculation methods and adjust technical parameters for volatility calculation including ATR length and smoothing methods.
Applications:
This strategy is particularly effective for trading market open volatility and momentum, capturing institutional order flow during key timing windows, executing short-term swing trades on significant price impulses, and trading markets with predictable opening patterns and consistent volatility characteristics.


SAR PowerTrend Analyzer Pro [By TraderMan]📈 SAR PowerTrend Analyzer Pro
Hello Trader! 👋 This powerful SAR PowerTrend Analyzer Pro indicator analyzes market trends across multiple timeframes by combining Parabolic SAR and ATR indicators to provide clear and actionable signals. Designed for everyone who wants to track trends and enter trades confidently on TradingView. Here’s the detailed breakdown:
🔍 What’s the core concept?
Parabolic SAR (Stop and Reverse):
A classic tool to detect price reversals and determine trend direction. When price is above SAR → uptrend (bullish), below SAR → downtrend (bearish).
ATR (Average True Range):
Measures price volatility. A higher ATR means stronger trend potential; lower ATR means weak or indecisive trends.
This indicator merges these two to not only tell “up or down” but also provide a numerical trend strength reading. So you can clearly know when a trend is strong or weak.
⏱️ Comprehensive Multi-Timeframe Analysis
It doesn’t rely on just one timeframe! 📊
5 min, 15 min
1 hour, 4 hours
1 day, 1 week, 1 month
Tracking trends on all these simultaneously gives you a more reliable market overview. Helps avoid false signals from short-term noise and align with long-term trends.
🎯 How to use it? (Entry Signals)
Long Signal:
Price crosses SAR line from below → shows “LONG” label and green trend color, indicating bullish momentum.
Short Signal:
Price crosses SAR line from above → shows “SHORT” label and red trend color, signaling bearish trend start.
📊 Visuals and Table on Chart
SAR lines plotted above and below price with clear green/red colors.
Background color changes with trend direction for instant visual feedback.
Top-right table shows each timeframe’s:
Trend Direction (Bullish/Bearish)
Trend Strength (numerical value 0 to 1)
General market direction and strength are summarized in the table’s bottom rows.
⚡ Things to watch before entering trades
Check the table! If most timeframes are Bullish and strong, consider LONG positions.
If most are Bearish and strong, SHORT positions might be safer.
Avoid relying on single timeframe signals, wait for multi-timeframe confirmation.
Always watch price action and volume.
Place stop losses just outside the SAR line to manage risk effectively.
Risk management is key! Protecting your capital matters as much as making profits.
🎉 Why use this indicator?
✅ Multi-timeframe analysis brings the bigger picture to your screen.
✅ Clear color-coded signals make trend following easy and intuitive.
✅ Numerical trend strength optimizes your entry/exit decisions.
✅ Suitable for beginners and pros alike.
✅ Fast, stable, and visually clean on TradingView.
🧠 Pro Tip:
This indicator works best when combined with other technical tools and news analysis. There’s no “magic single indicator,” but a smart combination wins the race! 😉
✨ Add this powerful trend analysis tool to your charts now, catch the market’s rhythm, and boost your gains! 🚀📈

ATR+CCI Monetary Risk Tool - TP/SL⚙️ ATR+CCI Monetary Risk Tool — Volatility-aware TP/SL & Position Sizing
Exact prices (no rounding), ATR-percentile dynamic stops, and risk-budget sizing for consistent execution.
🧠 What this indicator is
A risk-first planning tool. It doesn’t generate orders; it gives you clean, objective levels (Entry, SL, TP) and position size derived from your risk budget. It shows only the latest setup to keep charts readable, and a compact on-chart table summarizing the numbers you actually act on.
✨ What makes it different
Dynamic SL by regime (ATR percentile): Instead of a fixed multiple, the SL multiplier adapts to the current volatility percentile (low / medium / high). That helps avoid tight stops in noisy markets and over-wide stops in quiet markets.
Risk budgeting, not guesswork: Size is computed from Account Balance × Max Risk % divided by SL distance × point value. You risk the same dollars across assets/timeframes.
Precision that matches your instrument: Entry, TP, SL, and SL Distance are displayed as exact prices (no rounding), truncated to syminfo.mintick so they align with broker/exchange precision.
Symbol-aware point value: Uses syminfo.pointvalue so you don’t maintain tick tables.
Non-repaint option: Work from closed bars to keep the plan stable.
🔧 How to use (quick start)
Add to chart and pick your timeframe and symbol.
In settings:
Set Account Balance (USD) and Max Risk per Trade (%).
Choose R:R (1:1 … 1:5).
Pick ATR Period and CCI Period (defaults are sensible).
Keep Dynamic ATR ON to adapt SL by regime.
Keep Use closed-bar values ON to avoid repaint when planning.
Read the labels (Entry/TP/SL) and the table (SL Distance, Position Size, Max USD Risk, ATR Percentile, effective SL Mult).
Combine with your entry trigger (price action, levels, momentum, etc.). This indicator handles risk & targets.
📐 How levels are computed
Bias: CCI ≥ 0 ⇒ long, otherwise short.
ATR Percentile: Percent rank of ATR(atrPeriod) over a lookback window.
Effective SL Mult:
If percentile < Low threshold ⇒ use Low SL Mult (tighter).
If between thresholds ⇒ use Base SL Mult.
If percentile > High threshold ⇒ use High SL Mult (wider).
Stop-Loss: SL = Entry ± ATR × SL_Mult (minus for long, plus for short).
Take-Profit: TP = Entry ± (Entry − SL) × R (R from the R:R dropdown).
Position Size:
USD Risk = Balance × Risk%
Contracts = USD Risk ÷ (|Entry − SL| × PointValue)
For futures, quantity is floored to whole contracts.
Exact prices: Entry/TP/SL and SL Distance are not rounded; they’re truncated to mintick so what you see matches valid price increments.
📊 What you’ll see on chart
Latest Entry (blue), TP (green), SL (red) with labels (optional emojis: ➡️ 🎯 🛑).
Info Table with:
Bias, Entry, TP, SL (exact, truncated to mintick)
SL Distance (exact, truncated)
Position Size (contracts/units)
Max USD Risk
Point Value
ATR Percentile and effective SL Mult
🧪 Practical examples
High-volatility session (e.g., XAUUSD, 1H): ATR percentile is high ⇒ wider SL, smaller size. Reduces churn from normal noise during macro events.
Range-bound market (e.g., EURUSD, 4H): ATR percentile low ⇒ tighter SL, better R:R. Helps you avoid carrying unnecessary risk.
Index swing planning (e.g., ES1!, Daily): Non-repaint levels + risk budgeting = consistent sizing across days/weeks, easier to review and journal.
🧭 Why traders should use it
Consistency: Same dollar risk regardless of instrument or volatility regime.
Clarity: One-trade view forces focus; you see the numbers that matter.
Adaptivity: Stops calibrated to the market’s current behavior, not last month’s.
Discipline: A visible checklist (SL distance, size, USD risk) before you hit buy/sell.
🔧 Input guide (practical defaults)
CCI Period: 100 by default; use as a bias filter, not an entry signal.
ATR Period: 14 by default; raise for smoother, lower for more reactive.
ATR Percentile Lookback: 200 by default (stable regime detection).
Percentile thresholds: 33/66 by default; widen the gap to change how often regimes switch.
SL Mults: Start ~1.5 / 2.0 / 2.5 (low/base/high). Tune by asset.
Risk % per trade: Common pro ranges are 0.25–1.0%; adjust to your risk tolerance.
R:R: Start with 1:2 or 1:3 for balanced skew; adapt to strategy edge.
Closed-bar values: Keep ON for planning/live; turn OFF only for exploration.
💡 Best practices
Combine with your entry logic (structure, momentum, liquidity levels).
Review ATR percentile and effective SL Mult across sessions so you understand regime shifts.
For futures, remember size is floored to whole contracts—safer by design.
Journal trades with the table snapshot to improve risk discipline over time.
⚠️ Notes & limitations
This is not a strategy; it does not place orders or alerts.
No slippage/commissions modeled here; build a strategy() version for backtests that mirror your broker/exchange.
Displayed non-price metrics use two decimals; prices and SL Distance are exact (truncated to mintick).
📎 Disclaimer
For educational purposes only. Not financial advice. Markets involve risk. Test thoroughly before trading live.

Mutanabby_AI | Fresh Algo V24Mutanabby_AI | Fresh Algo V24: Advanced Multi-Mode Trading System
Overview
The Mutanabby_AI Fresh Algo V24 represents a sophisticated evolution of multi-component trading systems that adapts to various market conditions through advanced operational configurations and enhanced analytical capabilities. This comprehensive indicator provides traders with multiple signal generation approaches, specialized assistant functions, and dynamic risk management tools designed for professional market analysis across diverse trading environments.
Primary Signal Generation Framework
The Fresh Algo V24 operates through two fundamental signal generation approaches that accommodate different market perspectives and trading philosophies. The Trending Signals Mode serves as the primary trend-following mechanism, combining Wave Trend Oscillator analysis with Supertrend directional signals and Squeeze Momentum breakout detection. This mode incorporates ADX filtering that requires values exceeding 20 to ensure sufficient trend strength exists before signal activation, making it particularly effective during sustained directional market movements where momentum persistence creates profitable trading opportunities.
The Contrarian Signals Mode provides an alternative approach targeting reversal opportunities through extreme market condition identification. This mode activates when the Wave Trend Oscillator reaches critical threshold levels, specifically when readings surpass 65 indicating potential bearish reversal conditions or drop below 35 suggesting bullish reversal opportunities. This methodology proves valuable during overextended market phases where mean reversion becomes statistically probable.
Advanced Filtering Mechanisms
The system incorporates multiple sophisticated filtering mechanisms designed to enhance signal quality and reduce false positive occurrences. The High Volume Filter requires volume expansion confirmation before signal activation, utilizing exponential moving average calculations to ensure institutional participation accompanies price movements. This filter substantially improves signal reliability by eliminating low-conviction breakouts that lack adequate volume support from professional market participants.
The Strong Filter provides additional trend confirmation through 200-period exponential moving average analysis. Long position signals require price action above this benchmark level, while short position signals necessitate price action below it. This ensures strategic alignment with longer-term trend direction and reduces the probability of trading against major market movements that could invalidate shorter-term signals.
Cloud Filter Configuration System
The Fresh Algo V24 offers four distinct cloud filter configurations, each optimized for specific trading timeframes and market approaches. The Smooth Cloud Filter utilizes the mathematical relationship between 150-period and 250-period exponential moving averages, providing stable trend identification suitable for position trading strategies. This configuration generates signals exclusively when price action aligns with cloud direction, creating a more deliberate but highly reliable signal generation process.
The Swing Cloud Filter employs modified Supertrend calculations with parameters specifically optimized for swing trading timeframes. This filter achieves optimal balance between responsiveness and stability, adapting effectively to medium-term price movements while filtering excessive market noise that typically affects shorter-term analytical systems.
For active intraday traders, the Scalping Cloud Filter utilizes accelerated Supertrend calculations designed to capture rapid trend changes effectively. This configuration provides enhanced signal generation frequency suitable for compressed timeframe strategies. The advanced Scalping+ Cloud Filter incorporates Hull Moving Average confirmation, delivering maximum responsiveness for ultra-short-term trading while maintaining signal quality through additional momentum validation processes.
Specialized Assistant Functionality
The system includes two distinct assistant modes that provide supplementary market analysis capabilities. The Trend Assistant Mode activates advanced cloud analysis overlays that display dynamic support and resistance zones calculated through adaptive volatility algorithms. These levels automatically adjust to current market conditions, providing visual guidance for identifying trend continuation patterns and potential reversal areas with mathematical precision.
The Trend Tracker Mode concentrates on long-term trend identification by displaying major exponential moving averages with color-coded fill areas that clarify directional bias. This mode maintains visual simplicity while providing comprehensive trend context evaluation, enabling traders to quickly assess broader market direction and align shorter-term strategies accordingly.
Dynamic Risk Management System
The integrated risk management system automatically adapts across all operational modes, calculating stop loss and take profit targets using Average True Range multiples that adjust to current market volatility. This approach ensures consistent risk parameters regardless of selected operational mode while maintaining relevance to prevailing market conditions.
Stop loss placement occurs at dynamically calculated distances from entry points, while three progressive take profit targets establish at customizable ATR multiples respectively. The system automatically updates these levels upon trend direction changes, ensuring current market volatility influences all risk calculations and maintains appropriate risk-reward ratios throughout trade management.
Comprehensive Market Analysis Dashboard
The sophisticated dashboard provides real-time market analysis including volatility measurements, institutional activity assessment, and multi-timeframe trend evaluation across five-minute through four-hour periods. This comprehensive market context assists traders in selecting appropriate operational modes based on current market characteristics rather than relying exclusively on historical performance data.
The multi-timeframe analysis ensures mode selection considers broader market context beyond the primary trading timeframe, improving overall strategic alignment and reducing conflicts between different temporal market perspectives. The dashboard displays market state classification, volatility percentages, institutional activity levels, current trading session information, and trend pressure indicators with professional formatting and clear visual hierarchy.
Enhanced Trading Assistants
The Fresh Algo V24 includes specialized trading assistant features that complement the primary signal generation system. The Reversal Dot functionality identifies potential reversal points through Wave Trend Oscillator analysis, displaying visual indicators when crossover conditions occur at extreme levels. These reversal indicators provide early warning signals for potential trend changes before they appear in the primary signal system.
The Dynamic Take Profit Labels feature automatically identifies optimal profit-taking opportunities through RSI threshold analysis, marking potential exit points at multiple levels for long positions and corresponding levels for short positions. This automated profit management system helps traders optimize exit timing without requiring constant manual monitoring of technical indicators.
Advanced Alert System
The comprehensive alert system accommodates all operational modes while providing granular notification control for various signal types and risk management events. Traders can configure separate alerts for normal buy signals, strong buy signals, normal sell signals, strong sell signals, stop loss triggers, and individual take profit target achievements.
Cloud crossover alerts notify traders when trend direction changes occur, providing early indication of potential strategy adjustments. The alert system includes detailed trade setup information, timeframe data, and relevant entry and exit levels, ensuring traders receive complete context for informed decision-making without requiring constant chart monitoring.
Technical Foundation Architecture
The Fresh Algo V24 combines multiple proven technical analysis components including Wave Trend Oscillator for momentum assessment, Supertrend for directional bias determination, Squeeze Momentum for volatility analysis, and various exponential moving averages for trend confirmation. Each component contributes specific market insights while the unified system provides comprehensive market evaluation through their mathematical integration.
The multi-component approach reduces dependency on individual indicator limitations while leveraging the analytical strengths of each technical tool. This creates a robust analytical framework capable of adapting to diverse market conditions through appropriate mode selection and parameter optimization, ensuring consistent performance across varying market environments.
Market State Classification
The indicator incorporates advanced market state classification through ADX analysis, distinguishing between trending, ranging, and transitional market conditions. This classification system automatically adjusts signal sensitivity and filtering parameters based on current market characteristics, optimizing performance for prevailing conditions rather than applying static analytical approaches.
The volatility measurement system calculates current market activity levels as percentages, providing quantitative assessment of market energy and helping traders select appropriate operational modes. Institutional activity detection through volume analysis ensures signal generation aligns with professional market participation patterns.
Implementation Strategy Considerations
Successful implementation requires careful matching of operational modes to prevailing market conditions and individual trading objectives. Trending modes demonstrate optimal performance during directional markets with sustained momentum characteristics, while contrarian modes excel during range-bound or overextended market conditions where reversal probability increases.
The cloud filter configurations provide varying degrees of confirmation strength, with smoother settings reducing false signal occurrence at the expense of some responsiveness to price changes. Traders must balance signal quality against signal frequency based on their risk tolerance and available trading time, utilizing the comprehensive customization options to optimize performance for their specific requirements.
Multi-Timeframe Integration
The system provides seamless multi-timeframe analysis through the integrated dashboard, displaying trend alignment across multiple time horizons from five-minute through four-hour periods. This analysis helps traders understand broader market context and avoid conflicts between different temporal perspectives that could compromise trade outcomes.
Session analysis identifies current trading session characteristics, providing context for expected market behavior patterns and helping traders adjust their approach based on typical session volatility and participation levels. This geographic market awareness enhances strategic decision-making and improves timing for trade execution.
Advanced Visualization Features
The indicator includes sophisticated visualization capabilities through gradient candle coloring based on MACD analysis, providing immediate visual feedback on momentum strength and direction. This enhancement allows rapid market assessment without requiring detailed indicator analysis, improving efficiency for traders managing multiple instruments simultaneously.
The cloud visualization system uses color-coded fill areas to clearly indicate trend direction and strength, with automatic adaptation to selected operational modes. This visual clarity reduces analytical complexity while maintaining comprehensive market information display through professional chart presentation.
Performance Optimization Framework
The Fresh Algo V24 incorporates performance optimization features including signal strength classification, automatic parameter adjustment based on market conditions, and dynamic filtering that adapts to current volatility levels. These optimizations ensure consistent performance across varying market environments while maintaining signal quality standards.
The system automatically adjusts sensitivity levels based on selected operational modes, ensuring appropriate responsiveness for different trading approaches. This adaptive framework reduces the need for manual parameter adjustments while maintaining optimal performance characteristics for each operational configuration.
Conclusion
The Mutanabby_AI Fresh Algo V24 represents a comprehensive solution for professional trading analysis, combining multiple analytical approaches with advanced visualization and risk management capabilities. The system's strength lies in its adaptive multi-mode design and sophisticated filtering mechanisms, providing traders with versatile tools for various market conditions and trading styles.
Success with this system requires understanding the relationship between different operational modes and their optimal application scenarios. The comprehensive dashboard and alert system provide essential market context and trade management support, enabling systematic approach to market analysis while maintaining flexibility for individual trading preferences.
The indicator's sophisticated architecture and extensive customization options make it suitable for traders at all experience levels, from those seeking systematic signal generation to advanced practitioners requiring comprehensive market analysis tools. The multi-timeframe integration and adaptive filtering ensure consistent performance across diverse market conditions while providing clear guidelines for strategic implementation.
