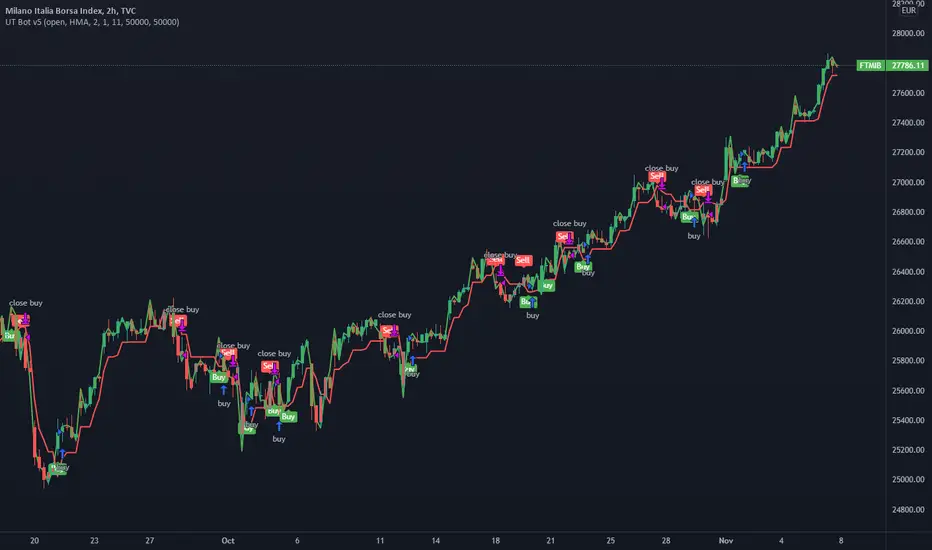
UT Bot v5This is an update by request, on someone elses strategy! well more of an edit, but also update from pine v4 to pine v5.
//CREDITS to HPotter for the orginal code. The guy trying to sell this as his own is a scammer lol.
//Edited and converted to @version=5 by SeaSide420 for Paperina
The UT Bot v5 is Movinging average (the MA) vs ATR (the ATR is in the form intended for use as trailing stop loss (ATR_TSL))
Entry logic:
buy = the MA > ATR_TSL and Price > ATR_TSL
sell = the MA < ATR_TSL and Price < ATR_TSL
The Moving average type can be changed in the settings:
options = "SMA", "EMA", "WMA", "HMA"]
the edits i made were:
convert to v5
Add TP and SL
Add Buy only or Sell only option
Add MA type option
Add price source option
Draw MA and ATR_TSL on-chart
真實波幅均值(ATR)
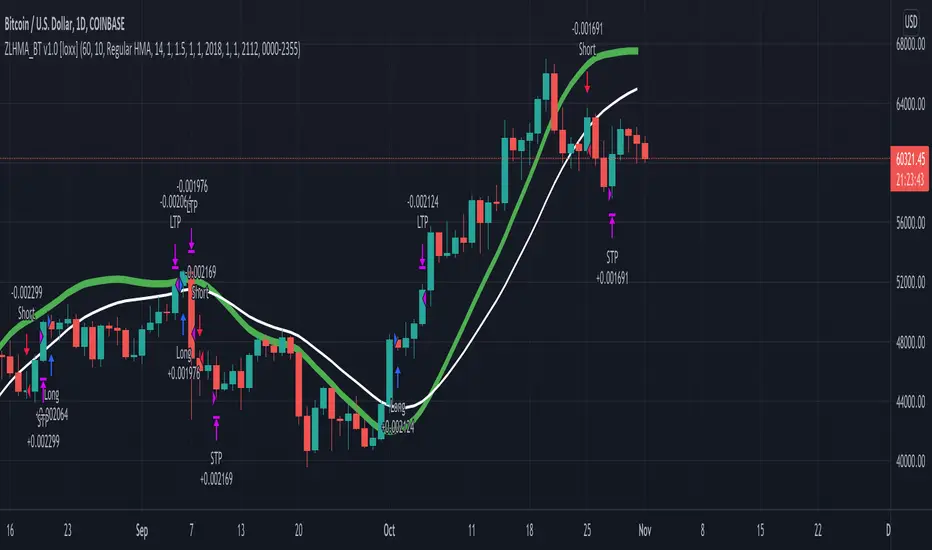
Zero-Lag HMA Backtest v1.0 [loxx]This backtest compares profitability differences between a regular Hull Moving Average ( HMA ) and a Zero-Lag HMA .
Things to know:
- Profit is set to 1 ATR
- Stop-loss is set to 1.5 ATR.
- This is by design to test the minimum the profit scenario (1 ATR up) and the worst case loss scenario (1.5 ATR down) for momentum trading. Actual results vary when additional TPs are added
How to use:
- Adjust settings and dates to view different market structures and position scenarios
- See results in the "Strategy Tester" pane
Conclusions and what's next
- Modifying HMA does very little to improve backtest results
- Future iterations will include options to backtest various moving averages with additional modifiers to improve profits and avoide losses
Comment below or send a PM with questions, comments, observations, or concerns.
Logarithmic Average True Range
In the case of ATR, it is known to represent volatility by simply expressing the price range.
However, of course, as the value of an asset increases, it is not possible to simply compare it with a numerical value, so the ATR was expressed as a percentage using a logarithmic function.
This way we can see the volatility even with ATR.
ATR의 경우 단순하게 가격의 범위만을 표현하여 변동성을 나타낸다고 알려져있습니다.
하지만 당연하게도 자산의 가치가 높아질수록 단순하게 수치만으로 비교할 수는 없고, 따라서 로그함수를 사용해 %로 ATR을 표현하였습니다.
이렇게 표현하면 ATR로도 변동성을 볼 수 있습니다.

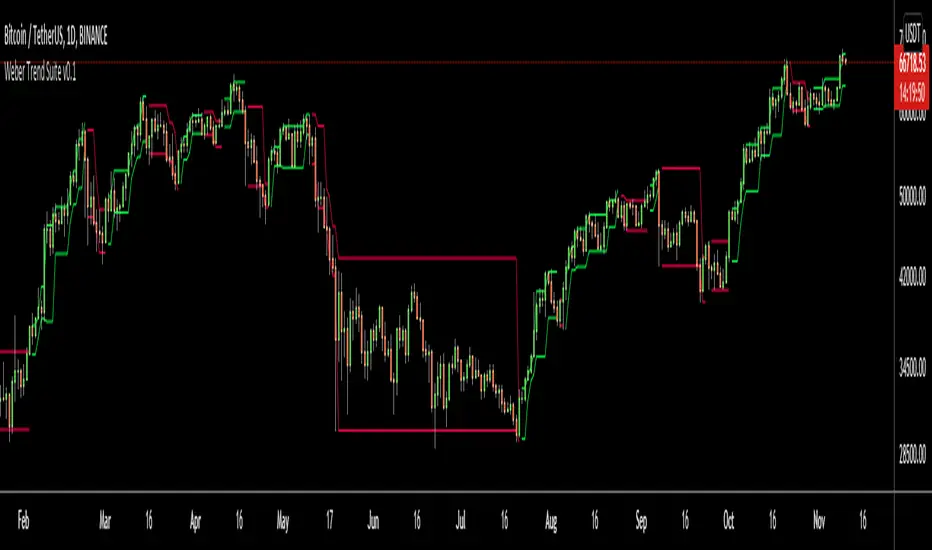
Weber Trend SuiteThe Weber Trend Suite (WTS) supports trend trading over longer timeframes.
Identification of the trend direction
Automatic identification of support and resistance level
Multi-Timeframe
Designed as a decision making framework for trading trending growth assets such as tech stocks and cryptocurrencies
The support and resistance lines are derived from the high, low and direction (bearish/bullish) from the latest outside bar at a time. The timeframe on which outside bars are detected can be chosen freely by the user. The importance of an outside bars tends to increase with the timeframe. Outside bars can play an important role in price action trading by providing support and resistance levels as well as the currently predominant trend direction. So this indicator enables a trader to automatically display the high, low and direction of the current outside bar from two different (usually higher) timeframes and therefore gives rationally and automatically derived support and resistance levels as well as the predominant trend direction from the chosen timeframes. The adjustable crossing EMA with its volatility noise filter gives further guidance on the current trend direction and strength.
The WTS can help traders and investors following a rule based system by providing a measure of trend strength and consistency as well as specific support and resistance levels.
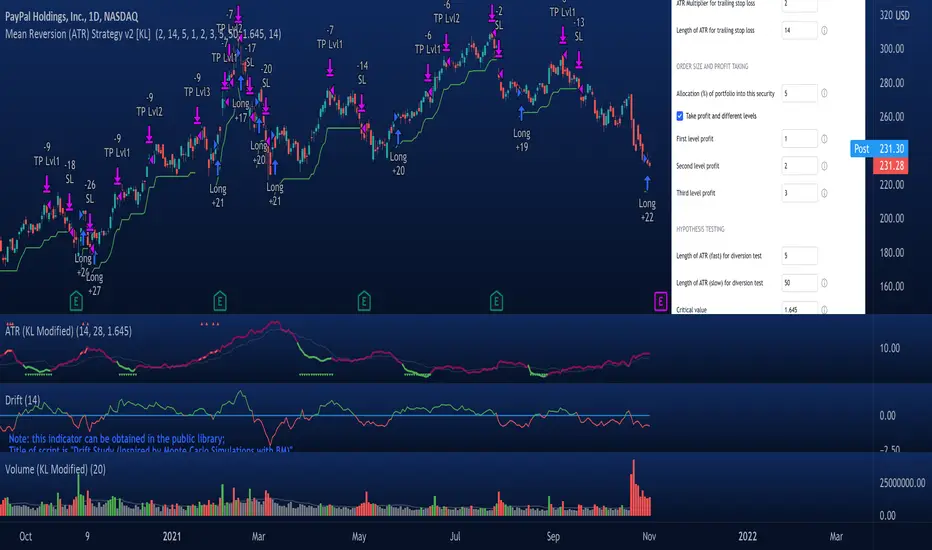
Mean Reversion Strategy v2 [KL]Description :
This strategy will enter a position when the following conditions are met:
a) Main signal: When source data (ATR) diverts from its moving average value, and
b) Confirmation: If predicted direction of trend is favorable.
Assumptions :
During periods of high price volatility, ATR diverts from its moving average value. Eventually, ATR should revert. But since just knowing the magnitude of increase/decrease of ATR does not indicate a trend signal, we need to introduce a model to predict the current trend.
In short:
• Trend Prediction : This strategy calculates the expected logarithmic return of the security (the "Drift") and considers prices to be moving in uptrend if the drift curve is upward sloping.
• Assessment of ATR diversion : To determine "yes/no" regarding whether ATR at a given point in time has diverted, this script conducts a two-tailed hypothesis test at each candlestick period. The null hypothesis (H0) is that the fast moving average value should equal the slow moving average value (say, denoted as H0: atr14 == atr28; it is assumed that atr28 is more meaningful for the purpose of describing the current trend because it has a larger sample size). Investopedia has an article summarizing this topic .
Exit Condition :
When trailing stop loss hits.
Previous version :
This strategy is based on Version 1 published back in September . This older version considers +/- one standard deviation to be the critical values relative to average ATR when testing whether ATR has diverted from the mean. This does not take Standard Error ("SE") into account. As a result, the threshold is often too wide and it generates too many entry signals.
ATRSLTPTwo adjustable ATRs are drawn on the screen for gradual stop, the ATR multiplier can be changed in the settings. the green line shows the target point with 5 ATR (cannot be changed)

[CP]Pivot Boss Floor Pivots with ATR Dilation and Dynamic LevelsINTRODUCTION:
Compared to all the Pivot Indicators available on Trading View Public Library, this Floor Pivots Indicator differentiates itself in two major original ways:
Dilates the Pivot Support/Resistance Levels into Support/Resistance Bands based on volatility
Displays the S/R Levels Dynamically , that is, only those levels will be shown that are close enough to the price resulting in much cleaner looking charts.
There were a few features whose logic I had figured out, but I could not implement them due Pine Script’s Limitation (they should really work on increasing Pine Script’s capacity instead of adding more and more features to the language in order to make it look ‘better’):
Showing multiple timeframe pivots at the same time (not possible due to Pine Script’s limitation on the ‘Max Number of Outputs’ )
Automatic Detection of highly profitable Double Hot Pivot Zones (DPZ), also due to the ‘Max Number of Outputs’ limit
GENERAL USER INPUTS:
Most of the settings are self-explanatory, however, a few of them need some explanation:
Show Floor Pivots Dynamically – This will turn ON the dynamic pivot levels, please note that this function will work ONLY IN INTRADAY timeframes.
Dynamic Pivot ATR Period – Period over which the ATR value is calculated to show the pivots dynamically.
ATR Threshold for Dynamic Floor Pivots – Simply put, the indicator will start displaying Pivot Levels if they fall within the 2*ATR distance (default value) of the price. You can increase this number if the volatility increases and vice-versa.
Use ATR to Dilate Intraday Pivot Levels – This will turn ON Floor Pivot Dilation, turning pivot ‘lines’ into ‘bands’ .
ATR Dilation Factor – This number decides the width of the Pivot bands. Larger this number, thicker the bands. Typically, high volatility stocks will require a higher number.
ATR Period – Same as Dynamic Pivot ATR Period, but for Pivot Level Dilation.
INDICATOR USAGE EXAMPLES:
This indicator works great in conjunction with my Pivot Boss Candlestick Scanner indicator.
There are a lot of optimizations I have done in the code, although it looks trivial at first glance, but it's fairly complex.
Feel free to use it and modify it as you wish.
Here are a few examples where the indicator has shown great entries and exits, with the default settings:
NIFTY 5m Chart
Reliance 5m Chart
Tesla 5m Chart
Bitcoin-USDT 15m Chart
FINAL WORDS:
Please understand that I have Cherry Picked the examples to showcase the capability of the indicator and its usage.
DO NOT conflate the accuracy of examples with the accuracy of this indicator.
Once you start using floor pivots, you will realize that a lot of days simply don’t give any high probability setups and you will simply sit out of the market and do nothing (which is a good thing).
If you really want to learn how to use Pivots, read the book ’Secrets of a Pivot Boss’ . This book can change your life.

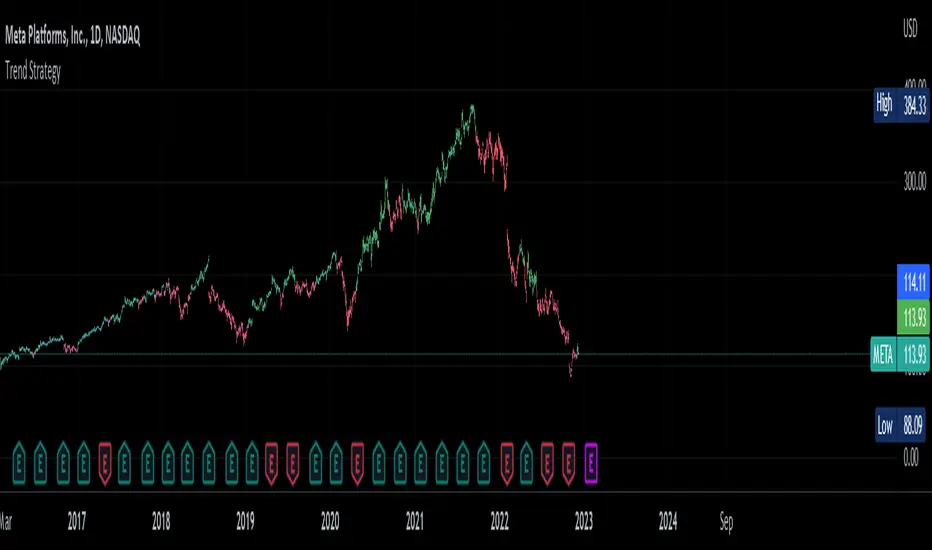
Trend Strategy by zdmreThis Strategy is a trend following indicator. It is plotted on price and the current trend can be determined by its placement vis-a-vis price. It is constructed with just three parameters: Period, Multiplier and Entry/Exit Point with Superformula.
The default parameters are 14 for Average True Range (ATR) and 4 for its multiplier. The average true range (ATR) plays a key role in ‘Trend’ as the indicator uses ATR to compute its value and it signals the degree of price volatility. You should note that any changes to these numbers can affect the use of the Trend indicator.
While you using this indicator, you should not avoid putting your stop loss.
For a long position, you can put stop loss right at the red indicator line. For a short position, you can put it at the green indicator line. You can insert your own settings as well.
Using Trend Strategy along with a stop loss pattern is the best way for earning the best wealth in trading.
There is no best setting for any trading indicator.
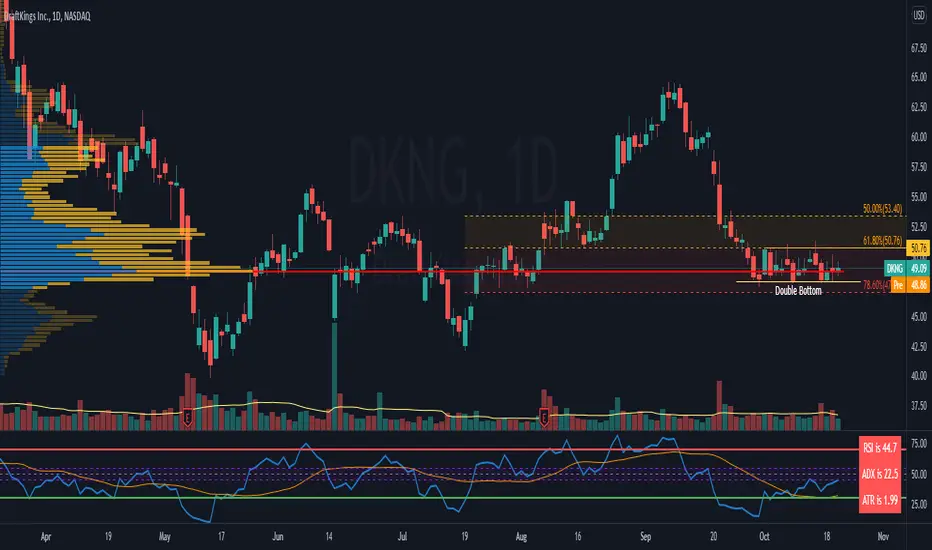
RSI c/w MA, ADX and ATR data I have added 3 items to the RSI indicator which helps me to get more information at the same time.
1) ADX value - when ADX is above 25 we have a strong trend
2) ATR Value - helps me to calculate my daily targets and stop-loss levels at a glance.
3) A simple moving average - This shows me the trend of RSI. If the price breaks a trend line and at the same time RSI crosses above the MA, it shows me a breakout has happened. In longer timeframes, it can show you in advance if you should expect a reversal in the trend.
You can turn on or off the MA as well as the ADX line.
Bjorgum AutoTrailOne Time Trade Risk Management
Incorporating the new interactive feature, this script is meant as a one time trailing stop for the active trader to manage positional risk of an ongoing trade. As a crypto trader or Fx trader, many may find themselves in a position late into the evening, or perhaps daily life is calling while a trade progresses in their favor. Adding a trailing stop to a position thats trending can help to keep you in the trade and lock in gains if things turn around when you are unable to react.
To use the trail, the user would add the script to the chart. Once added, a set of crosshairs will appear allowing the user to choose a point to begin. Often choosing to start a trail from a swing high/ low can be an ideal option. This tends to provide some protection for a stop by placing it under support for a long trade or above resistance for a short trade.
Price based trail
The trail will automatically plot and the offset is a factor of the distance from price action selected by the crosshairs. If placed above price action the script will plot a short trail, if placed below it will trail for a long position.
Additionally, there are several other trail types other than price based. There is also percent based, which offsets the trail as a percent from close. A hard stop is placed at the cross hair value, then once the distance is exceeded by the percentage specified, the trail begins.
There are 2 more volatility based trails. There is a PSAR trail which can provide quicker and tighter stops that accelerate with the trend locking in gains faster, and an ATR trail that keeps a distance from price action as a function of volatility. Volatility levels can be adjusted from the menu.
Volatility based trail (ATR)
Volatility based trail (PSAR)
Lastly, within the code for more the more technical savvy, is some starting setups for string alerts to be sent to exchanges via 3rd party or custom API applications. Some string manipulation is required for specific providers to meet their requirements, but there is some building block alerts that will take the ticker symbol, recognize the asset your trading (Fx, Crypto, etc) and take input quantity or exchange names from the settings via inputs.
Complex strings can be built to perform almost any trade related task when to comes to alerts via web hook. A little setup this way with some technology to back your system can mean a semi-automated half man, half machine setup that actually manages your trail stop while you cannot. For those that don’t go this far, there is some basic alert functionality that well trigger when a trail is hit so you can react and make a decision.
Please note that for now, interactive mode is engaged only when the script is added to the chart. Additional stops, or for adjustments to be made it is best to add a new version. Also as real trades could be at play managing an actual position, alerts are designed to go off only once to ensure no duplicate orders are sent meaning alerts are not reoccurring. Once an alert is triggered, a new trail is to be set up.
A modified version of the TradingView built in SAR equation was used in this script. To provide the value of the SAR on the stop candle, it was necessary to alter the equation to extract this value as the regular SAR “flips” at this point. Thank you to TradingView for supplying access to the built in formula so that this SAR could behave the same as the built-in function outside of these alterations
Example of SAR value maintained in trigger candle
Cheers and happy trading.

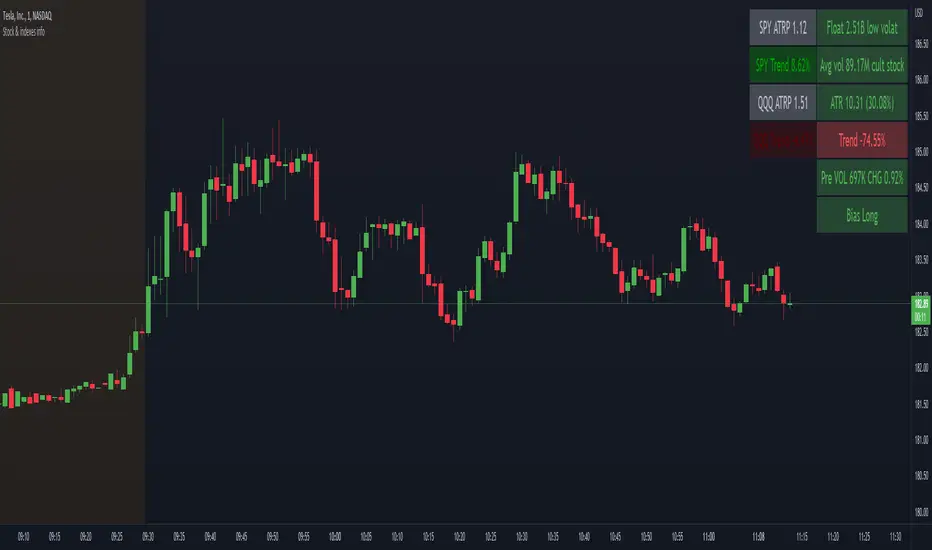
Stock float, avg volume, pre-market info and indexes atrp, trendNASDAQ:AAPL
This indicator shows the most usefull informations about the current symbol and the two common indexes (SPY and QQQ) in a table, in the upper right corner of the graph.
The informations are:
Symbol
Float
Daily average volume
Average True Range
Pre-market volume
Pre-market change %
Indexes
SPY ATRP
SPY trend (this value indicates how much the symbol is changing from the last X bars of Y minues. Higher values means a stronger trend)
QQQ ATRP
QQQ trend (same as SPY trend)
The indicator is highly customizable. Here are some of the settings:
Compact view
Text size
Every information is hidable
Most of the informations have customizable warning
Background color with thresholds
Period/lenght of the indicators
Buy On Dip StrategyStrategy:
Finding entry using pullback or Buy On Dip method.
This indicator using EMA line and ATR strategy to find best entry.
EMA line consist of :
EMA 20, EMA 50 and EMA 100.
Entry signal when candle rebound on EMA line and rocket signal appeared.
Exit when "SL" signal appeared.
1. Add Extreme Candle signal
- cross signal above candle
- Appeared if candle close outside Bollinger Band.
- Be cautious and do not try to make entry unless you are an expert.
2. Add EMA 200
- Can be turned on or off

Kaufman's Efficiency Ratio Strategy [KL]I recently published an indicator called "Kaufman's Efficiency Ratio Indicator". In the description of that script, I hypothesized about how the Efficiency Ratio could be applied to identify bullish moves in instances where price had already gone up steeply, but rests for a while, allowing for entry in expectation that price will continually rise. I decided to test out this idea with Pinescript.
About Kaufman's Efficiency Ratio ("ER")
ER was developed by a systematic trader by the name of Perry J. Kaufman.
Formula
The formula is:
= A divided by B,
where:
A = Current closing price minus the closing price at the start of the lookback period
B = Sum of differences between closing prices (in absolute terms) of consecutive bars over the lookback period
How this strategy enters a trade (Long):
- code: entry_signal_long = ER > 0 and ER_is_mid
- meaning: when ER is positive, strategy assumes price has risen. Usually ER value begins high (red), and unless it is a false move, then it should stay positive. This strategy will patiently wait until ER drops to medium (yellow), and then place a trade.
- how low/medium/high is dynamically determined: Refer to the description of my other script("Kaufman's Efficiency Ratio Indicator") for details. Trying to keep this as short as possible.
How this strategy exits a trade (Long):
- when price hits stop limit; stop limit is based on low of bars, trails upward based on ATR
- included a feature called "tightening TSL", which tries to reduce the stop-buffer during periods of high volatility implied by ER (very experimental, opening the floor for suggestions on how this can be improved)

ADR PercentUses past 5 day's daily average ranges and calculates average ADR percentage with respect to latest day's open
Acknowledgement - Uses code from another excellent indicator from critian.d

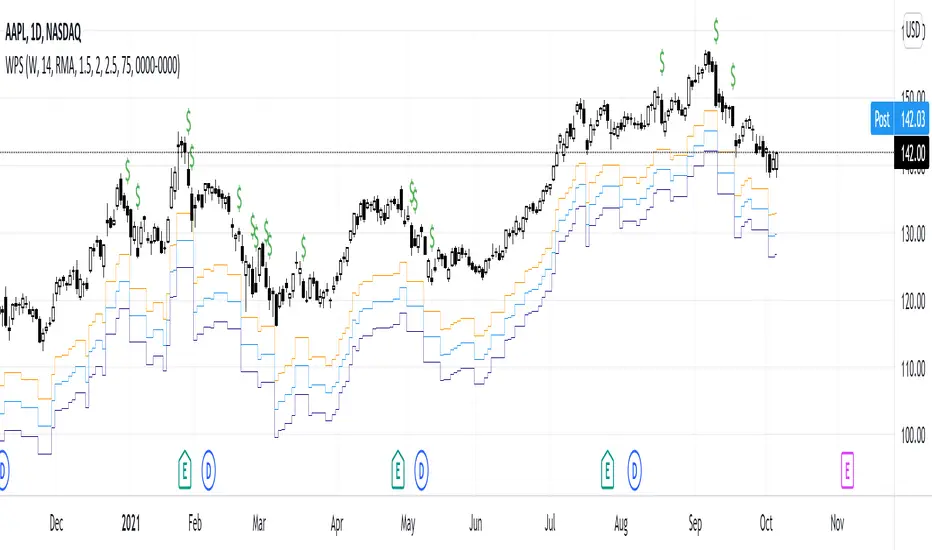
Weekly Put SaleWeekly Put Sale
This study is a tool I use for selling weekly puts at the suggested strike prices.
1. The suggested strike prices are based on the weekly high minus an ATR multiple which can be adjusted in the settings
2. You can also adjust the settings to Monthly strike prices if you prefer selling options further out
3. I suggest looking for Put sale premium that is between 0.25% to 0.75% of the strike price for weekly Puts and 1% to 3% of the strike price for monthly Puts
Disclaimers: Selling Puts is an advanced strategy that is risky if you are not prepared to acquire the stock at the strike price you sell at on the expiration date. You must make your own decisions as you will bear the risks associated with any trades you place. To sum it up, trading is risky, and do so at your own risk.
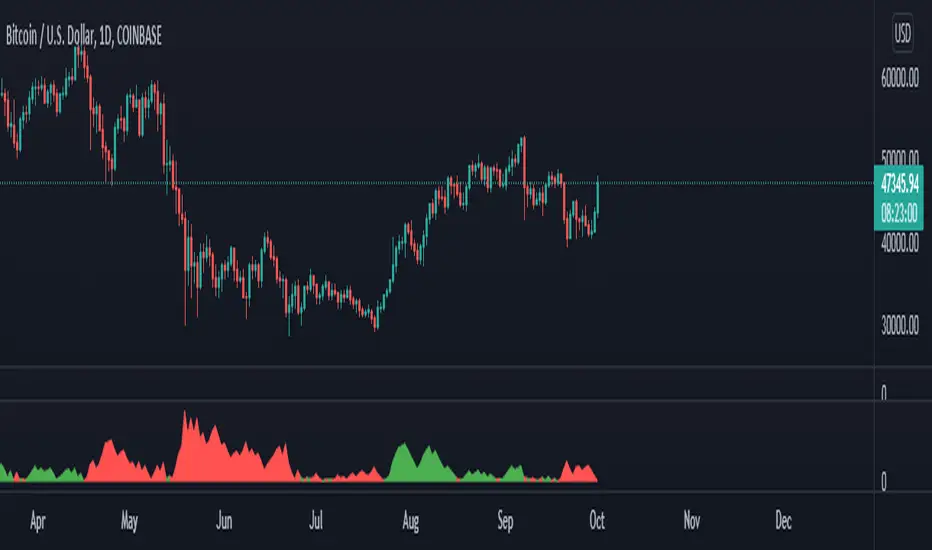
RSI Trend LineI took a concept similar to the "Adaptive RSI" to get the RSI overlaid on a price chart. The problem I have with the Adaptive RSI is to me it sticks too closely to price. I wanted something much more visually helpful that can provide actual tradable signals and strategies.
The orange line you are seeing is the "RSI Trend Line"
The further the RSI moves away from a value of 50 (the "zero line"), the more you see this orange line move away from price. This helps visualize the strength of price pushing away from a neutral value to a position of strength or weakness-- if orange is below price then relative strength is high; if orange is above price then relative strength is low. When price is equal to the orange RSI line, the RSI is at a value of 50.
In addition to the trend line, you can enable bands which reflect Overbought and Oversold levels . If you leave the responsiveness to a value of 1.0 and removed any smoothing, these should pretty accurately reflect an actual RSI chart topping the OB and OS lines (default 70 and 30, respectively). (They're still very close with different responsiveness and smoothing values)
The conversion or scaling of RSI value onto price comes with a bit of a quirk which I decided to leave to the user to determine how they want it applied. So the setting "Responsiveness" will impact the sort of aggressiveness of the RSI trend line as well as the the size of the bands. You could think of this in some ways as the OPPOSITE of the multiple setting on a Bollinger or Keltner band-- 1.0 will make for the widest band, 2.0 is the default and my preference, and you can move it up to a value of 5.0.
Here are some examples of how you could use the indicator for trade signals--
And here's my thought on the current state (as of 10/06) on indices with regards to this indicator-

ATR Bands Trailing StopsA NRTH_ Technical Indicator Study
Comes included with the Premium Package.
Indicator features
Use Trailing ATR as a StopLoss for both Long and Short positions.
Set Fixed Stop Loss or Take Profit levels based on current or previous candle close ATR values
Customizable Period, Multiplier, and Calculation Method.
Usage Tips
Works on all timeframes and markets.
Designed for use in other study strategies that do not have built-in position sizing.
Set Stoploss and RR based on ATR Values or let trades run into a trailing stop.
-------------------------------------------
Disclaimer
Copyright NRTH_ Indicators 2021.
NRTH_ and all affiliated parties are not registered as financial advisors. The products & services NRTH_ offers are for educational purposes only and should not be construed as financial advice. You must be aware of the risks and be willing to bear any level of risk to invest in financial markets. Past performance is not necessarily indicative of future results. NRTH_ and all individuals associated assume no responsibility for your trading results or investments.
All investments involve risk, and the past performance of a security, industry, sector, market, financial product, trading strategy, or individual’s trading does not guarantee future results or returns. Investors are fully responsible for any investment decisions they make. Such decisions should be based solely on an evaluation of their financial circumstances, investment objectives, risk tolerance, and liquidity needs.

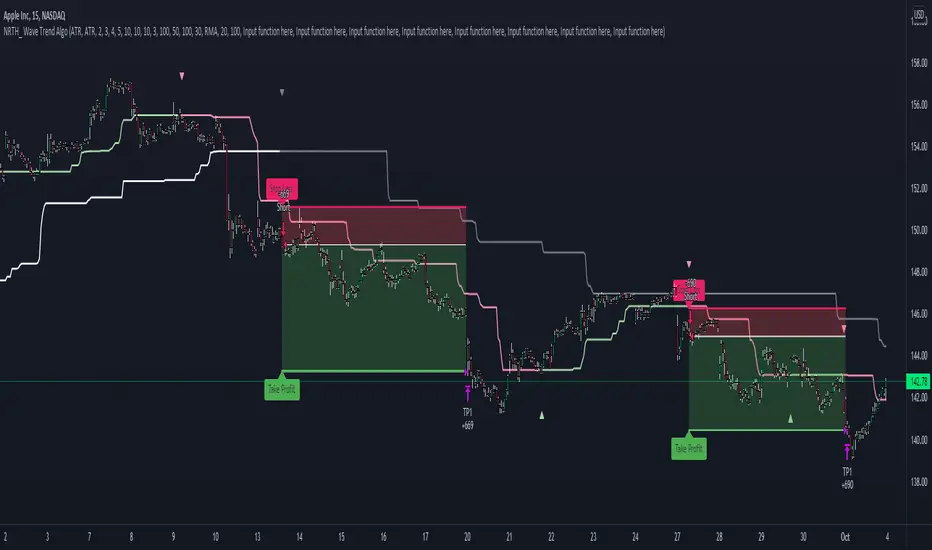
Wave Trend AlgoA NRTH_ Premium Double Trend Confirmation Algo
Comes included with the Premium Package.
Indicator features
Built-In Alerts
Visual Risk Management
Customizable Entry Rules
Usage Tips
This strategy works on timeframes as low as 15m, however not recommended for scalping with high fees.
Best performance with high Risk/Reward Ratios
The double trend confirmation (1 slow, 1 fast) uses lagging trend confirmation to your advantage, Identify confirmed moves and enter trades with high RR for the best results.
Works for all markets with the ability to customize to your liking.
Backtesting Results Info
Period 1/1/2021-1/10/2021
Entry value at $1000 with 100x leverage
ATR Exits : 1:3.3 RR
-------------------------------------------
Disclaimer
Copyright NRTH_ Indicators 2021.
NRTH_ and all affiliated parties are not registered as financial advisors. The products & services NRTH_ offers are for educational purposes only and should not be construed as financial advice. You must be aware of the risks and be willing to bear any level of risk to invest in financial markets. Past performance is not necessarily indicative of future results. NRTH_ and all individuals associated assume no responsibility for your trading results or investments.
All investments involve risk, and the past performance of a security, industry, sector, market, financial product, trading strategy, or individual’s trading does not guarantee future results or returns. Investors are fully responsible for any investment decisions they make. Such decisions should be based solely on an evaluation of their financial circumstances, investment objectives, risk tolerance, and liquidity needs.
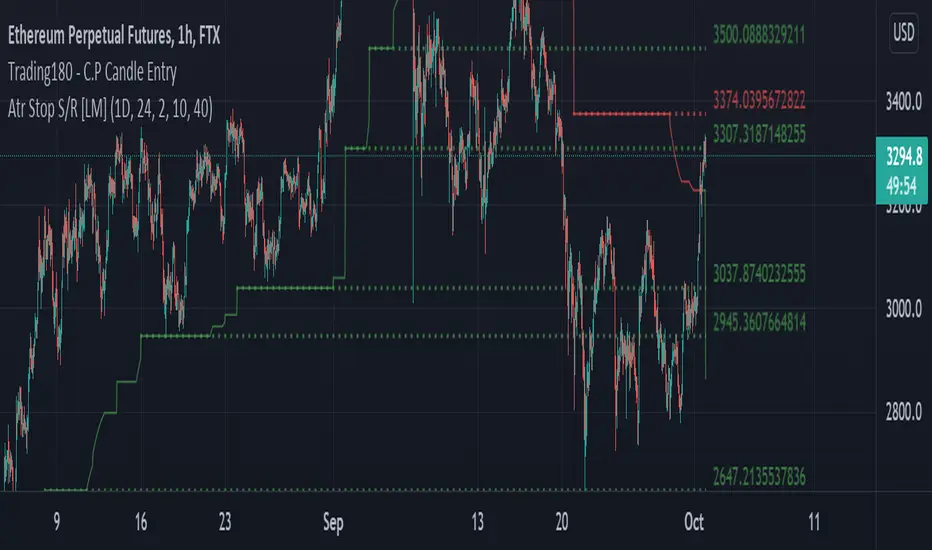
ATR Trailing Stops S/R [LM]Hello Traders,
I would like to introduce you ATR Trailing Stops S/R . The idea is to look for important levels that are identified by trailing stop line, where it usualy spents a lot of time without any move usualy turns out to be good level for bounces.
Script for atr trailing line is originaly taken from: script made by @dgmoon
It has various setting
Timeframe and atr settings
Show lines
Extend lines
Line count - how many lines will be rendered
Candle count - how many candles has to trailing line spend at the same level
Colors - controls color of plot and lines
I hope you will enjoy it, as I enjoyed to write it.
Lukas
+ ATR Support and ResistanceThis, a very different script from most of mine, is my attempt at making a useful, and not messy, support and resistance indicator. If you've never looked into trader xkavalis, and his scripts and discord, I would highly recommend it. He talks about "pay attention candles" a lot. It got me thinking about what those are. Best as I can tell all he means by that phrase is large, impulsive candles. Sometimes these lead to break outs of ranges, or they may signal tops, bottoms, or near-tops and bottoms. The only way I could make sense of this in a mathematical way was by using the average true range. Basically, any candle's true range outside of the ATR is considered a "pay attention candle," by my definition.
This script originally began as just a candle coloring exercise with some optional shapes plotted above/below certain candles, but I quickly realized I wanted to draw lines or zones from these candles, so eventually, after many hours spent figuring out and learning 'line.new' and 'box.new' I got things sorted.
Essentially, my line of thinking is that on impulsive candles down, the origin of the impulse is more important than the close (not always of course, as there are no unbreakable rules in what markets can do), and with impulsive candles up, the same theory applies.
So, for upward impulsive candles I've marked out the zone from the open to the low as a support (until broken, in which case it may become resistance). For downward impulsive candles the zone encompasses the open to the high. I've given the option to plot a line from the close for all of these. It's turned off by default as it's just less stuff on the chart, but you may like it.
The line length is customizable in a menu. It does funny things on low timeframes on forex and stock charts (long lines that result in chart compression), but for some reason very rarely on crypto charts. If someone who is smart (not me) and has much experience with pinescript could perhaps help me out with a fix for this, that would be great. I suspect it has something to do with my "bar_index_duration" that I defined using the time function, but I'm not sure how or why.
Line length on time frames of one hour and up it is typically fine.
Use the ATR multiple to change the sensitivity of the indicator. This is basically the determination of when a candle is beyond the ATR. A multiple of two is two times the ATR. With lower volatile pairs you can maybe make this lower. On lower time frames or with more volatile pairs (illiquid alts in particular) a higher multiple might serve better. I find the default 1.75 is mostly acceptable.
As I started this I also thought adding some sort of volume information to the candles might be useful as well, so I added a simple candle coloring feature referencing the OBV and a 21 period EMA. Candles are colored based on the OBV's relation to its moving average.
I added some plot shapes and candle coloring utilizing the RSI as well. Options to turn on or off shapes plotted for overbought and oversold across the top of the chart. The most interesting feature that I implemented here is a support/resistance zone around the centerline of the RSI. If the RSI is between 49 and 51 then you can have optional candle coloring, shapes plotted above the candles, and s/r zones drawn on the chart. In trending markets the centerline of the RSI will frequetly act as support or resistance, so by being alerted of this condition on the chart you can use that with actual levels marked off in order to help make a judgement on a trade. I think it's a nice addition, and an oft overlooked aspect of the usefulness of the RSI.
I've also included a calculation, with candle coloring and/or plot shapes, for something like a stop run on high volume. The calculation for that is in its section below, and should be pretty self explanatory.
Lastly, typing this as I'm posting it, this indicator could also be useful for helping to find placement for trailing a stop. Just a thought!

Volume Power Flow - Taylor V1Combination of Volume Average Trend & Volume Power Range
Able to Change Average Moving Type & Length = Depending on How Volatility /Smooth is Require on your Strategy
1# Color Green = The Volume On Trend Up
2# Color Red = The Volume On Trend Down
3# Spiking Higher Volume = End of the Top/ Bottom
3xATR + EMA 260 + TP SL By Nussara (Indicator)Exponential Moving Average
Moving averages smooth the price data to form a trend following indicator. They do not predict price direction, but rather define the current direction, though they lag due to being based on past prices. Despite this, moving averages help smooth price action and filter out the noise.
EMA=Price(t)×k+EMA(y)×(1−k)
where:
t=today
y=yesterday
N=number of days in EMA
k=2÷(N+1)
Average True Range
Average True Range ("ATR") was introduced by J. Welles Wilder in his 1978 book New Concepts In Technical Trading Systems. ATR is a measure of volatility for a stock or index
Calculation
ATR = (Previous ATR * (n - 1) + TR) / n
Where:
ATR = Average True Range
n = number of periods or bars
TR = True Range
The True Range for today is the greatest of the following:
Today's high minus today's low
The absolute value of today's high minus yesterday's close
The absolute value of today's low minus yesterday's close
3X ATR + EMA 260 Formula
1. ATR it indicates the market has a fluctuation. An indicator will check bar (High-Low) > 3 x ATR
2. EMA 260 identify the market uptrend or downtrend
- if condition (1) is true and the price closed above the EMA260 it’s an uptrend. An indicator will enter a long position.
- if condition (1) is true and the price closed below the EMA260 it’s a downtrend. An indicator will enter a short position.
Risk to Reward Ratio = 1:1.5
Stop loss = open price of entry position
This indicator is just a tool for technical analysis . It shouldn't be used as the only indication of trade because it causes you to lose your money. You should use other indicators to analyze together.

3xATR + EMA 260 + TP SL By NussaraStrategy backtest for 3X ATR + EMA 260
Exponential Moving Average
Moving averages smooth the price data to form a trend following indicator. They do not predict price direction, but rather define the current direction, though they lag due to being based on past prices. Despite this, moving averages help smooth price action and filter out the noise.
EMA=Price(t)×k+EMA(y)×(1−k)
where:
t=today
y=yesterday
N=number of days in EMA
k=2÷(N+1)
Average True Range
Average True Range ("ATR") was introduced by J. Welles Wilder in his 1978 book New Concepts In Technical Trading Systems. ATR is a measure of volatility for a stock or index
Calculation
ATR = (Previous ATR * (n - 1) + TR) / n
Where:
ATR = Average True Range
n = number of periods or bars
TR = True Range
The True Range for today is the greatest of the following:
Today's high minus today's low
The absolute value of today's high minus yesterday's close
The absolute value of today's low minus yesterday's close
3X ATR + EMA 260 Formula
1. ATR it indicates the market has a fluctuation. An indicator will check bar (High-Low) > 3 x ATR
2. EMA 260 identify the market uptrend or downtrend
- if condition (1) is true and the price closed above the EMA260 it’s an uptrend. An indicator will enter a long position.
- if condition (1) is true and the price closed below the EMA260 it’s a downtrend. An indicator will enter a short position.
Risk to Reward Ratio = 1:1.5
Stop loss = open price of entry position
This indicator is just a tool for technical analysis . It shouldn't be used as the only indication of trade because it causes you to lose your money. You should use other indicators to analyze together.
