%-[Guz] Vortex Indicator Custom// Custom Vortex Strategy (backtester)
// Custom version of the Vortex indicators that adds many features:
// -Triggers trades after a threshold is reached instead of the normal vortex lines cross (once the difference between the 2 lines is important enough)
// -Smooths the Vortex lines with an EMA
// -Adds Take Profit and Stop Loss selection
// -Adds the possibility to go Long only, Short only or both of them
// ! notice that it uses 10% position size and 0.04% trade fee, found on some crypto exchanges futures contracts
// Allows testing leverage with position size modification (values above 100% position size, to be done with caution)
// Not an investment advice
真實波幅均值(ATR)

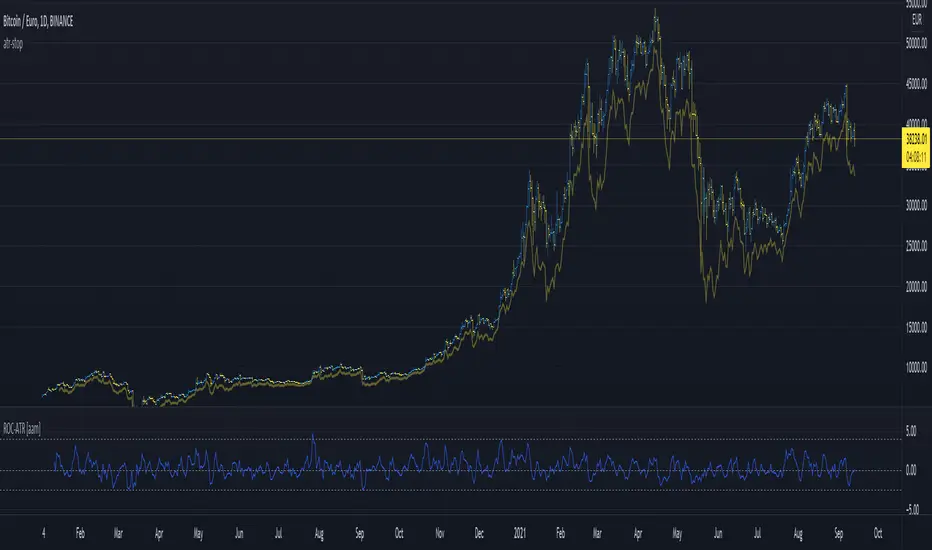
Rate Of Change ATRThis is a very basic, but powerful script.
It gives you the ratio between the rate of change of the last x days and the average true range of the last y days.
---> ROC-ATR Ratio = ROC/ATR
Therefore, you can see how much the price has moved relative to the prices in the past.
This is important because (in my opinion) the basic ROC indicator is not very meaningful if you don't look at the average volatility of recent history.
For example, a ROC of 5% over the last 3 days might be very high for Forex but very small for some crypto.
Consequently, this indicator makes it possible to compare (and be used on) every instrument in every industry the same way.
Generally speaking, it makes more sense if the ATR length is larger than the ROC length.
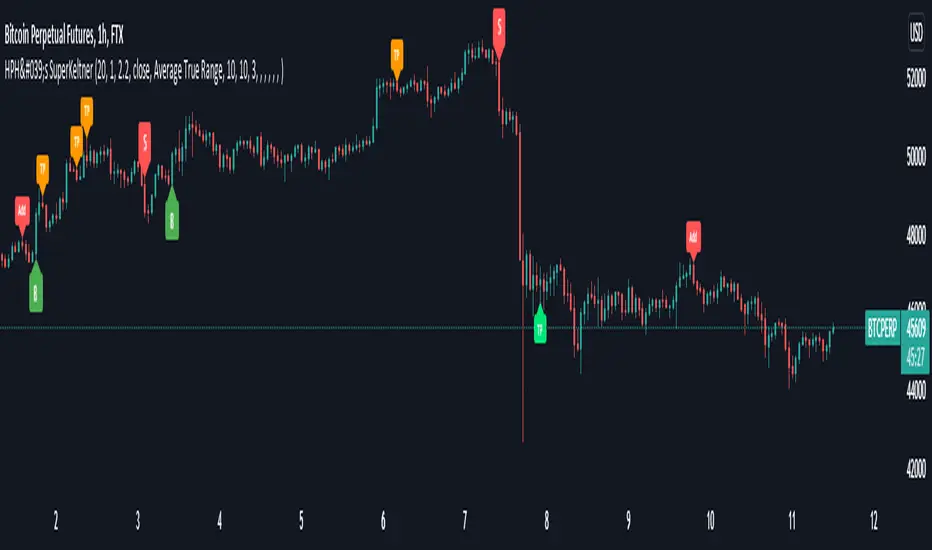
HPH's SuperKeltnerThis indicator combines the Supertrend (to determine the main trend direction) with two Keltner channels (used for add and take profit signals) to construct a trend trading system.
These are the available settings:
General
UseTrendChange ➞ toggle trend change alerts and labels
UseAdds ➞ toggle add to position alerts and labels
UseTakeProfits ➞ toggle take profit alerts and labels
PrematureAdds ➞ toggle adding to position as soon as the add channels are left (default is false, so the add signal will only fire once the channels are re-entered)
PrematureTakeProfits ➞ toggle taking profit as soon as the tp channels are left (default is false, so the tp signal will only fire once the channels are re-entered)
Visualization
Show Add Keltner ➞ toggle display of the channels used for adding to the position
Show TP Keltner ➞ toggle display of the channels used for taking profit
Show SuperTrend ➞ toggle display of the Supertrend
Keltner
Standard Keltner channels settings except for the fact that there are two different multipliers. The Keltner TP Multiplier should generally be bigger than the Keltner Add Multiplier , as the channels are hit differently in trending markets. I recommend you to use the visualization settings to show the channels and adjust the settings to your liking.
Supertrend
Standard Supertrend settings, nothing to add here.
Alerts
Use the alert messages to customize what alert text the indicator will send. This makes it possible to use the script to automate trading bots.
By default, the alerts are sent after the candle has closed. This ensures that no repainting is happening. If you like the risk, you can toggle the corresponding WaitFor Confirmation if you wish to receive the signals earlier (max. once per bar).
Enjoy!
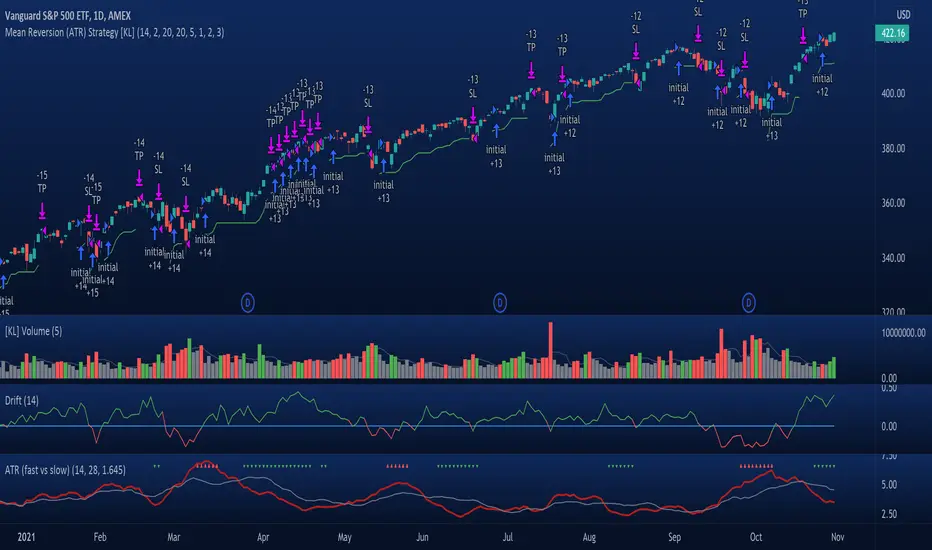
[KL] Mean Reversion (ATR) StrategyThis strategy will enter into a position when price volatility is relative high, betting that price will subsequently trend in a favourable direction.
Hypothesis : During periods of high price volatility, ATR will divert from its moving average by at least +/- one standard deviation. Eventually, ATR will revert back to the mean. However, just knowing the magnitude of increase/decrease of ATR does not give a trend signal, so we need to introduce a model in this script to predict whether the next bars will be up/down.
Trend Prediction : This strategy calculates the expected logarithmic return of the security (the "Drift") and considers prices to be moving in uptrend if the drift curve is upward sloping or if the drift value is positive.
Entry Conditions : Long position is entered when:
(a) ATR has diverted from mean by one standard deviation, and
(b) trend is predicted to move in our favor.
Exit Condition : When trailing stop loss is hit.
Results from backtesting against VOO (1H timeframe):
- approx 46% win rate over 491 trades, on average holding for 20 hours per trade
- price at the beginning of backtest (Jan. 2015) was $187.52, giving holding period return of ~120% had we not sold in between ("HPR of HODL'ing")
- this strategy gained ~159%, exceeding ~120% HPR of HODL'ing
Berzerker IndexSome pairs have their own distinct behavior. That includes volatility, news reactiveness, trend x chop day discrepancy, and other qualities.
At first, I tried to measure this with the Choppiness Index, but it looks pretty much alike when you compare symbols like EURNZD and GBPCAD, but my testing shows some major behavioral differences between the two. Hence, I decided to build my own measurement which I later decided to call Berzerker Index.
• The calculation takes the previous value and adds 1, 3, 7, or 15 depending on how many standard deviations the price beats.
• Deviations use Jurik Moving Average as a central line. If there is no new penetration, the total value will not be increased.
• At the end of the value update, the result will decay whether it is changed or not. The readings decay significantly faster if the price is between the bands.
• The beginning of the calculation is the beginning of the chart. There isn't any period for the calculation.
As you can see, from the beginning of the year, the maximum readings on EURNZD are 49.8 and 73.6 for GBPCAD. This is what I wanted to achieve - find some way to clearly differentiate the pairs. Later, I went on EURUSD to confirm the results. EURUSD should be a calmer pair and it shows 33.5 which supports the theory.
The symbols with small bars and explosions on events and bank meetings will reach high values, whereas those that are more predictable with less extreme movements will be found below 45.
Lastly, you may identify long periods of continuous descend on the indicator as setting up for a large explosion. This is not the original idea but could work nevertheless.
Of course, I will further update this indicator if I get improvement ideas...
FAQ:
► Does this repaint?
• No.
► Where is the buy signal?
• There isn't one. The purpose is to study repeated behavioral patterns of different symbols, not to drink from the holy grail.
► Why is it called the 'Berzerker' Index?
• I don't know.
I used @everget's version of Jurik's Moving Average with his consent.
What do ya thing?

Wavy Tunnel + Trend ATR Buy Sell Signal by PaRnWavy Tunnel + Trend ATR Buy Sell Signal by PaRn
Originality by PaRn
First Combination of Wavy Tunnel + Trend ATR Buy Sell Signal by PaRn
"Buy Sell Signal" is base on Volatility Stop 20, Multiplier 2.5
"Trend Signal" is based on EMA crossover between EMA12(Close) and EMA26(Close)
Take Profit Line is EMA15(Default)
Wavy line Base on EMA34(high,close,low)
Tunnel line Base on EMA144(close),EMA169(close)
Green Candle Bar = "Uptrend"
Red Candle Bar = "Downtrend"
Buy when "Buy" Signal present
Follow Trend till the end of the trend : "Sell" Signal present
Buy More (Optional) = Green Arrow present on Uptrend
How to use Wavy Tunnel + Trend ATR Buy Sell Signal by PaRn
- Wavy Tunnel + Trend Signal can be used in any timeline from 5 Minutes to Weeks
- Price above both Wavy & Tunnel = "Uptrend"
- Green Candle Bar = Uptrend
- Buy when "Buy" Signal present
- Buy More (Optional) = Green Arrow present on Uptrend
- Hold your possition and Follow Trend till the end of the trend : "Sell" Signal present, It's time to sell all position
NOT RECOMMEND TO USE ON SIDEWAY MARKET

Strategy Template - V2This is an educational script created to demonstrate few basic building blocks of a trend based strategy and how to achieve different entry and exit types. My initial intention was to create a comprehensive strategy template which covers all the aspects of strategy. But, ended up creating fully fledged strategy based on trend following.
This is an enhancement on Strategy-Template But this script is comparitively more complex. Hence I decided to create new version instead of updating the existing one.
Lets dive deep.
SIMPLE COMPONENTS OF TREND FOLLOWING STRATEGY
TREND BIAS - This defines the direction of trend. Idea is not to trade against the trend direction. If the bias is bullish, look for long opportunities and if bias is bearish, look for short opportunities. Stay out of the market when the bias is neutral.
Often, trend bias is determined based on longer timeframe conditions. Example - 200 Moving Average, Higher timeframe moving averages, Higher timeframe high-lows etc. can be used for determining the trend bias.
In this script, I am using Weekly donchian channels combined with daily donchian channels to define trend bias.
Long Bias - 40 Day donchian channel sits completely in upper portion of 40 Week dochnial channel.
Short Bias - 40 Day donchian channel sits completely in lower portion of 40 Week donchian channel.
ENTRY CONDITION - Entry signals are generated only in the direction of bias. Hence, when in LongBias, we only get Long signals and when in short bias, we only get short signals.
In our case, when in Long Bias - if price hits 40 day high for the first time, this creates our long entry signal. Similarly when in Short Bias , price hitting 40 day low will create signal for going short. Since we do not take trades opposite to trend, no entry conditions are formed when price hits 40 day high in Short Bias or 40 day low in Long Bias.
EXIT CONDITION - Exit conditions are formed when we get signals of trend failure.
In our case, when in long trade, price hitting 40 day low creates exit signal. Similarly when in short trade price hitting 40 day high creates exit signal for short trade.
DIFFERENT TYPES OF ENTRY AND EXIT
In this script, I have tried to demonstrate different entry and exit types.
Entry types
Market - Enter immediately when entry signal is received. That is, in this case when price crossover over high in long bias and crosses under low in short bias
Stop - This method includes estimating at what level new highs are made and creating a stop buy order at that level. This way, we do not miss if the break out is stronger. But, susciptible to fail during fakeouts.
Limit - This method includes executing a limit order to buy at lower price or sell at higher price. In trend following methods, downside of limit order is when there is genuine breakout, these limit orders may not hit and during trend failures the limit orders are likely to hit and go straight to stop.
Stop-Limit - this is same as stop order but will also place a limit condition to avoid buying on overextended breakout or with lots of slippage.
Exit types
Market - whether to keep the existing trade running or whether to close it is determined after close of each bar and exit orders are executed manually upon receiving exit signal.
Stop - We place stop loss orders beforehand when there is a trade in place. This can help in avoiding big movements against trade within bar. But, this may also stop on false signals or fakeouts.
Take profit
Stop - No take profits are configured.
Target - 30% of the positions are closed when take profit levels are hit. Take profit levels are defined by risk reward.
USING THE CODE AS TEMPLATE
As mentioned earlier, I intended to create a fully fledged strategy template. But, ended up creating a fully fledged stratgy. However, you can take some part of this code and use it to start your own strategy. Will explain what all things can be adopted without worrying about the strategy implementation within
Strategy definition : This can be copied as is and just change the title of strategy. This defines some of the commonly used parameters of strategy which can help with close to realistic backtesting results for your coded strategy and comparison with buy and hold.
Generic Strategy Parameters : The parameter which defines controlling alllowed trade direction and trading window are present here. This again can be copied as is and variable inDateRange can be directly used in entry conditions.
Generic Methods : f_getMovingAverage and f_secureSecurity are handy and can be used as is. atr method provideded by pine gives you ATR based on RMA. If you want SMA or any other moving average based ATR, you can use the method f_getCustomAtr
Trade Statements : This section has all types of trading instructions which includes market/stop/limit/stop-limit type of entries and exits and take profit statements. You can adopt the type of entry you are interested in and change when condition to suit your strategy.
Trade conditions and levels : This section is required. But, cannot be copied. All the trade logic goes here which also sets parameters which are used in when of Trade Statements.
Hope this helps.

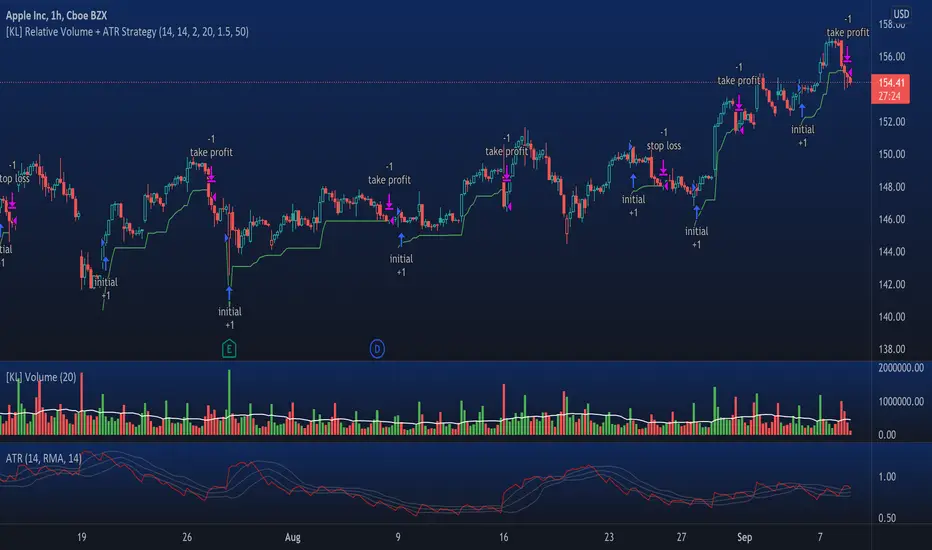
[KL] Relative Volume + ATR StrategyThis strategy will enter into long position when (a) current volume is above the average volume, and when (b) volatility of prices (based on ATR) is relatively low.
Backtested on hourly timeframes, win rates range between 35% to 50% on stocks with positive drifts (i.e. tendency to move upwards). Default setups are as follows:
- Average volume is computed using simple moving average (sma) of 14 periods. By default, 1.4x ratio seems to work well on most large cap stocks. If it's too high, then amount of potential points for entry will decrease. But if it's too low, then this indicator becomes meaningless.
- ATR (for determining volatility), look back period is 14 (following conventions). I have noticed that the profits could change drastically when changed to different values for each individually security. Feel free to experiment around with this parameter.
Other information: This strategy is based off of one of my previous scripts; a script called "Relatively Volume Strategy". The objective of this new script is to simplify the process of determining periods of low volatility. In this new script, we assume prices are consolidating when current ATR is within its moving average value by +/- one standard deviation.
Altcoin Bullrun Guide (4H) by CoinMonitorThis script helps navigate the bullish altcoin market and find the optimal entry points with pre-calculated stop orders. Trade entry is indicated by a gray plate, the stop order level is indicated by a green line. The stop order level must be moved behind the trade until a plate with the result of the trade appears (green - profit, red - loss). The script works optimally on a four-hour timeframe.
The trade will be exited if:
The price will fix below the trend moving line with two candles
The price will cross the stop order level

Ticker SummaryTicker Summary provides at-a-glance summary information about a ticker near the current bar on the chart:
P/E ratio
Fwd P/E ratio
PEG ratio
Floating shares vs. total shares outstanding
% of trading volume that was short over the last 3 days
Average True Range (ATR) over last 14 days
There are a few less common items of information:
How many ATR multiples the ATR is extended over the last 10 bars. This gives an idea of how far the stock is currently extended.
"R-frequency", explained below.
An optional "ATR Reticule" is shown near the price. This is useful for traders that use ATR as a guideline for price targets and stop losses. On the left is the # of ATRs the stock is currently above the session open. On the right is the # of ATRs the stock is extended above the 10-bar moving average.
R-frequency: a measure of liquidity relevant to your own trading size. It is the frequency at which 1-R of your trading account is traded for a stock. Formula:
(1-R worth of shares) / (average dollar value traded per second), where:
"1-R worth of shares" is how many shares you would buy for a stop loss of -1 ATR, with max risk dollar value based on the Balance and Max Risk % indicator options.
"Average dollar value traded per second" is the 14-day average of (avg(high, low and close) * daily volume)
R-frequency of a second or less is very liquid. If the value is higher (for example, over 60 seconds) the stock is less liquid and you may have some trouble filling limit orders quickly.

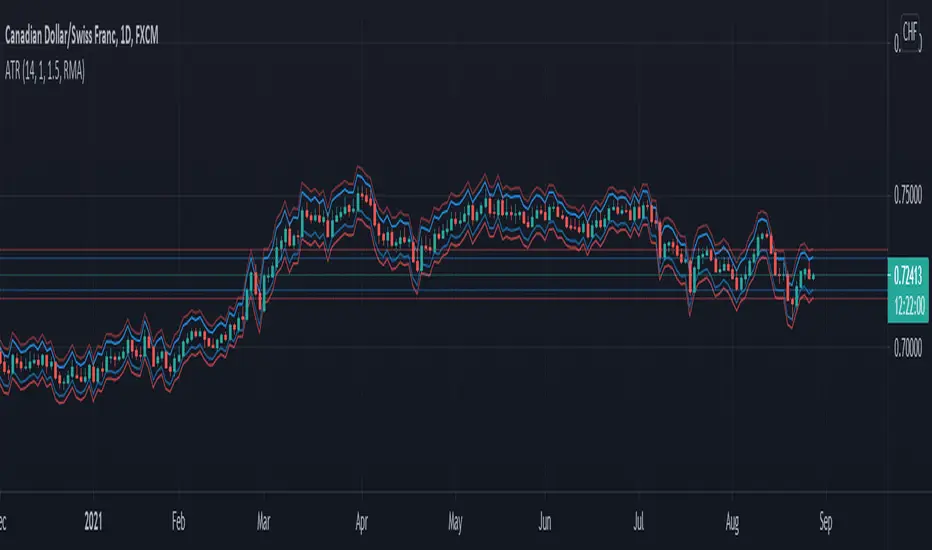
NNFX ATRBefore I begin I want to mention:
1. This is an indicator specially made for NNFX traders who use the ATR rule of ATR1x for Take Profit and ATR1.5x for Stop Loss
2. It is a product of combining the in-built ATR and Dillon Grech's ATR ()
The indicator:
1. It can be used for a quick look using the lines to see instead of calculating whether price hit a TP or SL. However I have kept the Main ATR for those who want to record the ATR into the spreadsheet when back testing or forward testing
2. When placing a buy/long order, TP is blue and appears above price, SL is red and appears below price
3. When placing a sell/short order, TP is blue and appears below price, SL is red and appears above price
4. The Main ATR, which is yellow, is way below price because I didn't want the chart to be overwhelmed by a 5th line in the middle of 2 TPs and SLs aka make the chart look claustrophobic
ATR Start & Stop BotThis script is using Average True Range (ATR) and works very well on the Bitcoin 4 hour timeframe to determine when to stop and start your bots.
It has a very similar visual to the EMA RSI Indicator found here:
This 'ATR Start & Stop Bot' is better because it has less confusion during sideways market movement.
As an example - You are using 3commas and have a Composite bot setup with several alt coins, you can use this indicator with the ' Stop bot ' alert to disable your composite bot from taking trades at times when the market is on a trend that looks in the red.
Alternatively you can use the ' Start bot ' alert to turn your bot back on during the green uptrends.
Using this indicator with these alerts on the Bitcoin 4-Hour chart add a great layer of automation to your already existing bots.
Credits:
Original 'ATR Stops' indicator belong to the user failathon and that script is found here:
Also credits to Dradian for the alert additions.

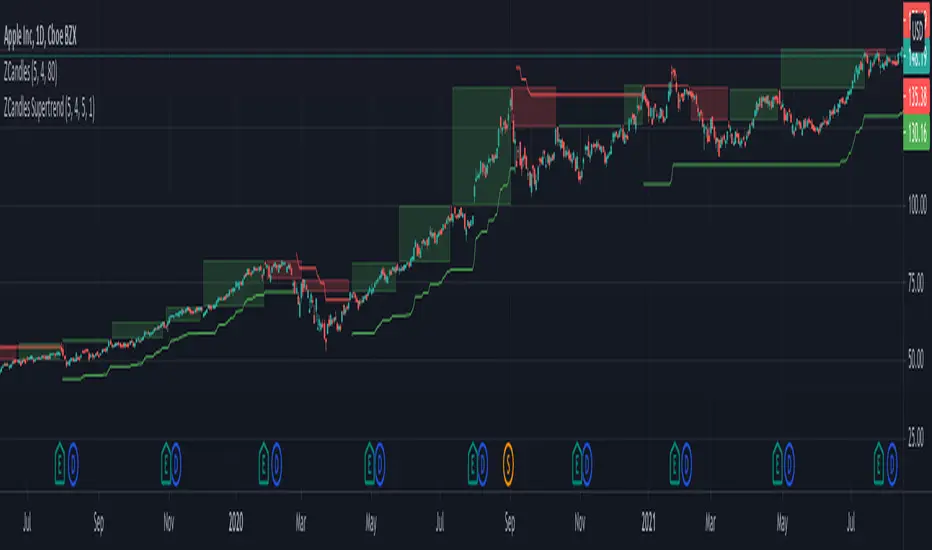
Zigzag Candles SupertrendHere it is, as promised, supertrend based on Zigzag candles.
Earlier scripts on the Zigzag Candles expedition are here:
Zigzag-Candles
Zigzag-Candles-MA
Zigzag candles parameters Length and CandleSize remain as is. Along with this, we also add MALength and AtrMult to calculate ATR based on the new candles and to use it to derive supertrend.
UseZigzagCandles - selecting this will apply supertrend on zigzag candles and ignore the actual price candles completely.
UseClosePrices - Uses close price as base instead of high/low. Can be used in both modes of price candles and zigzag candles.
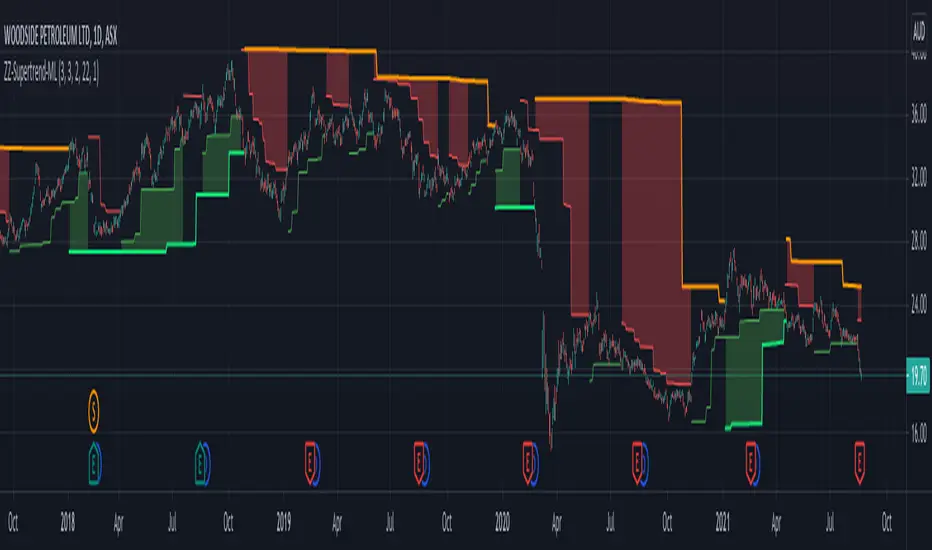
Multilevel ZigZag SupertrendVery much similar to :
I have slightly changed code to accommodate multiple zigzags. Also removed possibility of external source to keep it simple.
Indicator shows 2 Level zigzag based supertrends. Second zigzag used is multi level zigzag and hence, this acts as higher timeframe filter and can be considered as overall trend bias.
REMORA StrategyStrategy:
Finding entry using pullback or Buy On Dip method.
This indicator using EMA line and ATR strategy to find best entry.
EMA line consist of :
EMA 20, EMA 50 and EMA 90.
Entry signal when candle rebound on EMA line and rocket signal appeared.
Exit when "SL" signal appeared.

Av3Based on the ANNE EA v3 for MT4. For use on FOREX.
if ATR is greater than ATR average taken from last 5 candles, then market considered as trending, and so Open(0)>Close(1)=buy Open(0)Close(1)=sell Open(0)
